

Optimal gamma-band entrainment of visual cortex
- PMID: 38970249
- PMCID: PMC11226544
- DOI: 10.1002/hbm.26775
Optimal gamma-band entrainment of visual cortex
Abstract
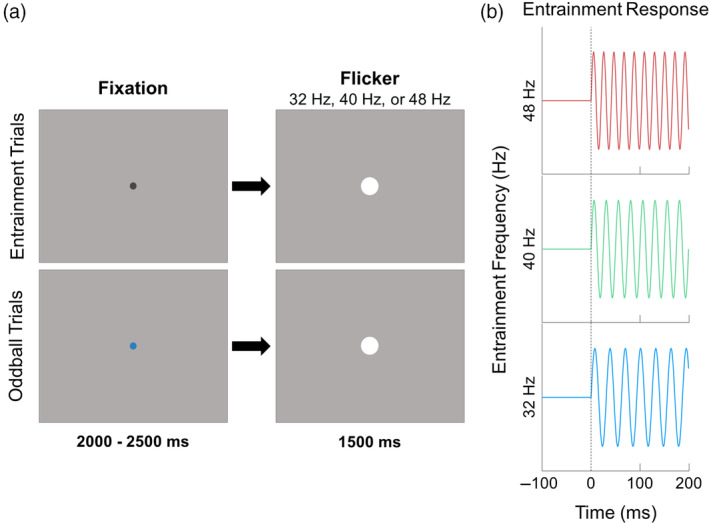
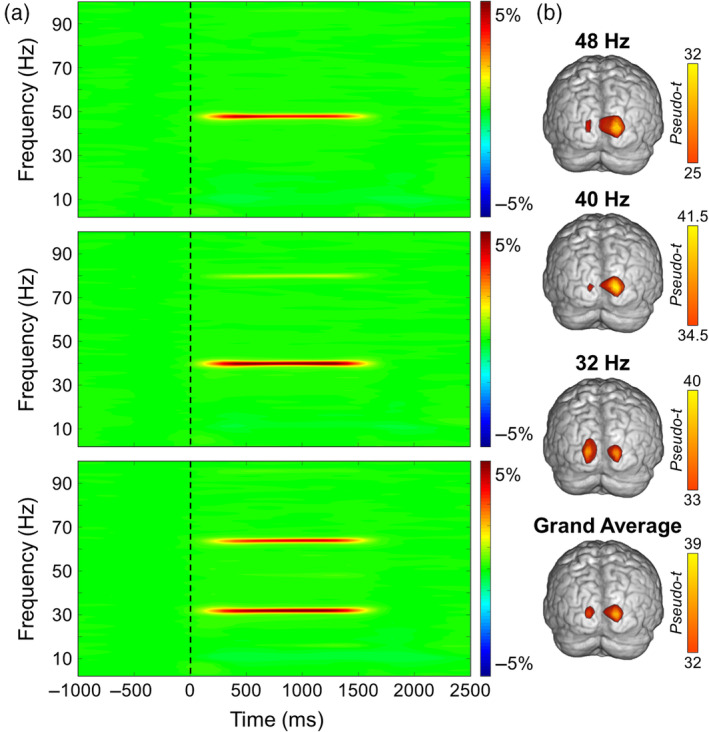
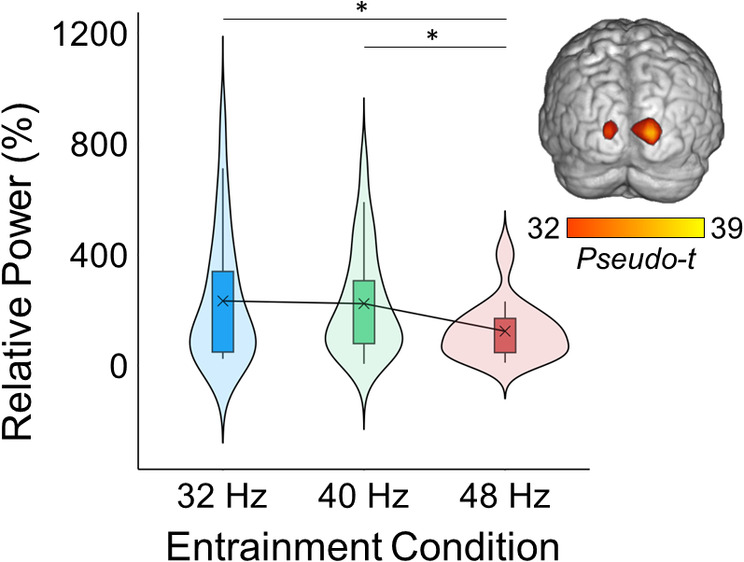
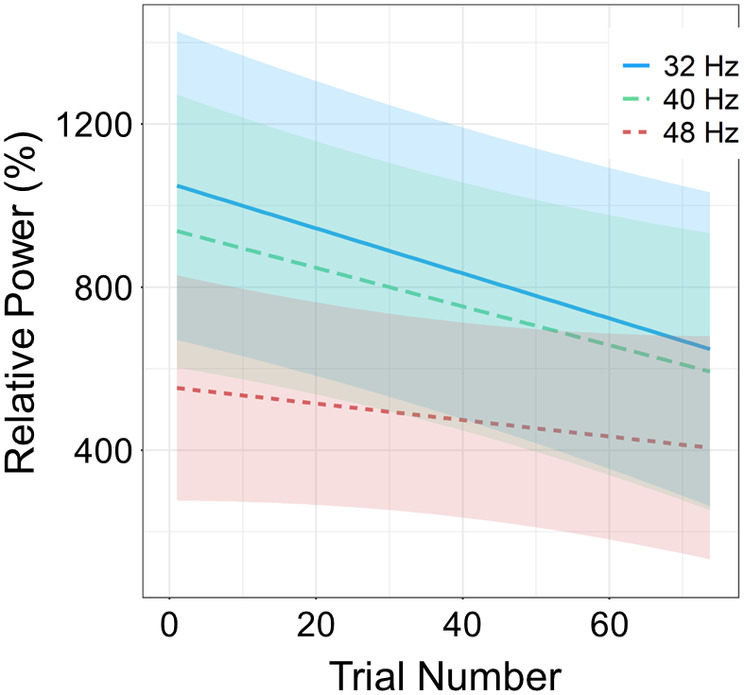
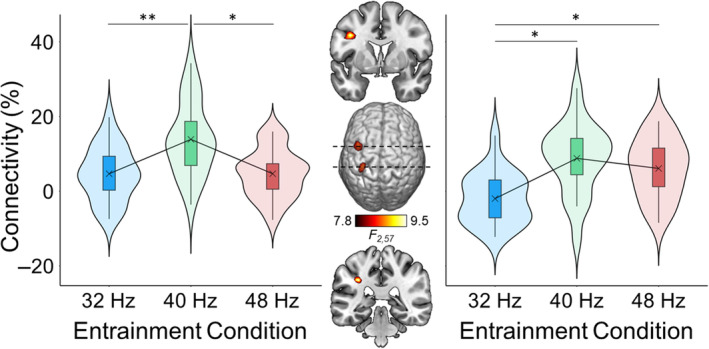
Visual entrainment is a powerful and widely used research tool to study visual information processing in the brain. While many entrainment studies have focused on frequencies around 14-16 Hz, there is renewed interest in understanding visual entrainment at higher frequencies (e.g., gamma-band entrainment). Notably, recent groundbreaking studies have demonstrated that gamma-band visual entrainment at 40 Hz may have therapeutic effects in the context of Alzheimer's disease (AD) by stimulating specific neural ensembles, which utilize GABAergic signaling. Despite such promising findings, few studies have investigated the optimal parameters for gamma-band visual entrainment. Herein, we examined whether visual stimulation at 32, 40, or 48 Hz produces optimal visual entrainment responses using high-density magnetoencephalography (MEG). Our results indicated strong entrainment responses localizing to the primary visual cortex in each condition. Entrainment responses were stronger for 32 and 40 Hz relative to 48 Hz, indicating more robust synchronization of neural ensembles at these lower gamma-band frequencies. In addition, 32 and 40 Hz entrainment responses showed typical patterns of habituation across trials, but this effect was absent for 48 Hz. Finally, connectivity between visual cortex and parietal and prefrontal cortices tended to be strongest for 40 relative to 32 and 48 Hz entrainment. These results suggest that neural ensembles in the visual cortex may resonate at around 32 and 40 Hz and thus entrain more readily to photic stimulation at these frequencies. Emerging AD therapies, which have focused on 40 Hz entrainment to date, may be more effective at lower relative to higher gamma frequencies, although additional work in clinical populations is needed to confirm these findings. PRACTITIONER POINTS: Gamma-band visual entrainment has emerged as a therapeutic approach for eliminating amyloid in Alzheimer's disease, but its optimal parameters are unknown. We found stronger entrainment at 32 and 40 Hz compared to 48 Hz, suggesting neural ensembles prefer to resonate around these relatively lower gamma-band frequencies. These findings may inform the development and refinement of innovative AD therapies and the study of GABAergic visual cortical functions.
Keywords: MEG; gamma activity; magnetoencephalography; visual entrainment.
© 2024 The Author(s). Human Brain Mapping published by Wiley Periodicals LLC.
Conflict of interest statement
All authors report no biomedical financial interests or potential conflicts of interest.
Figures
References
-
- Abdulhussein, M. A. , An, X. , Alsakaa, A. A. , & Ming, D. (2022). Lack of habituation in migraine patients and evoked potential types: Analysis study from EEG signals. Journal of Information and Optimization Sciences, 43(4), 855–891. 10.1080/02522667.2022.2095958 - DOI
-
- Adaikkan, C. , Middleton, S. J. , Marco, A. , Pao, P.‐C. , Mathys, H. , Kim, D. N.‐W. , Gao, F. , Young, J. Z. , Suk, H.‐J. , Boyden, E. S. , McHugh, T. J. , & Tsai, L.‐H. (2019). Gamma entrainment binds higher‐order brain regions and offers neuroprotection. Neuron, 102(5), 929–943.e8. 10.1016/j.neuron.2019.04.011 - DOI - PMC - PubMed
-
- Angelini, L. , de Tommaso, M. , Guido, M. , Hu, K. , Ivanov, P. C. , Marinazzo, D. , Nardulli, G. , Nitti, L. , Pellicoro, M. , Pierro, C. , & Stramaglia, S. (2004). Steady‐state visual evoked potentials and phase synchronization in migraine patients. Physical Review Letters, 93(3), 038103. 10.1103/PhysRevLett.93.038103 - DOI - PubMed
-
- Arif, Y. , Wiesman, A. I. , O'Neill, J. , Embury, C. , May, P. E. , Lew, B. J. , Schantell, M. D. , Fox, H. S. , Swindells, S. , & Wilson, T. W. (2020). The age‐related trajectory of visual attention neural function is altered in adults living with HIV: A cross‐sectional MEG study. eBioMedicine, 61, 103065. 10.1016/j.ebiom.2020.103065 - DOI - PMC - PubMed
MeSH terms
Grants and funding
- P20-GM144641/NH/NIH HHS/United States
- P20 GM144641/GM/NIGMS NIH HHS/United States
- R01 DA047828/DA/NIDA NIH HHS/United States
- R01 DA056223/DA/NIDA NIH HHS/United States
- R01-MH116782/NH/NIH HHS/United States
- S10 OD028751/OD/NIH HHS/United States
- F30-AG076259/NH/NIH HHS/United States
- S10-OD028751/NH/NIH HHS/United States
- R01-MH118013/NH/NIH HHS/United States
- R01-DA056223/NH/NIH HHS/United States
- F30 AG076259/AG/NIA NIH HHS/United States
- R01 MH118013/MH/NIMH NIH HHS/United States
- R01-DA047828/NH/NIH HHS/United States
- R01 MH116782/MH/NIMH NIH HHS/United States
LinkOut - more resources
Full Text Sources
