. 2025 Feb;19(2):412-429.
doi: 10.1002/1878-0261.13700. Epub 2024 Jul 6.

Detection of colorectal-cancer-associated bacterial taxa in fecal samples using next-generation sequencing and 19 newly established qPCR assays

Affiliations

Detection of colorectal-cancer-associated bacterial taxa in fecal samples using next-generation sequencing and 19 newly established qPCR assays

Thulasika Senthakumaran et al. Mol Oncol. 2025 Feb.

Abstract

We have previously identified increased levels of distinct bacterial taxa within mucosal biopsies from colorectal cancer (CRC) patients. Following prior research, the aim of this study was to investigate the detection of the same CRC-associated bacteria in fecal samples and to evaluate the suitability of fecal samples as a non-invasive material for the detection of CRC-associated bacteria. Next-generation sequencing (NGS) of the 16S ribosomal RNA (rRNA) V4 region was performed to evaluate the detection of the CRC-associated bacteria in the fecal microbiota of cancer patients, patients with adenomatous polyp and healthy controls. Furthermore, 19 novel species-specific quantitative PCR (qPCR) assays were established to detect the CRC-associated bacteria. Approximately, 75% of the bacterial taxa identified in biopsies were reflected in fecal samples. NGS failed to detect low-abundance CRC-associated taxa in fecal samples, whereas qPCR exhibited high sensitivity and specificity in identifying all targeted taxa. Comparison of fecal microbial composition between the different patient groups showed enrichment of Fusobacterium nucleatum, Parvimonas micra, and Gemella morbillorum in cancer patients. Our findings suggest that low-abundance mucosa-associated bacteria can be detected in fecal samples using sensitive qPCR assays.

Keywords: 16S rRNA amplicon sequencing; colorectal cancer; contaminant species; fecal microbiota; mucosal microbiota; qPCR.


Conflict of interest statement

The authors declare no conflict of interest.

Figures
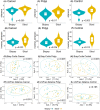
Fig. 1
Fig. 1
Comparison of microbial profiles between biopsy and fecal samples. (A–F) Violin plots with box plots of Shannon and inverse Simpson alpha diversity indexes in biopsy and fecal samples (Stool) from cancer group, adenomatous polyp (polyp) group, and healthy controls. Kruskal–Wallis test revealed significant differences in diversity indexes between sample types, in all three groups. (G–L) Principal Coordinate Analysis (PCoA) plots based on Bray–Curtis distance matrix and weighted UniFrac distance for biopsies and fecal samples. Permutational analysis of variance (PERMANOVA) showed significant differences in microbial composition between biopsies and fecal samples in all patient groups based on Bray–Curtis dissimilarity. Weighted UniFrac index showed significant differences in cancer group and adenomatous polyp group, but not in healthy controls.
Fig. 2
Fig. 2
Microbial composition in biopsy and fecal samples. (A) Significantly differentially abundant genera between biopsy and fecal samples. Negative log2 fold change means less abundance in fecal samples. The colorectal cancer‐associated genera Fusobacterium, Leptotrichia, and Campylobacter are significantly less abundant in fecal samples. (B) Relative abundance of genera that were only present in biopsy (data from 16S ribosomal RNA (rRNA) amplicon sequencing).
Fig. 3
Fig. 3
Correlation of relative abundance (obtained from 16S ribosomal RNA (rRNA) amplicon sequencing data) of taxa between sample types. (A) Correlation of relative abundance of identified taxa at phylum, family, and genus levels between paired biopsies and fecal samples from cancer patients, patients with adenomatous polyps and control patients. One biopsy from each participant, namely tumor biopsy from cancer patients, polyp biopsy from adenomatous polyp patients, and biopsy from colon sigmoideum from healthy controls was selected for this analysis. Spearman rank correlation indicates a strong correlation between sample types at all three levels. (B) Spearman correlation of taxa at family level between fecal samples and each biopsy site in cancer patients. Microbial composition at colon sigmoideum showed more similarity to fecal samples (r = 0.89). Meanwhile, microbiota at tumor site is less correlated with fecal samples (r = 0.69). Taxa with < 10 reads were discarded in both datasets. 0.000001 is added to the sum of relative abundance of all taxa. Dark blue points represent taxa that were present only in fecal samples, and purple points represent taxa that were present only in biopsy samples.
Fig. 4
Fig. 4
Genera that were enriched and depleted between the cancer group and the adenomatous polyp group or the healthy controls (P < 0.05). Data obtained from 16S ribosomal RNA amplicon sequencing. (A) Cancer group vs healthy controls at genus level. (B) Cancer group vs adenomatous polyp group at genus level. Abundance of Fusobacterium, Parvimonas, and Prevotellaceae_NK3B31 were higher in cancer group compared to adenomatous polyp group and healthy controls.
Fig. 5
Fig. 5
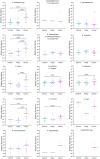
The figure illustrates the presence of colorectal cancer‐associated bacteria in healthy controls, patients with adenomatous polyp and cancer patients. Abundance is plotted in relative abundance (2−ΔCt). Fusobacterium nucleatum ssp, Gemella morbillorum, and Peptostreptococcus stomatis are over‐represented in cancer patients compared to patients with adenomatous polyp and healthy controls (Kruskal–Wallis Test). Granulicatella adiacens and Campylobacter concisus are over‐represented in cancer compared to healthy controls. Meanwhile, Parvimonas micra is over‐represented in cancer compared to adenomatous polyp. Each point represents one sample. *Significantly enriched in cancer.
Fig. 6
Fig. 6
Relationship of relative abundance of Fusobacterium, Gemella, and Parvimonas between fecal samples and biopsies. X‐axis – Relative abundance of taxa in biopsy obtained from 16S ribosomal RNA (rRNA) amplicon sequencing. Y‐axis – Relative abundance of taxa in fecal sample. Blue points represent relative abundance achieved from 16S rRNA amplicon sequencing analysis, and purple points represent relative abundance achieved from quantitative PCR (qPCR). Each point represents one participant. (To represent negative results, a small number (1 × 10−8) was added uniformly to all data points.)

References

    1. Morgan E, Arnold M, Gini A, Lorenzoni V, Cabasag CJ, Laversanne M, et al. Global burden of colorectal cancer in 2020 and 2040: incidence and mortality estimates from GLOBOCAN. Gut. 2023;72(2):338–344. - PubMed
    1. Holme Ø, Løberg M, Kalager M, Bretthauer M, Hernán MA, Aas E, et al. Effect of flexible sigmoidoscopy screening on colorectal cancer incidence and mortality: a randomized clinical trial. JAMA. 2014;312(6):606–615. - PMC - PubMed
    1. Kronborg O, Fenger C, Olsen J, Jørgensen OD, Søndergaard O. Randomised study of screening for colorectal cancer with faecal‐occult‐blood test. Lancet. 1996;348(9040):1467–1471. - PubMed
    1. Ferlizza E, Solmi R, Sgarzi M, Ricciardiello L, Lauriola M. The roadmap of colorectal cancer screening. Cancers (Basel). 2021;13(5):1101. - PMC - PubMed
    1. Bretthauer M, Løberg M, Wieszczy P, Kalager M, Emilsson L, Garborg K, et al. Effect of colonoscopy screening on risks of colorectal cancer and related death. N Engl J Med. 2022;387(17):1547–1556. - PubMed

Substances