. 2024 Aug 22;187(17):4733-4750.e26.
doi: 10.1016/j.cell.2024.06.011. Epub 2024 Jul 5.

Early rhombic lip Protogenin+ve stem cells in a human-specific neurovascular niche initiate and maintain group 3 medulloblastoma

Affiliations

Early rhombic lip Protogenin+ve stem cells in a human-specific neurovascular niche initiate and maintain group 3 medulloblastoma

Abhirami Visvanathan et al. Cell. .

Abstract

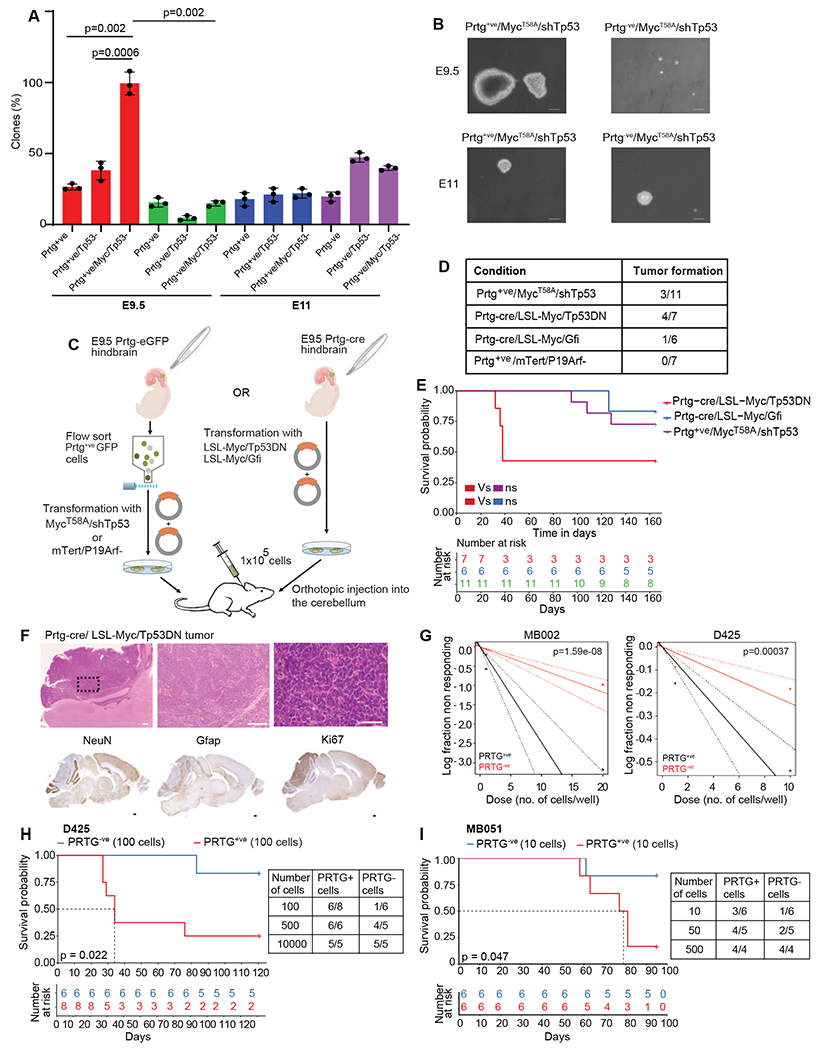
We identify a population of Protogenin-positive (PRTG+ve) MYChigh NESTINlow stem cells in the four-week-old human embryonic hindbrain that subsequently localizes to the ventricular zone of the rhombic lip (RLVZ). Oncogenic transformation of early Prtg+ve rhombic lip stem cells initiates group 3 medulloblastoma (Gr3-MB)-like tumors. PRTG+ve stem cells grow adjacent to a human-specific interposed vascular plexus in the RLVZ, a phenotype that is recapitulated in Gr3-MB but not in other types of medulloblastoma. Co-culture of Gr3-MB with endothelial cells promotes tumor stem cell growth, with the endothelial cells adopting an immature phenotype. Targeting the PRTGhigh compartment of Gr3-MB in vivo using either the diphtheria toxin system or chimeric antigen receptor T cells constitutes effective therapy. Human Gr3-MBs likely arise from early embryonic RLVZ PRTG+ve stem cells inhabiting a specific perivascular niche. Targeting the PRTGhigh compartment and/or the perivascular niche represents an approach to treat children with Gr3-MB.

Keywords: brain development; brain tumor immunotherapy; cancer genomics; group 3 medulloblastoma; perivascular niche; rhombic lip.


Conflict of interest statement

Declaration of interests The authors declare no competing interests. A patent related to this work was submitted by University of Pittsburgh (University Docket No. 05700/F&R ref. 48881-0028P01), US 63/275,326, “Molecules that bind to Protogenin polypeptides.”

Figures

Figure 1.
Figure 1.. Apical Gr3-MB Clusters Transcriptionally Mirror CS12 Homo Sapiens Hind Brain Stem Cells
(A) Uniform manifold approximation and projection (UMAP) visualization of integrated Gr3-MB cells (n=6 tumors) demonstrates nine distinct transcriptional clusters. (B) UMAP visualization of the developing Homo sapiens hindbrain at Carnegie stage 12 (CS12) demonstrating four distinct transcriptional clusters. NSC=neural stem cell. NCC=neural crest cells. (C) CytoTRACE output of CS12 cell clusters demonstrating the extent of cellular differentiation. The NSC cluster consists predominantly of stem-like cells, whereas neural crest cells (NCC) and neuronal progenitor cells are more highly differentiated. (D) Heatmap demonstrating scaled expression of key marker genes across distinct human hindbrain cell types. (E) (i) Graphics illustrating sagittal sections of human hindbrain development at stages CS12, 11PCW and 17PCW. Arrowhead identifies the RL at CS12, which eventually splits into RLVZ and RLSVZ through 11 and 17PCW (yellow and red respectively). (ii) H&E staining of 14PCW developing cerebellum. Boxed inset denotes the nodulus containing the enfolded rhombic lip. (iii) SOX2 expression is high in the RLVZ, (yellow asterisk), but diminished in the RLSVZ (red asterisk). (iv) The human RL is proliferative, particularly the RLSVZ, with extensive Ki67 staining. The RLVZ and RLSVZ are demarcated by a thin GFAP+ve interposed vascular plexus (arrowhead). RLVZ stem cells migrate across the vascular plexus to become RLSVZ progenitor cells. Scale bar= 100 μm, PV= Perivascular niche (F) (i) and (ii) Mid-sagittal sections of the developing human hindbrain at CS19 stained with hematoxylin and eosin (H&E). Arrowheads point to the human rhombic lip (RL). (iii) In Situ hybridization demonstrates high PRTG RNA expression in the CS19 embryonic RL. (iv) and (v) After splitting of the rhombic lip at 17 PCW, PRTG expression is restricted to the RLVZ (yellow asterisk). (vi) MYC expression is restricted to RLVZ region at 17PCW, the same compartment as PRTG+ve and SOX2+ve cells, Scale bar= (i)-1mm, (ii-vi)-100μm (G) Violin plot of cumulative PRTG RNA expression across different cell types of developing human fetal hindbrain from PCW9 to PCW20 demonstrates compartmentalized expression restricted to the RLVZ. Mature cell types (UBCs, GCP, GN) lack PRTG expression. (H) UMAP visualization of predicted cell types with tumor cells as input and CS12 hindbrain cells as reference using CHETAH package. Predicted cell types are colored and over laid on Gr3-MB UMAP embeddings. (I) Comparison of predicted cell type proportions of Gr3-MB and Gr4-MB tumor cells using CS12 human hindbrain cells as reference. (J) Violin plot of PRTG RNA expression levels across human hindbrain cells at CS12. (K) Comparison of PRTG RNA expression across Gr3-MB and Gr4-MB patients shown by violin plot. The highest level of PRTG is detected in Gr3γ, the aggressive and worst prognosis medulloblastoma subtype. (L) Proposed model for the Gr3-MB lineage of origin. PRTG+ve/SOX2+ve/ MYChigh /Nestinlow NSCs give rise to MYClow NCCs and neuronal progenitors during normal hindbrain development. PRTG+ve/SOX2+ve cells with MYC amplification and/or PVT1-MYC translocation are arrested in a stem-like cell state, and form the apex of the Gr3-MB hierarchy. See also figure S1 and S2
Figure 2.
Figure 2.. PRTG+ve Stem Cells Initiate and Sustain Group 3 Medulloblastoma.
(A) Soft-agar sphere formation assay of Prtg+ve versus Prtg−ve controls, sorted from E9 and E11 hindbrain, and transformed by Myc over-expression (by transducing with Myc T58A), or inhibition of Tp53 (by transducing with shTp53), as labelled. The percentage of clones formed after 21 days were plotted. E9 Prtg+ve hindbrain cells with high Myc and Tp53 depletion demonstrated the highest clonality compared to E9 Prtg−ve, or E11 Prtg+ve transformed cells. Data are represented as mean ± SEM, n=3 (B) Representative images of the colonies of various genotypes. (C) Workflow for assessing transformation efficiency of E9.5 Prtg+ve hindbrain cells. Prtg+ve cells were either flow-sorted or isolated from E9.5 hindbrain of PrtgeGFP or Prtgcre mice. Isolated cells were transduced with Gr3-MB versus control oncogenic aberrations as labelled and grafted into the cerebella of NSG mice. (D) Tumor incidence rate observed in mice injected with different combinations of driver genetic events. (E) Kaplan-Meier plot of NSG mice grafted with indicated genotypes. Prtgcre/LSL-Myc/Tp53DN (dominant negative) demonstrate the worst overall survival. (F) H/E staining of mouse brains with tumors generated from E9.5 Prtgcre cells transformed with LSL-Myc/Tp53DN. Tumor histology recapitulates the morphology of large cell/ anaplastic (LCA) medulloblastoma. The tumors are devoid of NeuN and Gfap cells, but highly proliferative. Scale bar=1mm (low), 50μm (high) (G) PRTG positive and negative cells were flow-sorted from Gr3-MB lines MB002 and D425, and limited dilution assays were performed in 96-well plates. The number of wells without spheres were plotted using ELDA. PRTG+ve medulloblastoma cells demonstrate a higher degree of clonogenicity than PRTG−ve controls. (H) D425 cells flow-sorted into PRTG+ve and PRTG−ve fractions were separately xenografted (100 cells) into the cerebellum of NSG mice. PRTG+ve cells show enhanced tumorigenic potential as compared to PRTG−ve cells. Table shows the fraction of mice which formed tumors, by cell count. (I) Intracranial injection of 10 PRTG+ve versus PRTG−ve sorted cells of MB051 (Gr3 PDX line) and the survival plotted by Kaplan-Meier survival plot. PRTG+ve cells demonstrate increased tumorigenesis and reduced survival. Table shows the fraction of mice which formed tumors, by initiating cell count. See also figure S3 and S4
Figure 3.
Figure 3.. Normal and Malignant PRTG+ve RLVZ -like Cells Reside in a Perivascular Niche.
(A) Heatmap of scaled endothelial cluster specific gene signature from scRNA-seq showing differential expression between MB subgroups. CD34 receptor expression is specifically enriched in ECs from Gr3-MB. (B) (i) and (ii) H&E staining of 11PCW cerebellum demonstrating the structural split of the RL, and adjacent 4th ventricle choroid plexus (4V-CP). (iii) PRTG in situ hybridization demonstrates PRTG expression restricted to the RLVZ region (yellow asterisk) at 11PCW. (iv) and (v) Adjacent section showing PRTG+ve cells were juxtaposed to the CD34+ve/GFAP+ve IVP which physically divides RLVZ from the RLSVZ compartment. CD34/GFAP staining shown from CS19 and 11PCW RL. (vi) Enlarged view of perivascular niche shown at 11PCW. Scale bars =(i)- 0.5mm, (ii-v)-100μm (C) Expression of CD34 is restricted to EC cluster of Gr3-MB. Comparative CD34 expression plotted in EC clusters from SHH, Gr3-MB and Gr4-MB scRNA-seq. (D) Spatial expression of Gr3-MB endothelial marker ENG at CS19, 11PCW (RL/CP region) and 18PCW (nodular lobe) detected by ISH. Marker shows positivity in RL vasculature and CP shown by the arrowheads (black- RL, red- CP) while reduced at 18PCW. RNA expression of ENG across different Gr3-MB sc-seq clusters. Predominant ENG expression in Gr3-MB ECs and pericytes, compared to endothelial clusters of SHH, Gr4-MB. Scale bar=200μm (E) Spatial expression of PLVAP at CS19, 11PCW (RL/CP region) and 18PCW (nodular lobe) detected by ISH. Marker shows specific positivity in RL vasculature at CS19, and CP shown by the arrowheads while absent in 18PCW cerebellum (black- RL, red- CP). RNA expression of PLVAP across different Gr3-MB sc-seq clusters. Predominant PLVAP expression in Gr3-MB ECs, compared to endothelial clusters of SHH, Gr4-MB. Scale bar=200μm (F) Cartoon of 17PCW cerebellum with adjacent 4V-CP. Spatial expression of OTX2 at 17PCW detected by ISH showing positivity in CP and adjacent RL region. PRDM6 expression detected by ISH showing partial positivity in CP. Scale bar=500μm (G) Table showing the incidence of PRTG immunopositivity quantified by IHC in surgical biopsies of human WNT, SHH, Gr3-MB, Gr4-MB, ATRT, and ETMR patient tissues. PRTG positive clusters are unique to Gr3-MB. (H) Immunohistochemical staining of human medulloblastoma surgical tissue demonstrates PRTG expression. Large clusters of PRTG+ve cells (shown by arrowheads) reside in the perivascular niche (asterisks) in Gr3-MB. Gr4 MB exhibits rare, solitary PRTG+ve cells, but no perivascular niche. WNT and SHH medulloblastomas are devoid of PRTG+ve cells. (I) Co-staining of PRTG and CD34 (HSC/endothelial marker) in Gr3-MB medulloblastoma patient tissue samples. PRTG+ve cell clusters localize adjacent to the CD34+ve vascular bed. (J) H&E-stained mid-sagittal section of the developing third trimester human cerebellum. Arrowhead points to a persistent rhombic lip (PeRL) present in the nodulus. Higher magnification of the PeRL demonstrates clusters of small blue embryonic cells similar to the RLSVZ nestled as rosettes around a conspicuous vascular structure in the cerebellar nodulus. (K) Leptomeningeal metastatic medulloblastoma cells (GFP+ve) inhabit a neurovascular niche marked by CD34, as demonstrated in the surgically removed leptomeninges from a mouse xenografted with an intracerebellar Med411FH PDX primary tumor. Scale bar- 50μm See also figure S5
Figure 4.
Figure 4.. ECs induce malignant stem-like expression profile in Gr3-MB cells.
(A) Cartoon of experimental design. Gr3-MB cells and ECs were cultured either as an indirect coculture by seeding in two different chambers divided by a cell-impermeable membrane, (0.4μm) or by direct co-culture to facilitate direct EC-MB cell contact. (B) Improved viability of Gr3-MB cells observed in indirect co-culture seeded with HUVEC compared to Gr3-MB cells grown alone as analysed by Alamar blue assay. Viability of control cells was considered as 100%. Viability of the direct cocultured cells with HUVEC as measured by PI staining, followed by flow cytometry. Plot shows the percentage viability in each condition. (C) Gene ontology terms for the genes positively enriched in the differentially regulated transcriptome between Gr3-MB lines grown as indirect co-culture system with ECs compared to control cells (D) Gene ontology terms for the genes negatively enriched in the differentially regulated transcriptome between Gr3-MB lines grown as indirect co-culture system with ECs compared to control cells. (E) Gene ontology terms for the genes positively enriched in the differential transcriptome of PDX cells proximal to vessel endothelium compared to non-interacting cells (F) Gene ontology terms for the genes negatively enriched in the differential transcriptome of PDX cells proximal to vessel endothelium compared to non-interacting cells (G) Enhanced expression of markers for stem-like cells/malignant markers (CD44, SOX2, PRTG) and elevated Ki67high cells detected in MB002 cells seeded as indirect or direct co-culture system. (H) Percentage of positive cells detected for Ki67, SOX2, CD44 and PRTG in Gr3-MB cells grown alone, indirect co-culture with ECs or direct co-culture were plotted. Data are represented as mean ± SEM. n=3 See also figure S5
Figure 5.
Figure 5.. Gr3-MB cells Establish a Symbiotic Niche with Endothelial Cells.
(A) Increased expression of the Gr3-MB endothelial markers; PLVAP, COL4A, CD34 and SPARC detected in HUVEC cells grown as direct coculture with MB002 cells after 72 hrs. (B) Percentage of positive cells detected for SPARC, COL4A, PLVAP and CD34 were elevated in the ECs grown as direct co-culture with MB cells compared to ECs alone. Data are represented as mean ± SEM. n=3 (C) High COL4A1 expressing cells are detected in the tumor-microenvironment around EGFP expressing tumor cells (Med411FH PDX tissue). Scale bar= 10μm (D) Lack of expression of COL4A in the non-tumor bearing cerebellar hemisphere (Granular Layer) in the same animal (negative control) Scale bar= 10μm (E) High ENG expressing cells are detected in the tumor-microenvironment cells around EGFP expressing tumor cells (Med411FH PDX tissue). Scale bar= 10μm (F) Lack of expression of ENG in the non-tumor bearing cerebellar hemisphere (Granular Layer) in the same animal (negative control) Scale bar= 10μm (G) Human RLvz sub-structure is proximal to 4V-CP shown at 17PCW facilitating inter-compartment communication. MB cells were cocultured with E16.5 4V-CP ECs in a trans-well chamber with a 0.4μm filter to facilitate paracrine cell-cell signalling. (H) MB cells cocultured with E16.5 4V-CP ECs in the lower chamber demonstrate increased positive expression of CD44, Vimentin and SOX2 compared to control MB cells. (I) Equal numbers of Med211FH control cells, or Med211FH cells that were cocultured with E16.5 4V-CP ECs in the insert were orthotopically implanted into NSG mice. Mice injected with from indirect co-culture show poor survival compared to control cells. See also figure S5
Figure 6.
Figure 6.. Ablation of PRTG+ve Compartment Reduces Viability of Gr3-MB.
(A) Workflow for PRTGhigh compartment depletion using the Diptheria Toxin Receptor (DTR) system. DTR was cloned downstream of the PRTG promoter (1.5kb) and transduced into the patient derived Gr3-MB line Med411FH. Post orthotopic implantation, mice were treated with intraperitoneal Diphtheria toxin thrice a week for 3 weeks. (B) Reduced tumor growth in treated Med411FH PRTG-DTR mice versus untreated controls as demonstrated by bioluminescence imaging (BLI). (C) Kaplan-Meier survival plot showing depletion of the PRTG+ve cells in Med411FH PRTG-DTR tumors by DT treatment improves survival. P value was analyzed by two-sided log-rank test. (D) Kaplan-Meier survival plot of untreated and Diptheria toxin (DT) treated mice carrying D341 DTR xenograft tumors. PRTG compartment ablation prolongs survival. (E) Med411FH-DTR xenografts treated with diphtheria toxin versus untreated Med411FH-DTR controls were stained for PRTG expression. DT treatment successfully depleted the PRTG+ve compartment in treated animals. Data are represented as mean ± SEM. (F) (i) Cartoon depicting the domains of the transmembrane PRTG protein. The extracellular domain includes Ig-like (Ig I-IV) and fibronectin domains (Fib I-V). Stars indicate glycosylation sites, while disulfide bridges are depicted by links. The target site for the anti-PRTG mAb is indicated. (ii) Incubation of Gr3-MB cells with control IgG or anti-PRTG mAb for 7 days reduced the viability of anti-PRTG treated cells as measured by Alamar blue dye. (G) Viability of shNT and shPRTG MB002 cells was assessed after treating with IgG or anti-PRTG mAb (10μg/ml). shPRTG cells fail to respond to mAb treatment. Viability was measured by Alamar Blue dye and shNT condition was considered as 100%. n=3 (H) Experimental plan for in vivo anti-PRTG mAb treatment. Gr3-MB lines were grafted subcutaneously (s.c) into NSG mice, which were treated with anti-PRTG mAb (100μg) by intra-tumoral injection 3 times a week after palpable flank tumor formation. (I) Representative BLI images of the D425 flank tumors showing reduced tumor progression after Anti-PRTG mAb therapy as compared to IgG treated controls. (J) Total luciferase flux quantification over time of IgG versus anti-PRTG treated tumors demonstrates the survival advantage of anti-PRTG mAb treatment. Data are represented as mean ± SEM. n=4 (K) Anti-PRTG mAb treated MB002 flank tumors show reduced volume compared to control animals treated with IgG. Data are represented as mean ± SEM, n=4
Figure 7.
Figure 7.. Targeted Depletion of the PRTG+ve Compartment by CAR T-cells Impairs Medulloblastoma.
(A) Overview of the phage panning approach to select human antibody heavy chain VH binders for PRTG. The PRTG domains were expressed in Expi293 cells and biotin labeled. Four rounds of panning were performed to enrich anti-PRTG specific colonies. After characterization, the best binders were chosen for CAR T-cell development. (B) Cartoon depicting the target binding sites for CAR T-cells (D3-9, D5-53, 55, 69) at PRTG are illustrated by red bars. (C) Binder detection efficiency was analyzed by flow cytometry. Binding intensities of D3-9, D5-53, D5-55 and D5-69 were compared between 293T cells over expressing PRTG and control cells. (D) The cytotoxicity of anti-PRTG CAR T-cells against 293T and 293T-PRTG cells. As a negative control, anti-PRTG CAR T-cells (VH55, VH69, LD3-9, LD5-53) were co-cultured with 293T cells. Anti-PRTG CAR T-cells were co-cultured with 293T-PRTG for 48 hours. Supernatant LDH was used to detect cytotoxicity. Cytotoxicity (%) was calculated at effector: target ratios of 1.25:1, 2.5:1, 5:1, 10:1 and 20:1 and compared with the Pan T group. Data are represented as mean ± SEM, n=3 (E) The inhibition (killing) of D425 cells by anti-PRTG CAR T-cells. Anti-PRTG CAR-T cells (effector cells) were co-cultured with D425 (target cells) at 10:1. D425 cells were stained with trypan blue. Live cells in anti-PRTG CAR T-cell groups were compared to control Pan T-cells. Data are represented as mean ± SEM, n=3 (F) MB and HEK293T cell lines were co-cultured with Pan T or PRTG CAR T (LD5-55) cells. Supernatants were analyzed for IFN-gamma secretion by Enzyme-Linked Immunosorbent Assay. Cytokine release was confirmed in LD5-55 treated MB cell condition at E:T=10 (G) Experimental plan. Gr3-MB cells were xenografted into the cerebellum of NSG mice. Once the tumor formation was confirmed by BLI, anti-PRTG CAR T- cells (LD5-55), or non-transduced Pan T-cells were delivered by lateral ventricle injection. Tumor progression was monitored by BLI. (H) Representative images from the BLI of Pan T or anti-PRTG CAR T (LD5-55) injected mice carrying Med411FH xenografts showing the reduction in tumor growth in mice treated with anti-PRTG CAR T-cell treatment. (I) and (J) Kaplan-Meier plot showing prolonged survival of anti-PRTG CAR T-cell treated Med411FH and Med211FH xenograft mice. P value calculated by log rank. Xenografts were treated with anti-PRTG CAR T (LD5-55 clone) by intraventricular injections. See also figure S6 and S7

References

    1. Northcott PA, Shih DJH, Peacock J, Garzia L, Sorana Morrissy A, Zichner T, Stütz AM, Korshunov A, Reimand J, Schumacher SE, et al. (2012). Subgroup-specific structural variation across 1,000 medulloblastoma genomes. Nature 488, 49–56. 10.1038/nature11327. - DOI - PMC - PubMed
    1. Cavalli FMG, Remke M, Rampasek L, Peacock J, Shih DJH, Luu B, Garzia L, Torchia J, Nor C, Morrissy AS, et al. (2017). Intertumoral Heterogeneity within Medulloblastoma Subgroups. Cancer Cell 31, 737–754.e6. 10.1016/j.ccell.2017.05.005. - DOI - PMC - PubMed
    1. Haldipur P, Aldinger KA, Bernardo S, Deng M, Timms AE, Overman LM, Winter C, Lisgo SN, Razavi, Silvestri E, et al. (2019). Spatiotemporal expansion of primary progenitor zones in the developing human cerebellum. Science (1979) 366, 454–460. 10.1126/science.aax7526. - DOI - PMC - PubMed
    1. Aldinger KA, Thomson Z, Phelps IG, Haldipur P, Deng M, Timms AE, Hirano M, Santpere G, Roco C, Rosenberg AB, et al. (2021). Spatial and cell type transcriptional landscape of human cerebellar development. Nat Neurosci 24, 1163–1175. 10.1038/s41593-021-00872-y. - DOI - PMC - PubMed
    1. Wong YH, Lu AC, Wang YC, Cheng HC, Chang C, Chen PH, Yu JY, and Fann MJ (2010). Protogenin defines a transition stage during embryonic neurogenesis and prevents precocious neuronal differentiation. Journal of Neuroscience 30, 4428–4439. 10.1523/JNEUROSCI.0473-10.2010. - DOI - PMC - PubMed

Supplementary concepts