. 2024:700:413-454.
doi: 10.1016/bs.mie.2024.02.010. Epub 2024 Mar 22.

A live cell imaging-based assay for tracking particle uptake by clathrin-mediated endocytosis

Affiliations

A live cell imaging-based assay for tracking particle uptake by clathrin-mediated endocytosis

Grant Ashby et al. Methods Enzymol. 2024.

Abstract

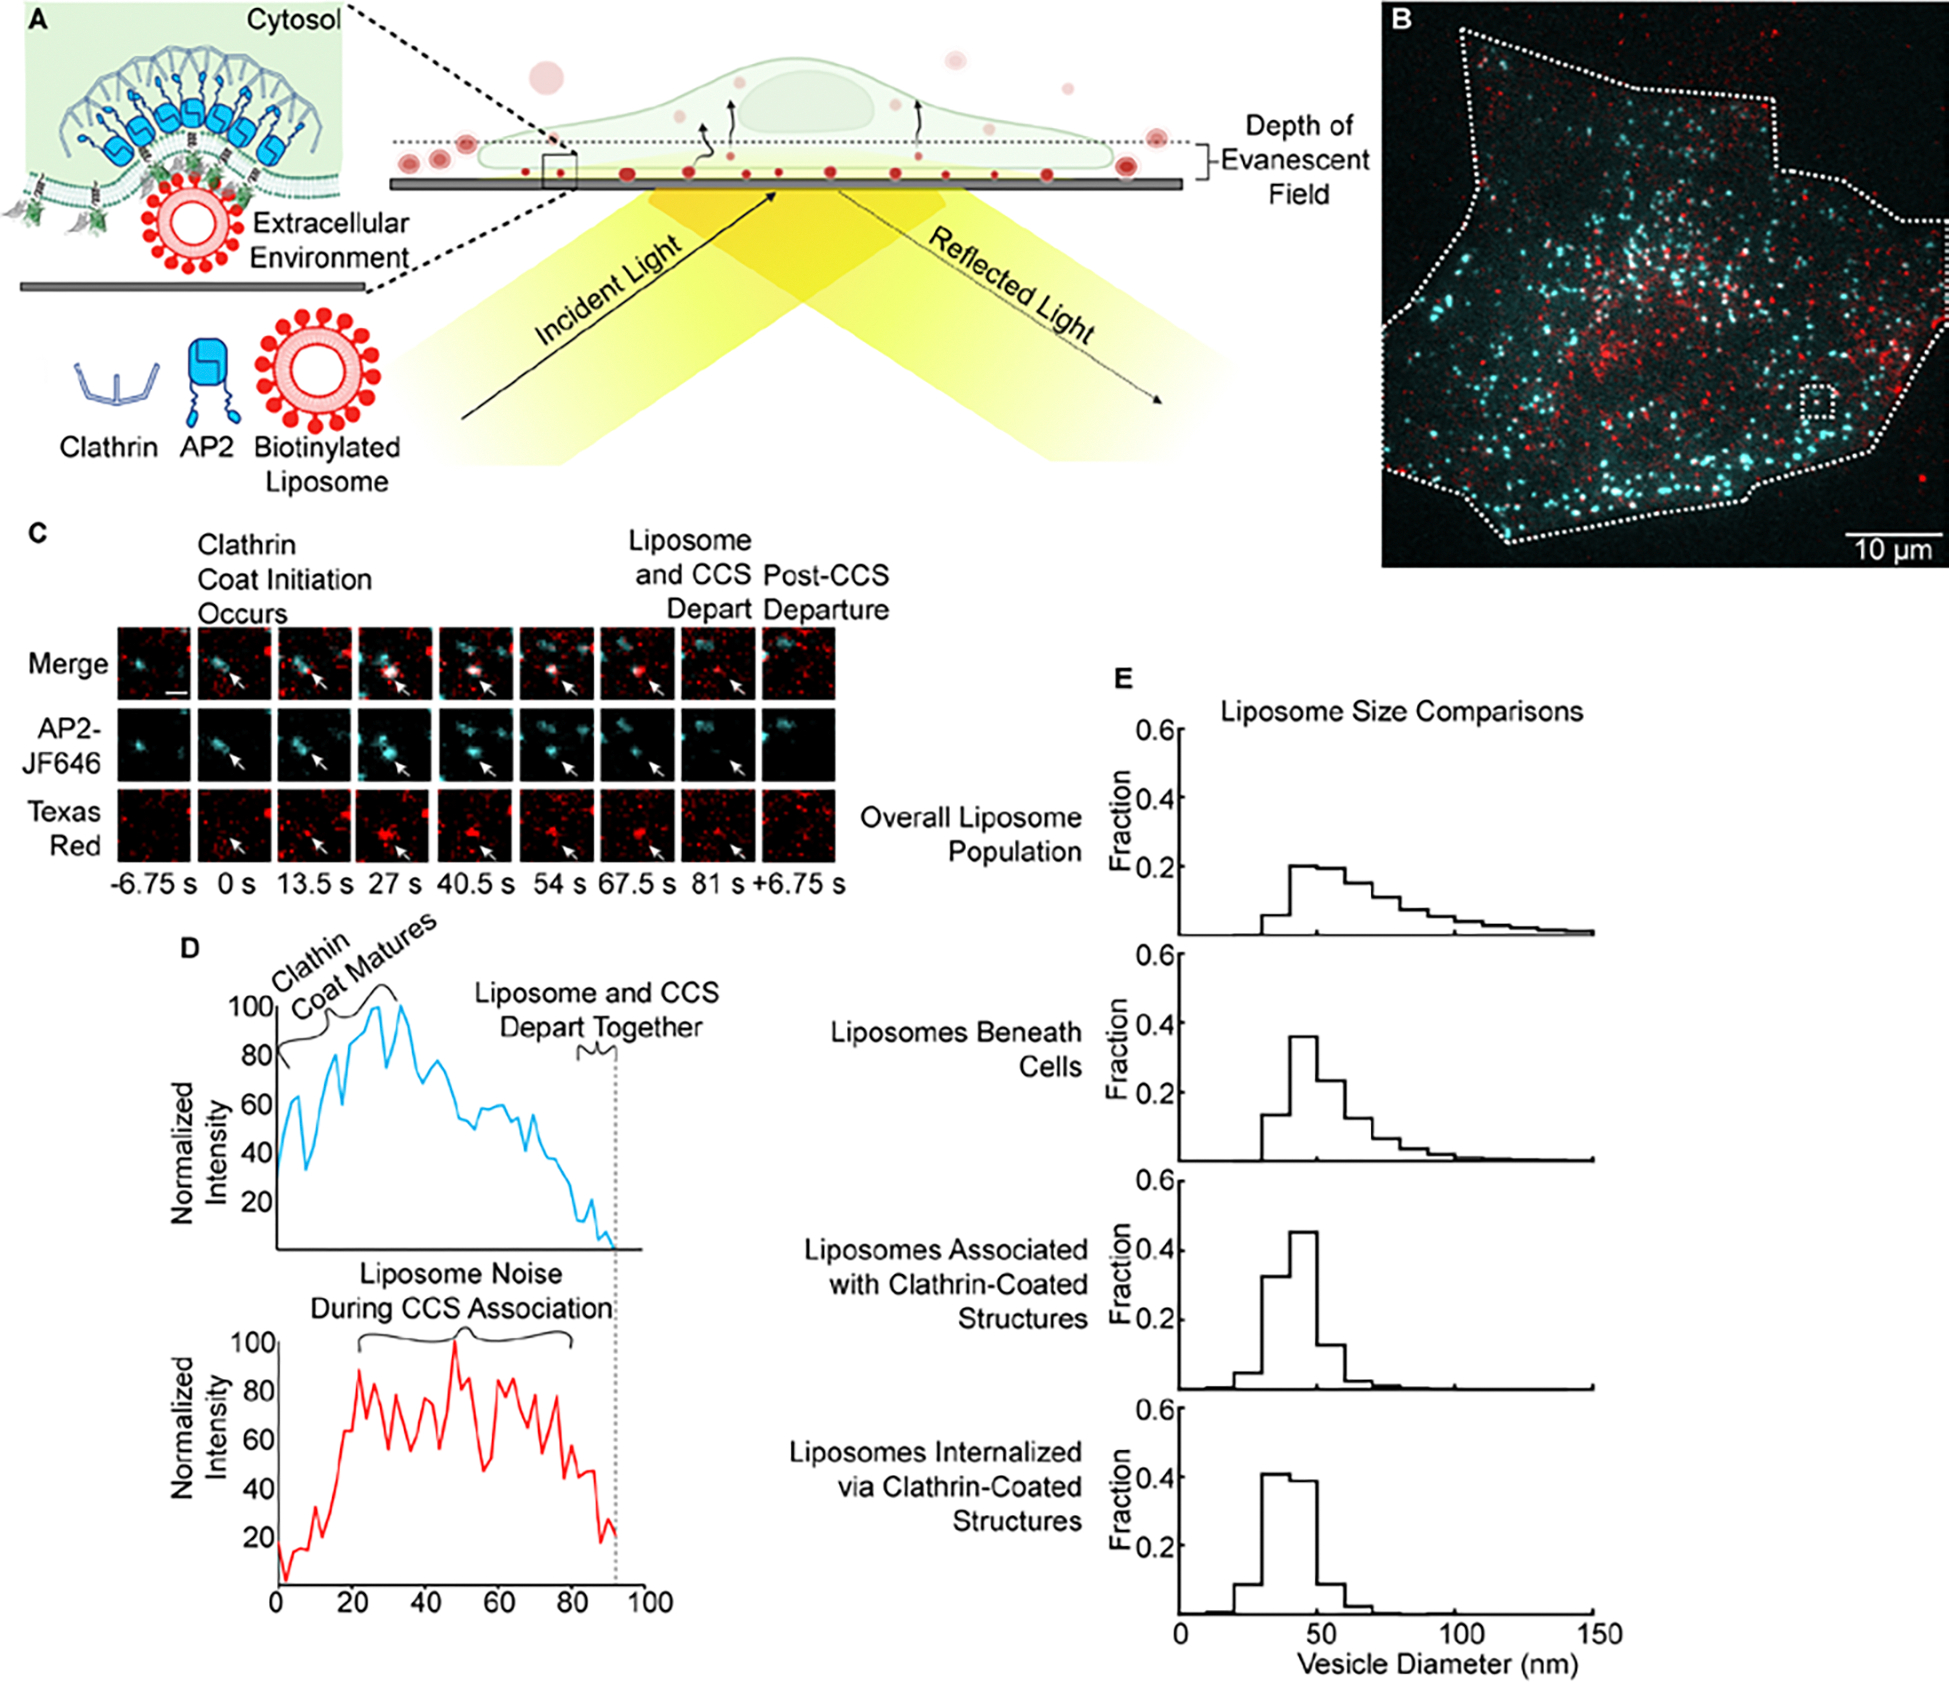
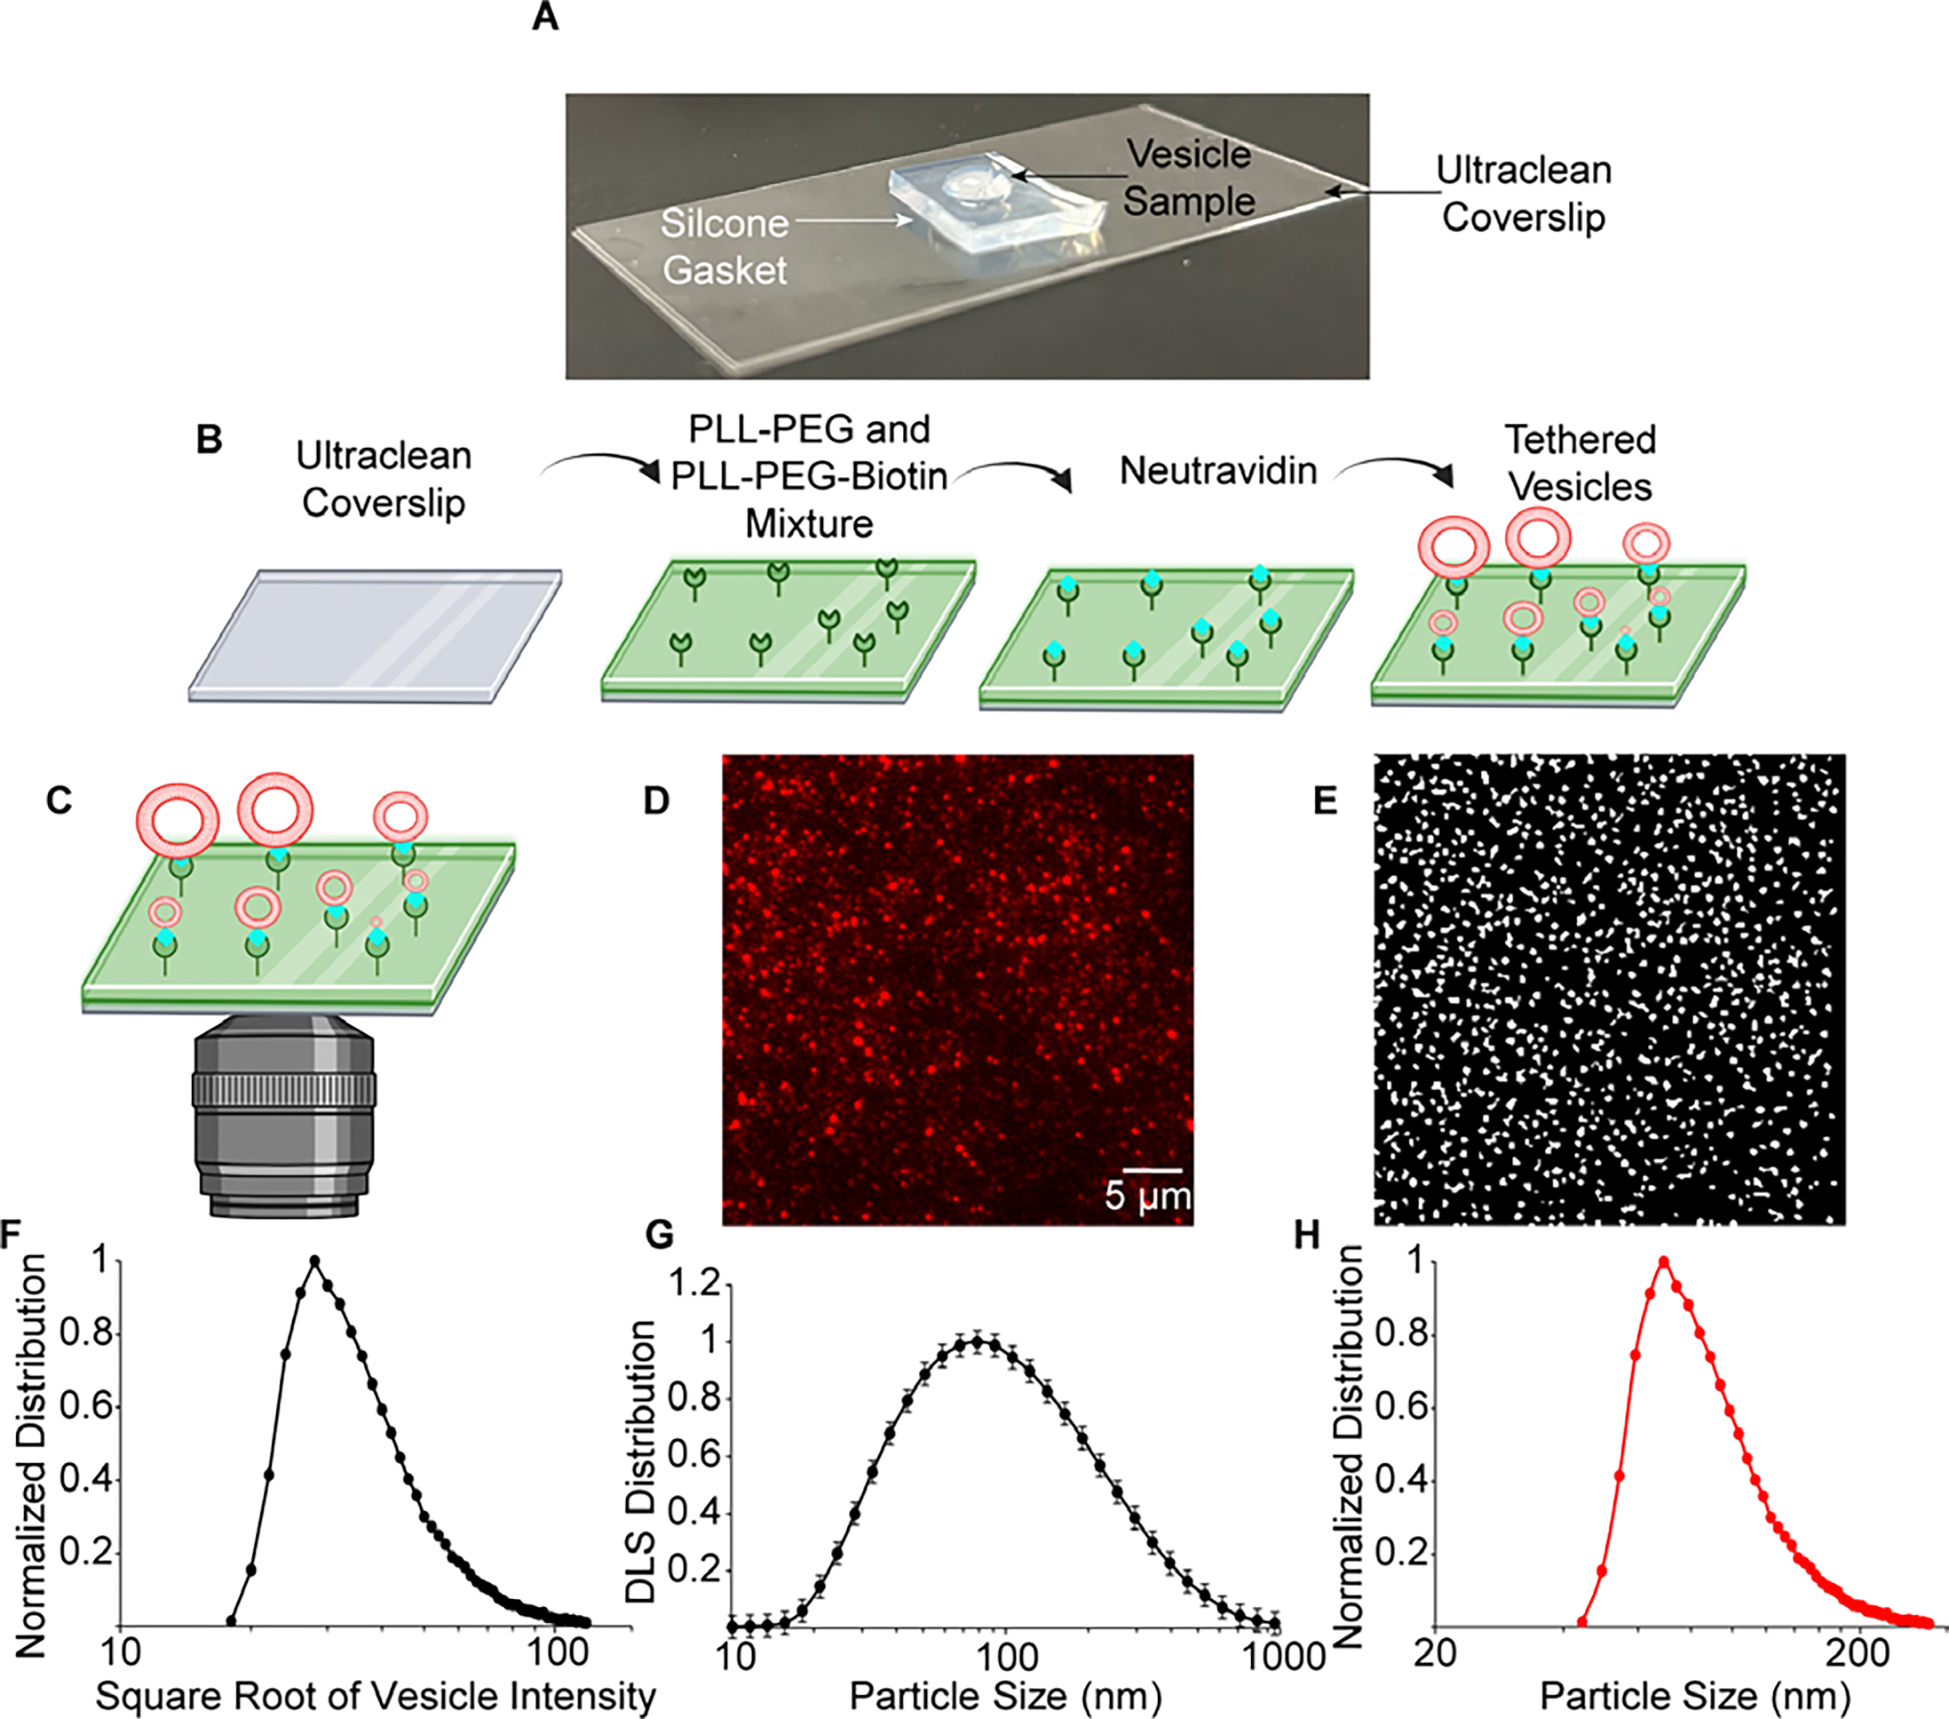
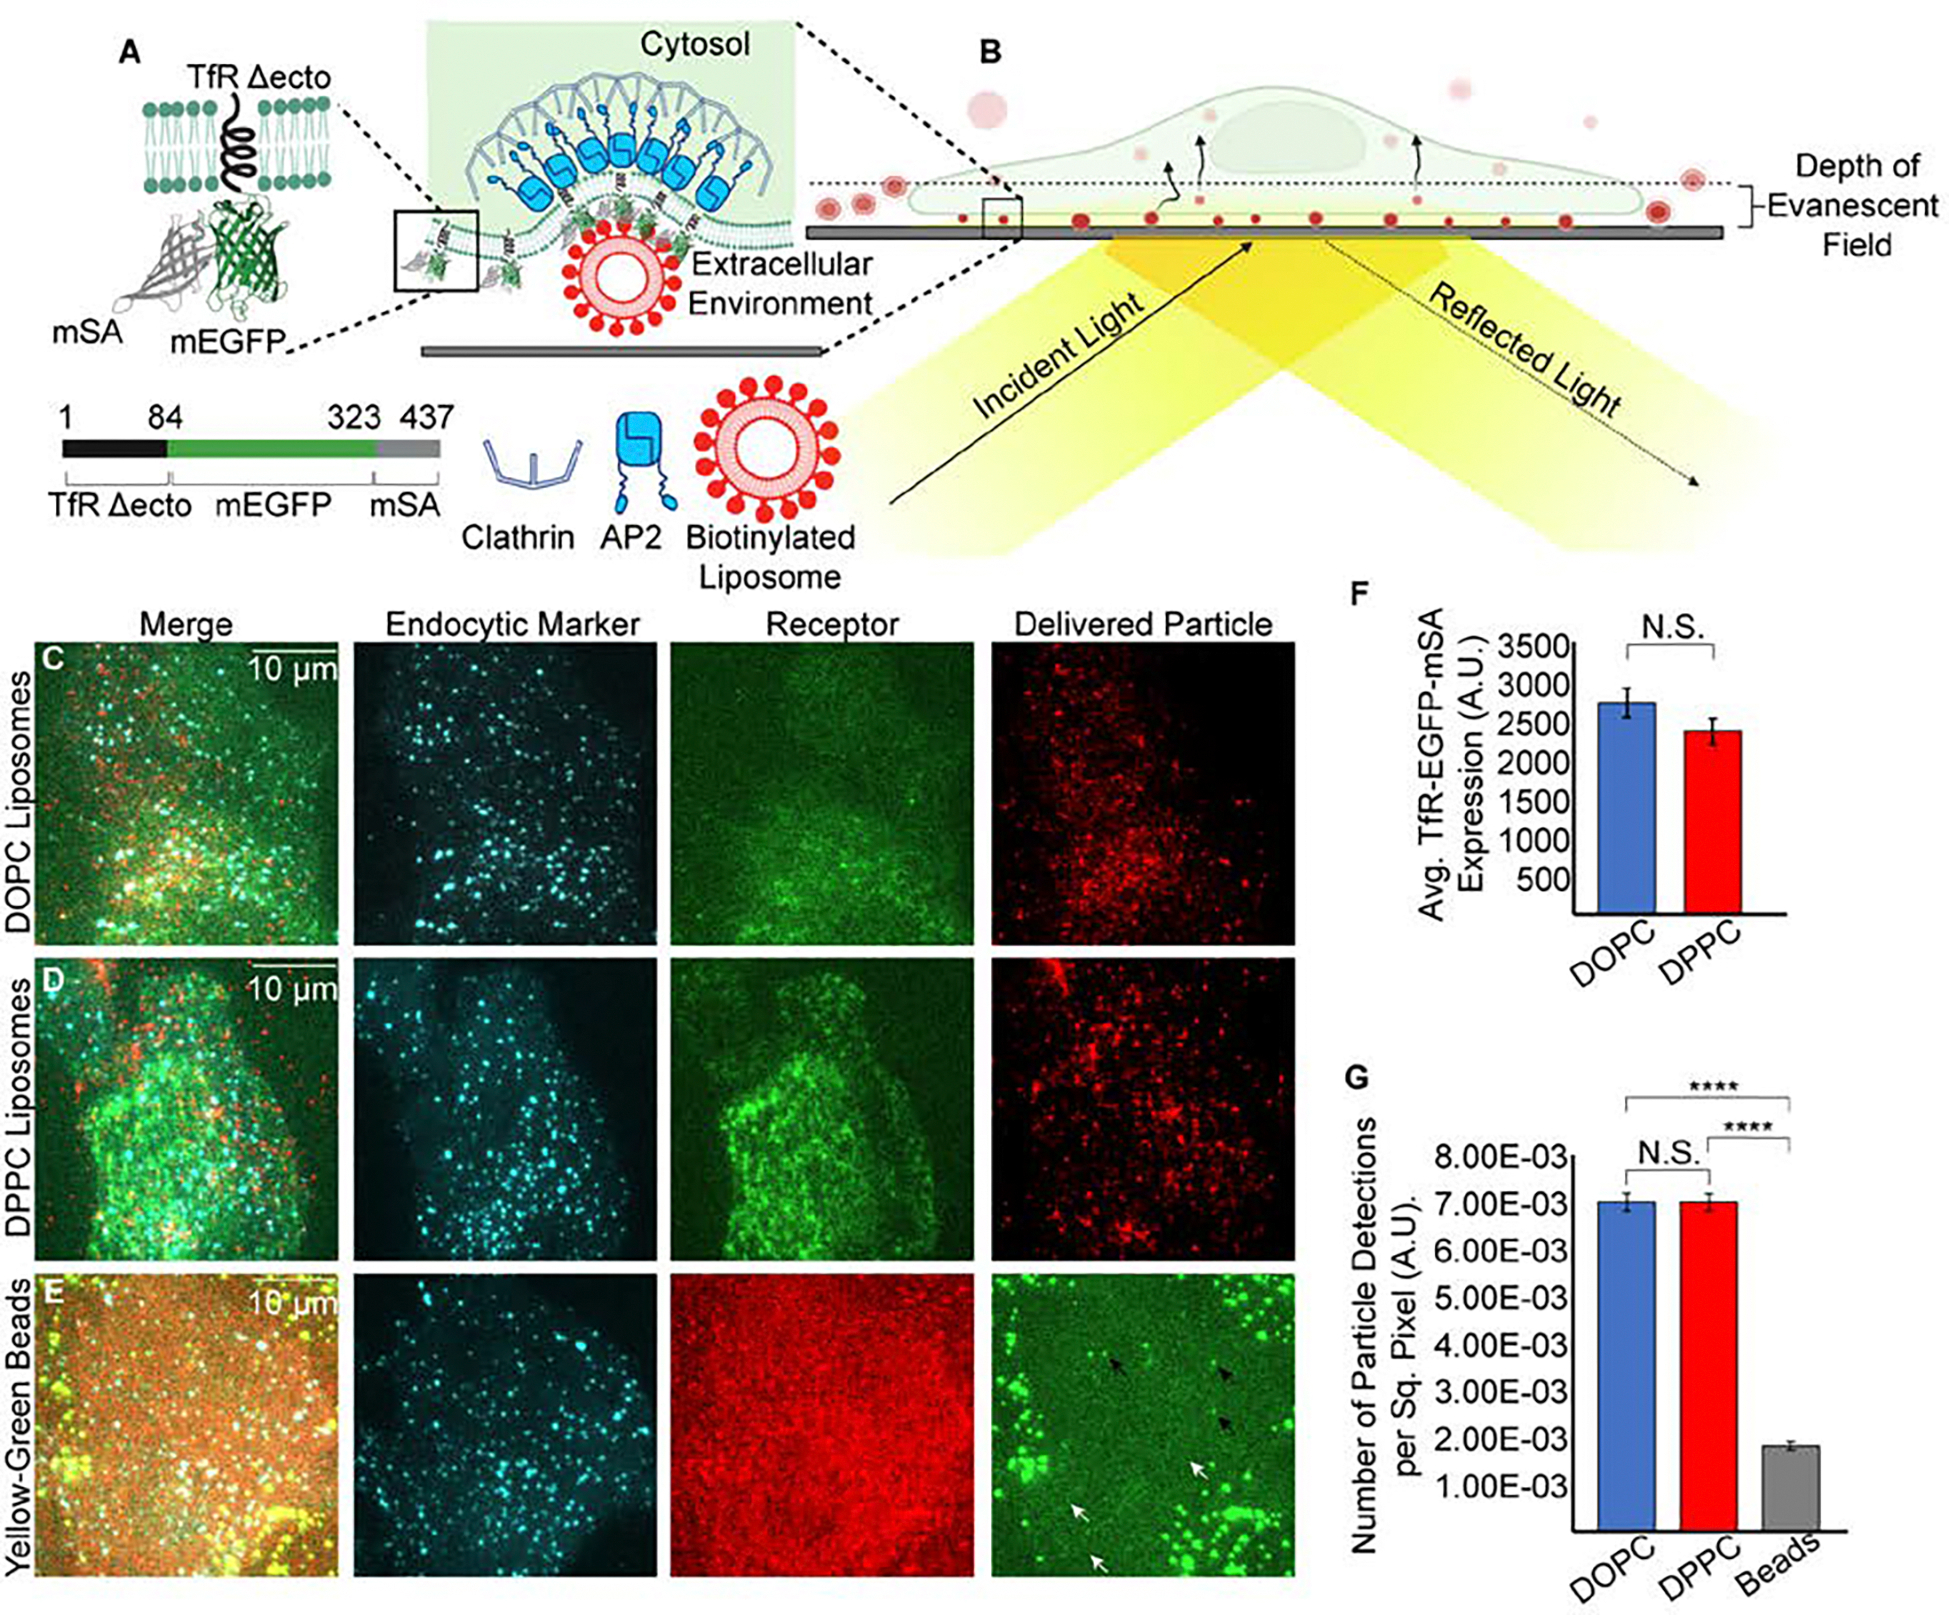
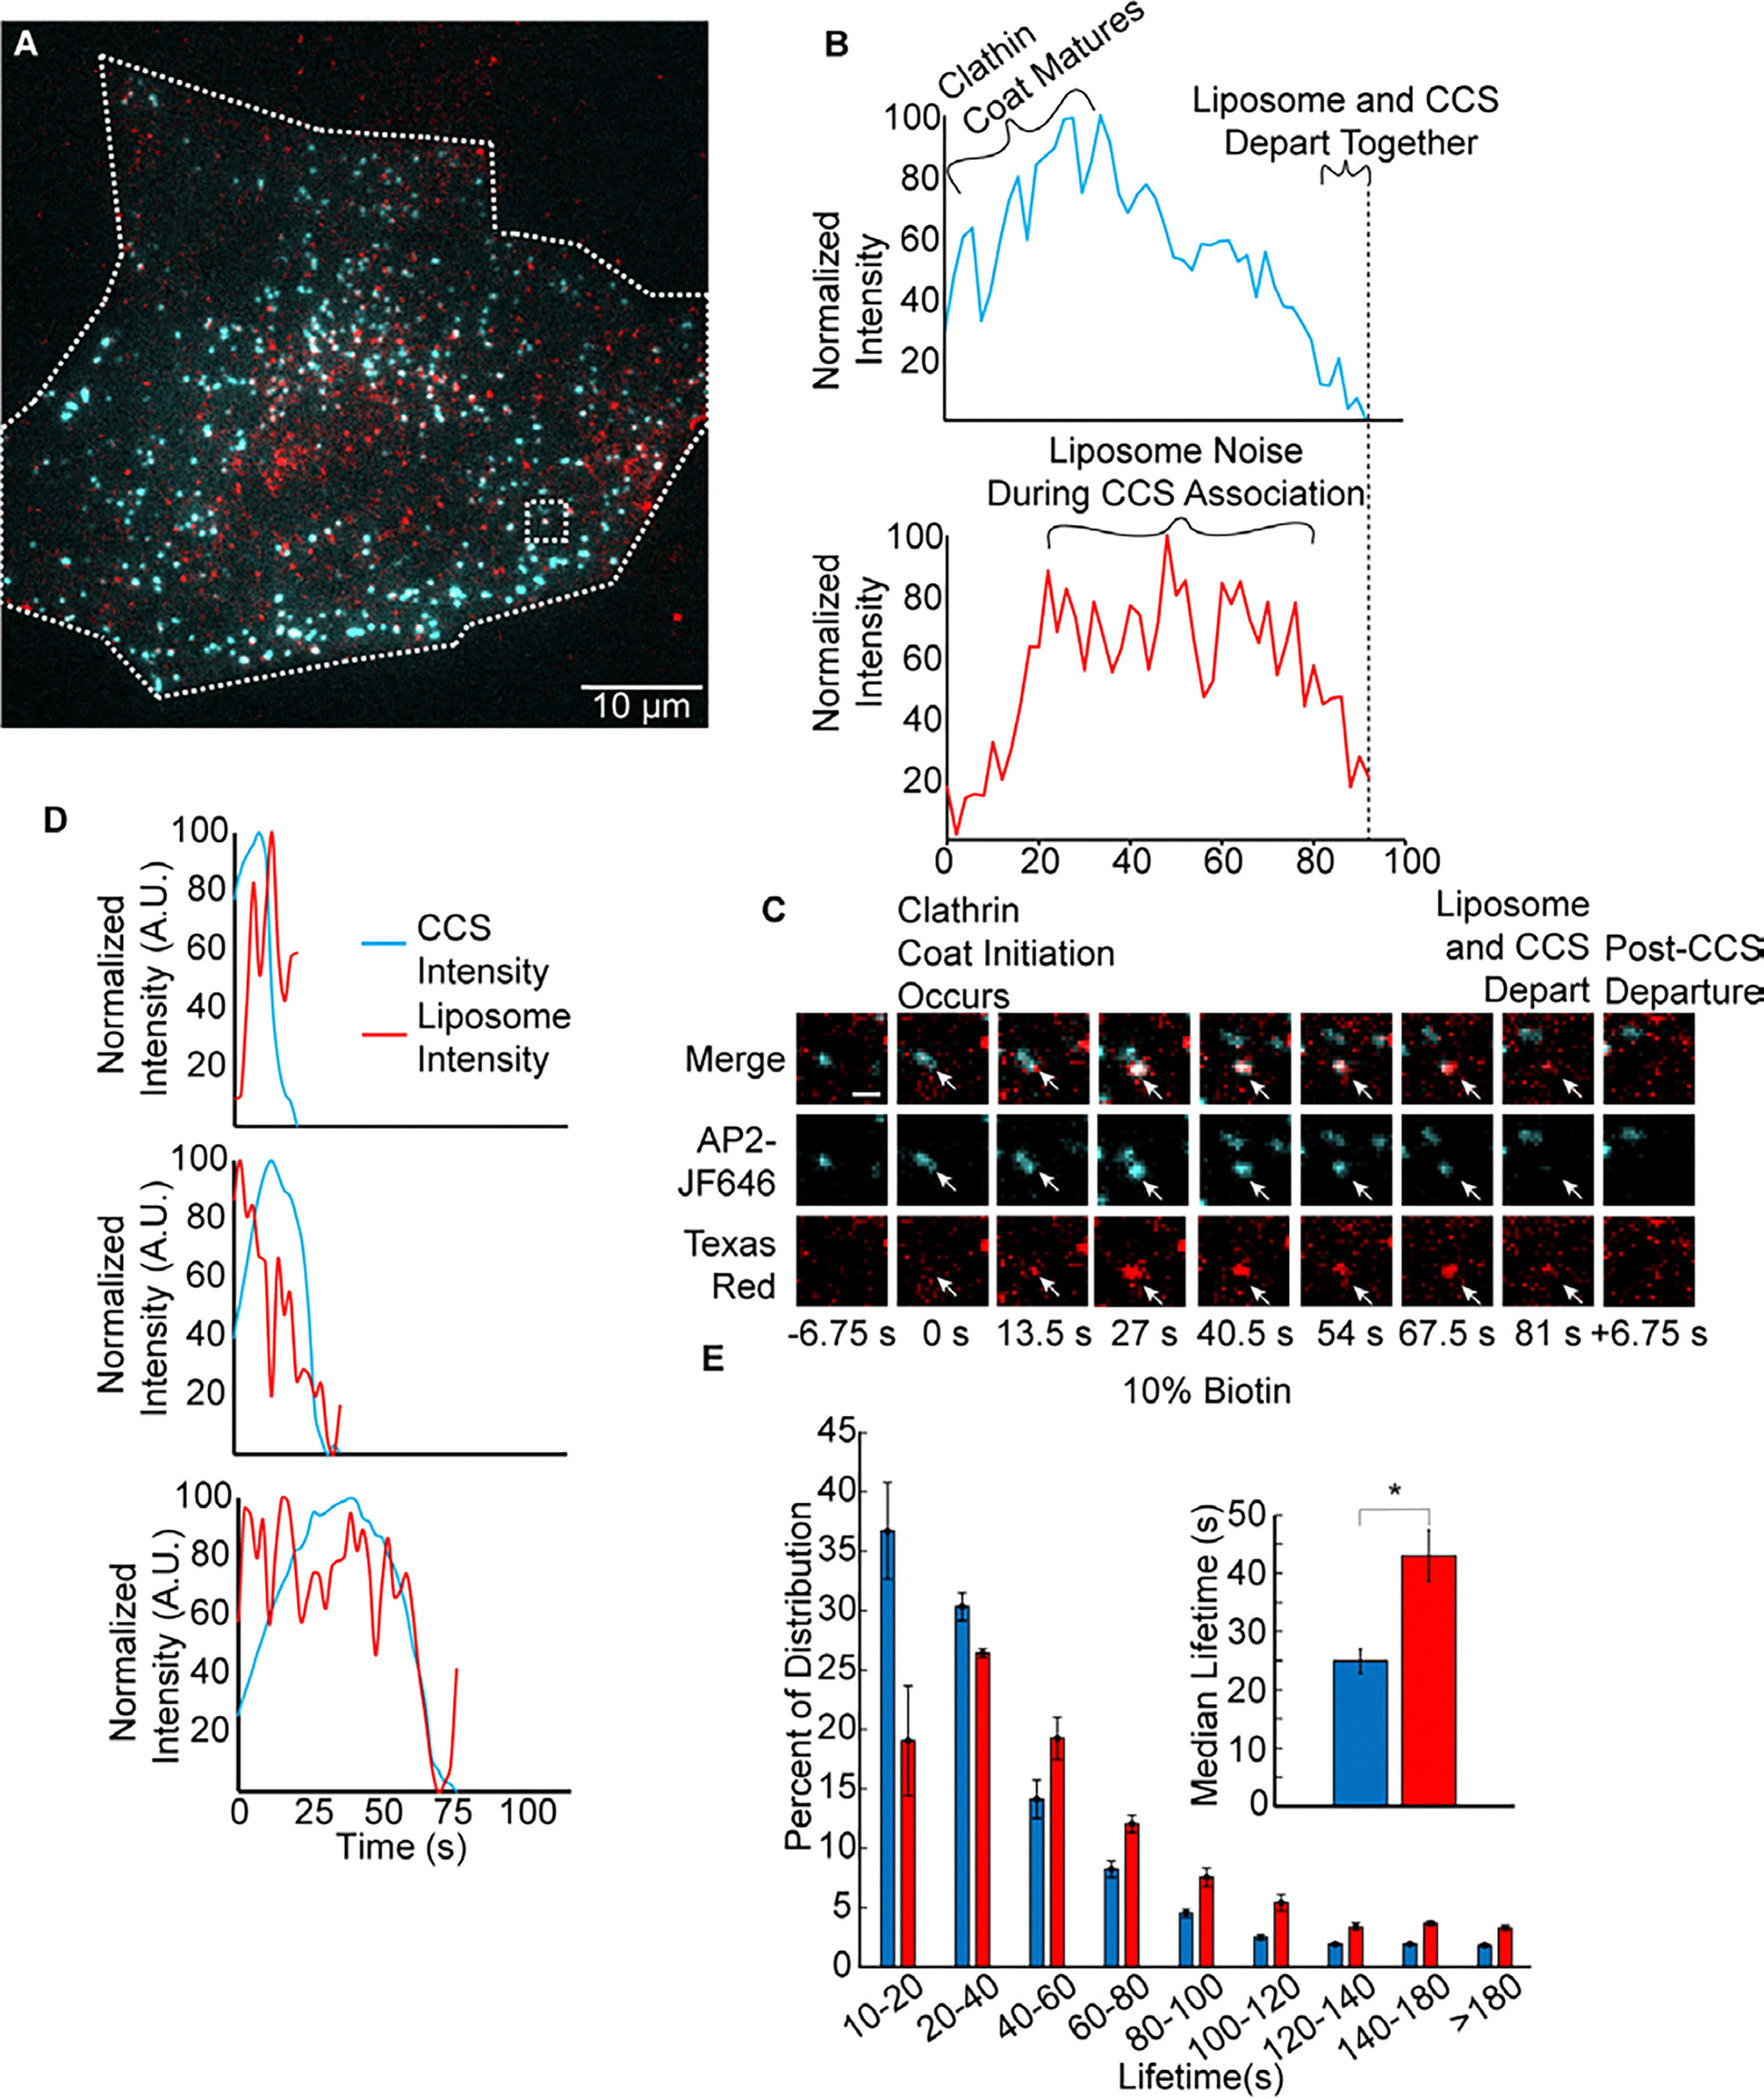
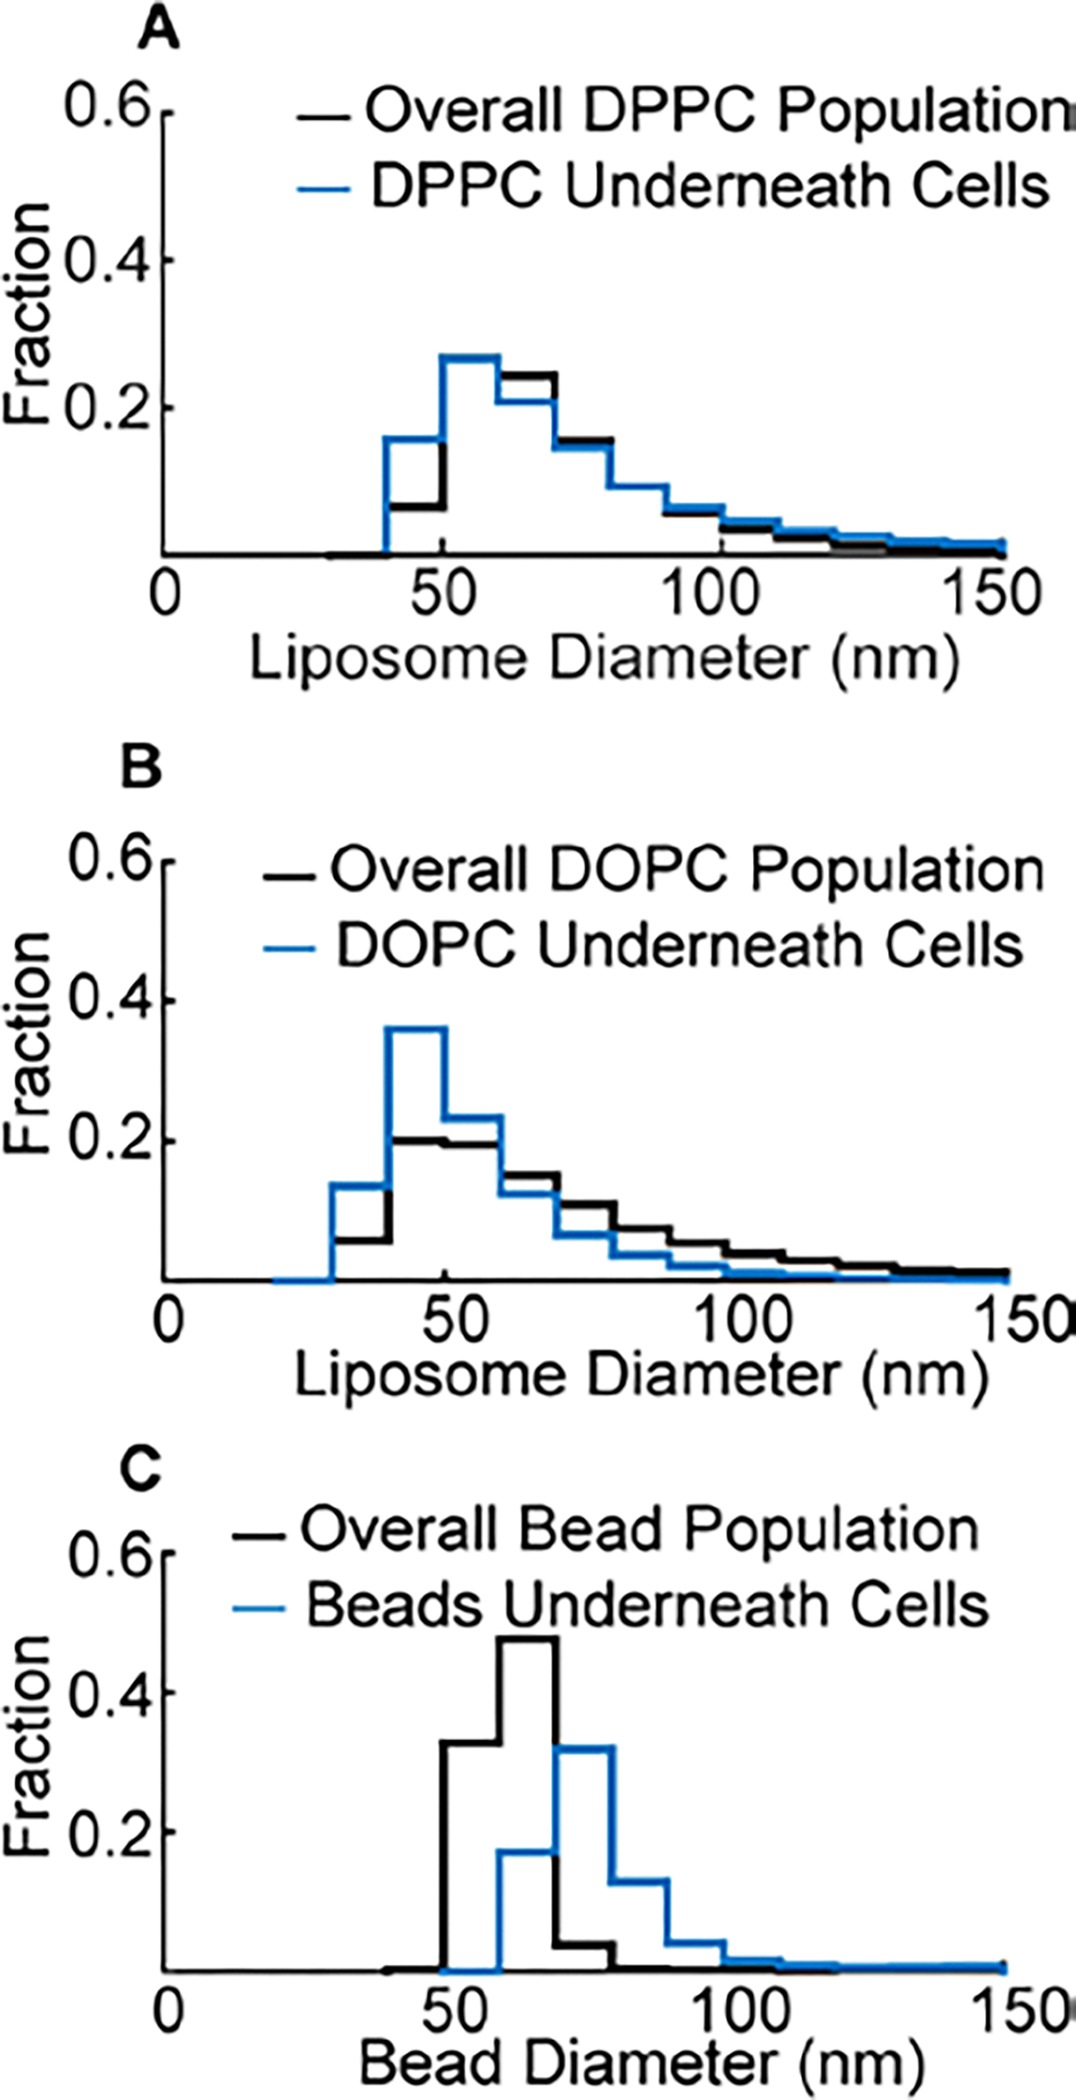
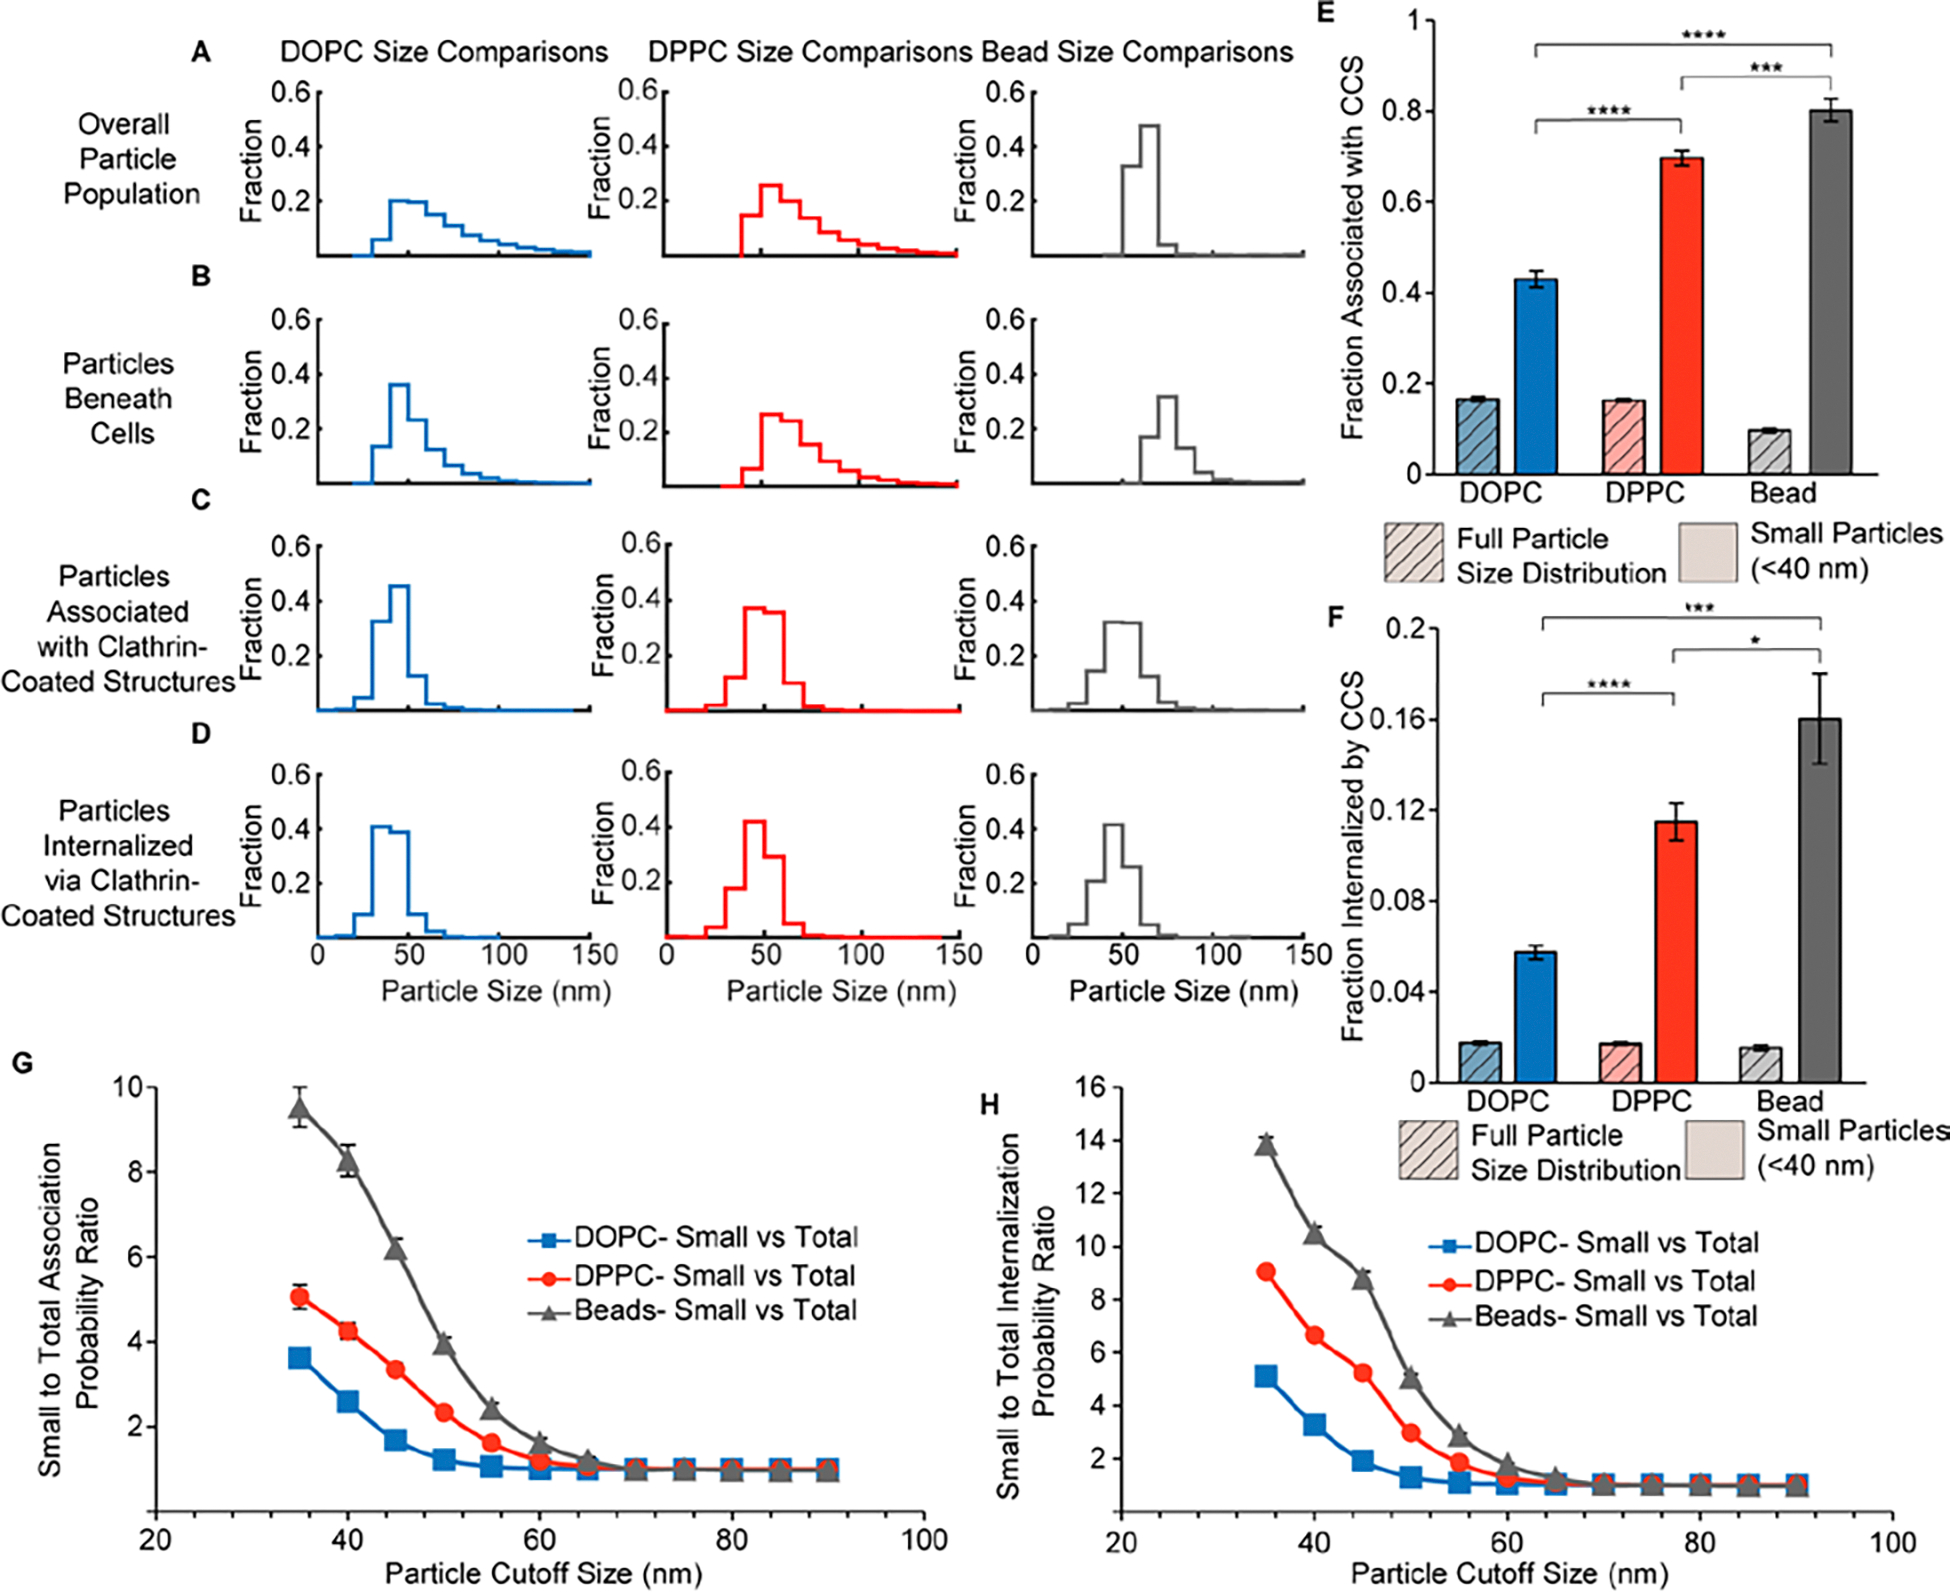
A popular strategy for therapeutic delivery to cells and tissues is to encapsulate therapeutics inside particles that cells internalize via endocytosis. The efficacy of particle uptake by endocytosis is often studied in bulk using flow cytometry and Western blot analysis and confirmed using confocal microscopy. However, these techniques do not reveal the detailed dynamics of particle internalization and how the inherent heterogeneity of many types of particles may impact their endocytic uptake. Toward addressing these gaps, here we present a live-cell imaging-based method that utilizes total internal reflection fluorescence microscopy to track the uptake of a large ensemble of individual particles in parallel, as they interact with the cellular endocytic machinery. To analyze the resulting data, we employ an open-source tracking algorithm in combination with custom data filters. This analysis reveals the dynamic interactions between particles and endocytic structures, which determine the probability of particle uptake. In particular, our approach can be used to examine how variations in the physical properties of particles (size, targeting, rigidity), as well as heterogeneity within the particle population, impact endocytic uptake. These data impact the design of particles toward more selective and efficient delivery of therapeutics to cells.

Keywords: Clathrin-mediated endocytosis; Colocalization; Drug-carrier internalization; Drug-carrier properties; Endocytosis; Particle tracking; Small unilamellar vesicle.


Figures

Figure 1.
Figure 1.. Overall workflow for how individual particles can be judged for internalization and averaged to inform on optimal particle properties for uptake.
A. A schematic of the basolateral membrane of a cell expressing a target receptor can be analyzed via TIRF microscopy. (Created with BioRender) B. An example image of a SUM159-AP2-σ-Halotag cell in the presence of model drug-carriers beneath the basolateral membrane. The endocytic marker, AP2, is shown in cyan, and the model drug-carrier, is shown in red. The periphery of the cell is highlighted by the dashed line, and the dashed inset shows a model colocalization event. C. A montage of the growing endocytic site shown in the dashed box in Figure 1B as it interacts with a model drug-carrier through time. The scale bar is 1 μm. D. The tracked intensity of the growing endocytic site shown in Figure 1C, as it matures and departs from the cellular membrane with the simultaneous decrease in fluorescent intensity indicating successful drug-carrier internalization. E. Normalized histograms of the drug-carrier sizes that were made (47,502 events), penetrated beneath cells (26,537 events), associated with endocytic machinery (15,152 events), and were successfully internalized (1,797 events). Histograms were populated across 3 trials with at least 12 cells analyzed per trial for a total of 84 cells exposed to DOPC liposomes containing 10% biotinylated lipids.
Figure 2.
Figure 2.. Tethered vesicle assay to enable the conversion of particle fluorescence intensity to diameter.
A) Snapshot of the experimental set-up of an imaging well on an ultraclean coverslip that is housed by a cleaned silicone gasket. B) Schematic of the experimental set-up of how to apply reagents to an ultraclean coverslip to allow for tethering of biotinylated liposomes. (Created with BioRender) C) Schematic of the final imaging condition to be acquired under the same imaging parameters that were utilized in cellular delivery. (Created with BioRender) D) Representative raw image of tethered DOPC tethered vesicles. E) Representative mask of the image in part D from the automated analysis protocol, CME Analysis, to provide the intensity distribution of vesicles present. F) Histogram counts of the square root of vesicle intensities from data like D and E. G) Representative dynamic light-scattering distribution to provide the range of vesicle diameter created during probe sonication averaged over 3 independent trials. H) Converted vesicle diameter utilizing a conversion factor to relate the vesicle intensities to vesicle diameters shown in F and G.
Figure 3.
Figure 3.
Schematic of cell-mounting slide formation with double-sided tape, coverslip, and valap for sealing. (Created with BioRender)
Figure 4.
Figure 4.. Engineered target receptors facilitate drug-carrier penetration beneath the basolateral membrane.
A) An engineered model receptor containing a transferrin cytosolic and transmembrane domain conjugated to a monomeric EGFP and monomeric streptavidin to enable targeting of biotinylated lipids. (Created with BioRender) B) Schematic of imaging of delivered model drug carriers using TIRF microscopy. C-E) Representative images of multiple particle populations delivered to SUM159 cells containing AP2 (cyan) (C-E), a TfR-mEGFP-mSA (C-D), delivered liposomes containing DOPC or DPPC, C and D respectively, Yellow-Green biotinylated beads (E), and a TfR-mRFP-mSA engineered target receptor (E). The black arrows point to aggregated bead complexes and the white arrows point towards small individual beads. F) Membrane expression level of the TfR-mEGFP-mSA target receptor in the presence of DOPC and DPPC liposomes. Significance between groups was determined using a student’s t-test (DOPC vs DPPC- p = 0.150). The receptor expression for bead delivery was omitted here owing to the different fluorophore utilized where direct comparisons could not be made. G) Normalized number of particle detections beneath cells for the DOPC liposome, DPPC, liposome and Biotinylated Yellow-Green bead populations. Significance between groups was determined using a student’s t-test (DOPC vs DPPC- p = 0.976; DOPC vs Bead- p < 10−5; DPPC vs Bead- p < 10−5) Data for F and G were acquired over at least 3 independent trials with at least 12 cells analyzed per trial culminating with N= 84, 109, and 110 cells for the DOPC, DPPC, and Yellow-Bead delivery conditions respectively.
Figure 5.
Figure 5.. Tracking the endocytic machinery enables the observation of overall particle effects on the dynamics of endocytosis.
A) Representative image of a SUM159 cell exposed to DOPC liposomes containing 10% biotinylated lipids. Adaptor protein 2 (cyan) is represented at the cytosolic leaflet of the plasma membrane, and liposomes are free to diffuse between the basolateral membrane and the coverslip. Colocalization (appears as white) between the 2 channels over statistically significant time scales denotes colocalization that can be analyzed. The periphery of the cell is highlighted with the dashed white line, and the dashed box represents a representative colocalization event. B) Representative intensity profile of the growing clathrin-coat and its colocalization with the liposome that is shown in the dashed white box in A. C) Montage of the growing endocytic site shown in the dashed box in A and the intensity profile in B that show the simultaneous departure of a liposome and clathrin-coat indicating successful internalization. The scale bar is 1 μm. D) Representative time cohorts for the DOPC liposome delivery group that show over long-time scales there is good agreement for the simultaneous intensity decrease of the liposome intensities and the clathrin-coats averaged into cohorts of 10–20s, 20–40s, and 60–80s. Average cohorts were composed of 981, 948, and 408 individual events for 10–20s, 20–40s, and 60–80s cohorts respectively. E) Representative time cohorts for clathrin-sites that associate with a liposome (red) and those that do not (blue). The median lifetime inset indicates a longer lifetime for the clathrin-sites that interact with a liposome in comparison to those that do not. Error bars represent the standard error of the mean across three independent trials. Data for E was acquired over at least 3 independent trials with at least 12 cells analyzed per trial culminating with N= 84, cells analyzed that were exposed to DOPC containing liposomes.
Figure 6.
Figure 6.. Comparisons for various particle types enable judgment on how physical particle properties can dictate particle-cell interactions.
A-C) Overall particle populations (black) and the distribution of particles present beneath cells for DPPC liposomes (A), DOPC liposomes (B), and biotinylated beads (C). The black curves are created from converted tethered vesicle distributions (as seen in Figure 2) and contain 8,960, 47,502, and 6,245 particle puncta for DPPC, DOPC, and beads respectively. The blue curves are taken beneath cells across 3 independent trials with a minimum of 12 cells analyzed per trial for a total cell count of 102, 84, and 110 cells for DPPC, DOPC, and beads respectively. The particle totals for each condition are 17,502 DPPC liposomes, 26,537 DOPC liposomes, and 6,094 beads.
Figure 7.
Figure 7.. Determining successfully internalized particles and elucidating the effects of particle stiffness.
A-D) Size distributions of particle diameters containing either DOPC (blue), DPPC (red), or biotinylated beads (gray). The top plot is the overall size distributions of the particles prior to delivery to cells (particle counts were 47,502, 13,318, and 6,245 for DOPC, DPPC, and beads respectively). The second plot is the distribution of particle diameters that penetrated beneath the basolateral membrane of adherent cells (particle counts were 26,537, 21,788, and 6,094 for DOPC, DPPC, and beads respectively). The third plot is the distribution of particle diameters that penetrated beneath adherent cells and associated with a clathrin coated structure (particle counts were 15,152, 14,730, and 2,028 for DOPC, DPPC, and beads respectively). The fourth plot is the distribution of diameters for particles that penetrated beneath adherent cells, associated with a clathrin-coated structure, and were successfully internalized by that structure (particle counts were 1,797, 1,540, and 358 for DOPC, DPPC, and beads respectively). E) Bar graph representing the probability of any particle associating with a clathrin coated structure (hashed group) compared to those that were beneath a 40 nm diameter cutoff (solid) for DOPC containing liposomes (red), DPPC containing liposomes (blue), and biotinylated beads (gray). The significance of differences between the small particle groups was determined by using a student’s t-test assuming unequal variances (DOPC vs DOPC- p < 10−5; DOPC vs Bead- p < 10−5; DPPC vs Bead- p = 0.0008) F) Bar graph representing the probability of any particle becoming successfully internalized by a clathrin-coated structure (hashed group) compared to those that were beneath a 40 nm diameter size cutoff (solid) for DOPC containing liposomes (red), DPPC containing liposomes (blue), and biotinylated beads (gray). The significance of differences between the small particle groups was determined by using a student’s t-test assuming unequal variances (DOPC vs DOPC- p < 10−5; DOPC vs Bead- p < 10−5; DPPC vs Bead- p = 0.0410) For E and F, at least 3 independent trials were conducted for each condition with a minimum of 12 cells analyzed per trial. The total number of cells analyzed was 84, 109, and 110 for DOPC, DPPC, and biotinylated beads respectively. G-H) The ratio of the probability of a particle beneath a diameter-cutoff (x-axis) of associating with a clathrin-coated structure (G), compared to the probability of the full particle diameter size distribution, and the ratio of the probability of a particle beneath a diameter size-cutoff of becoming successfully internalized by a clathrin-coated structure, compared to the probability of the full particle diameter distribution. The total number of cells in G and H were 68, 92, and 44, for DOPC (blue), DPPC (red), and biotinylated beads (gray) respectively. Any cells containing fewer than 150 internalization events beneath a 35 nm diameter cutoff were excluded from this analysis.

Similar articles

Cited by

References

    1. Aguet F, Antonescu CN, Mettlen M, Schmid SL, & Danuser G (2013). Advances in Analysis of Low Signal-to-Noise Images Link Dynamin and AP2 to the Functions of an Endocytic Checkpoint. Developmental Cell, 26(3), 279–291. 10.1016/j.devcel.2013.06.019 - DOI - PMC - PubMed
    1. Aguet F, Upadhyayula S, Gaudin R, Chou Y, Cocucci E, He K, Chen B-C, Mosaliganti K, Pasham M, Skillern W, Legant WR, Liu T-L, Findlay G, Marino E, Danuser G, Megason S, Betzig E, & Kirchhausen T (2016). Membrane dynamics of dividing cells imaged by lattice light-sheet microscopy. Molecular Biology of the Cell, 27(22), 3418–3435. 10.1091/mbc.E16-03-0164 - DOI - PMC - PubMed
    1. Antonny B, Burd C, De Camilli P, Chen E, Daumke O, Faelber K, Ford M, Frolov VA, Frost A, Hinshaw JE, Kirchhausen T, Kozlov MM, Lenz M, Low HH, McMahon H, Merrifield C, Pollard TD, Robinson PJ, Roux A, & Schmid S (2016). Membrane fission by dynamin: What we know and what we need to know. The EMBO Journal, 35(21), 2270–2284. 10.15252/embj.201694613 - DOI - PMC - PubMed
    1. Ashby G, Keng KE, Hayden CC, Gollapudi S, Houser JR, Jamal S, & Stachowiak JC (2023). Selective Endocytic Uptake of Targeted Liposomes Occurs within a Narrow Range of Liposome Diameters. ACS Applied Materials & Interfaces, 15(43), 49988–50001. 10.1021/acsami.3c09399 - DOI - PMC - PubMed
    1. Basagiannis D, Zografou S, Goula E, Gkeka D, Kolettas E, & Christoforidis S (2021). Chemical Inhibitors of Dynamin Exert Differential Effects in VEGF Signaling. Cells, 10(5), 997. 10.3390/cells10050997 - DOI - PMC - PubMed

LinkOut - more resources