

Network analyses predict major regulators of resistance to early blight disease complex in tomato
- PMID: 38971719
- PMCID: PMC11227178
- DOI: 10.1186/s12870-024-05366-0
Network analyses predict major regulators of resistance to early blight disease complex in tomato
Abstract
Background: Early blight and brown leaf spot are often cited as the most problematic pathogens of tomato in many agricultural regions. Their causal agents are Alternaria spp., a genus of Ascomycota containing numerous necrotrophic pathogens. Breeding programs have yielded quantitatively resistant commercial cultivars, but fungicide application remains necessary to mitigate the yield losses. A major hindrance to resistance breeding is the complexity of the genetic determinants of resistance and susceptibility. In the absence of sufficiently resistant germplasm, we sequenced the transcriptomes of Heinz 1706 tomatoes treated with strongly virulent and weakly virulent isolates of Alternaria spp. 3 h post infection. We expanded existing functional gene annotations in tomato and using network statistics, we analyzed the transcriptional modules associated with defense and susceptibility.
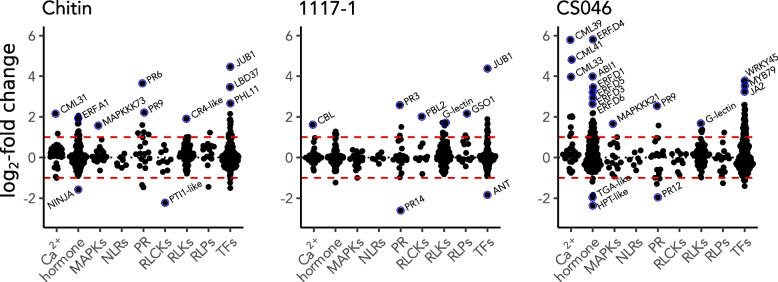
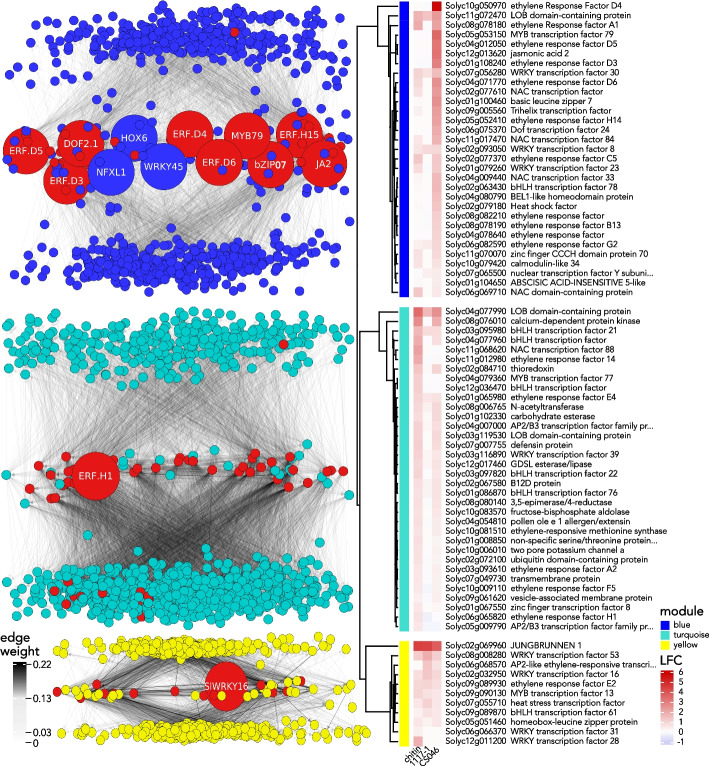
Results: The induced responses are very distinct. The weakly virulent isolate induced a defense response of calcium-signaling, hormone responses, and transcription factors. These defense-associated processes were found in a single transcriptional module alongside secondary metabolite biosynthesis genes, and other defense responses. Co-expression and gene regulatory networks independently predicted several D clade ethylene response factors to be early regulators of the defense transcriptional module, as well as other transcription factors both known and novel in pathogen defense, including several JA-associated genes. In contrast, the strongly virulent isolate elicited a much weaker response, and a separate transcriptional module bereft of hormone signaling.
Conclusions: Our findings have predicted major defense regulators and several targets for downstream functional analyses. Combined with our improved gene functional annotation, they suggest that defense is achieved through induction of Alternaria-specific immune pathways, and susceptibility is mediated by modulating hormone responses. The implication of multiple specific clade D ethylene response factors and upregulation of JA-associated genes suggests that host defense in this pathosystem involves ethylene response factors to modulate jasmonic acid signaling.
Keywords: Alternaria; Brown leaf spot; Co-expression network; Comparative transcriptomics; Early blight; Gene regulatory network; Plant immunity; Tomato.
© 2024. The Author(s).
Conflict of interest statement
The authors declare no competing interests.
Figures


Similar articles
-
Current Status of Early Blight Resistance in Tomato: An Update.Int J Mol Sci. 2017 Sep 21;18(10):2019. doi: 10.3390/ijms18102019. Int J Mol Sci. 2017. PMID: 28934121 Free PMC article. Review.
-
New insights into azelaic acid-induced resistance against Alternaria Solani in tomato plants.BMC Plant Biol. 2024 Jul 19;24(1):687. doi: 10.1186/s12870-024-05397-7. BMC Plant Biol. 2024. PMID: 39026164 Free PMC article.
-
Physiological and RNA-seq analyses provide insights into the response mechanism of the Cf-10-mediated resistance to Cladosporium fulvum infection in tomato.Plant Mol Biol. 2018 Mar;96(4-5):403-416. doi: 10.1007/s11103-018-0706-0. Epub 2018 Jan 30. Plant Mol Biol. 2018. PMID: 29383477
-
Multiple phytohormone signalling pathways modulate susceptibility of tomato plants to Alternaria alternata f. sp. lycopersici.J Exp Bot. 2013 Jan;64(2):637-50. doi: 10.1093/jxb/ers360. Epub 2012 Dec 21. J Exp Bot. 2013. PMID: 23264518 Free PMC article.
-
Alternaria diseases on potato and tomato.Mol Plant Pathol. 2024 Mar;25(3):e13435. doi: 10.1111/mpp.13435. Mol Plant Pathol. 2024. PMID: 38476108 Free PMC article. Review.
Cited by
-
A conserved fungal Knr4/Smi1 protein is crucial for maintaining cell wall stress tolerance and host plant pathogenesis.PLoS Pathog. 2025 Jan 9;21(1):e1012769. doi: 10.1371/journal.ppat.1012769. eCollection 2025 Jan. PLoS Pathog. 2025. PMID: 39787257 Free PMC article.
References
-
- Lukyanenko AN. Disease Resistance in Tomato. In: Kalloo G, editor. GeneticImprovement of Tomato. Berlin, Heidelberg: Springer; 1991. pp. 99–119.
-
- Zalom FG. Pests, endangered pesticides and processing tomatoes. Acta Hortic. 2003;613:223–33.
-
- Foolad MR, Merk HL, Ashrafi H. Genetics, genomics and breeding of late blight and early blight resistance in tomato. Crit Rev Plant Sci. 2008;27:75–107. doi: 10.1080/07352680802147353. - DOI
MeSH terms
Substances
LinkOut - more resources
Full Text Sources
Miscellaneous
