. 2024 Jul 6;15(1):197.
doi: 10.1186/s13287-024-03787-0.

Essential role of p21Waf1/Cip1 in the modulation of post-traumatic hippocampal Neural Stem Cells response

Affiliations

Essential role of p21Waf1/Cip1 in the modulation of post-traumatic hippocampal Neural Stem Cells response

Francesco Chiani et al. Stem Cell Res Ther. .

Abstract

Background: Traumatic Brain Injury (TBI) represents one of the main causes of brain damage in young people and the elderly population with a very high rate of psycho-physical disability and death. TBI is characterized by extensive cell death, tissue damage and neuro-inflammation with a symptomatology that varies depending on the severity of the trauma from memory loss to a state of irreversible coma and death. Recently, preclinical studies on mouse models have demonstrated that the post-traumatic adult Neural Stem/Progenitor cells response could represent an excellent model to shed light on the neuro-reparative role of adult neurogenesis following damage. The cyclin-dependent kinase inhibitor p21Waf1/Cip1 plays a pivotal role in modulating the quiescence/activation balance of adult Neural Stem Cells (aNSCs) and in restraining the proliferation progression of progenitor cells. Based on these considerations, the aim of this work is to evaluate how the conditional ablation of p21Waf1/Cip1 in the aNSCS can alter the adult hippocampal neurogenesis in physiological and post-traumatic conditions.

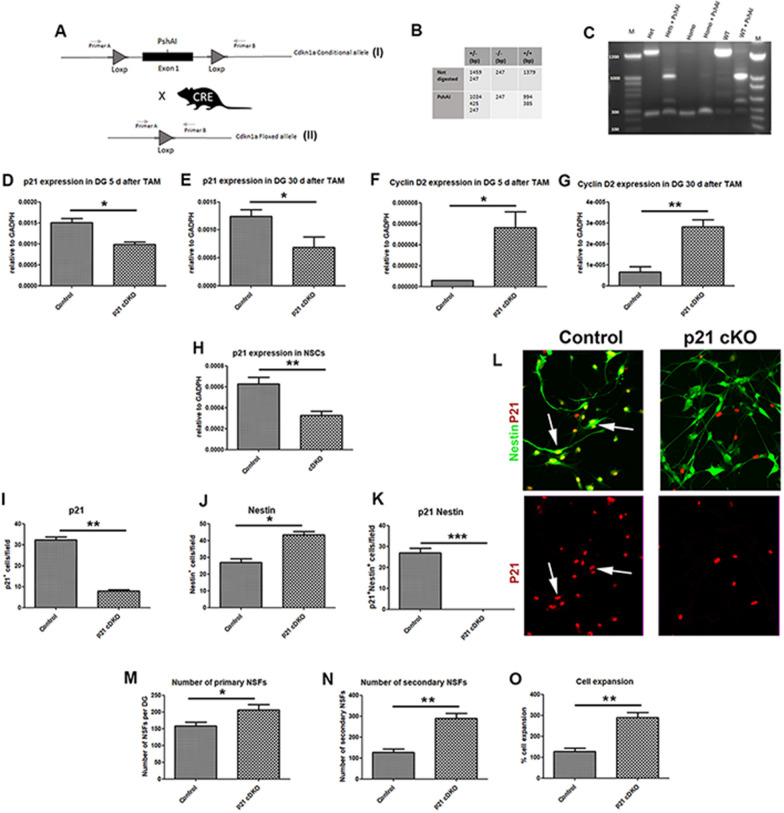
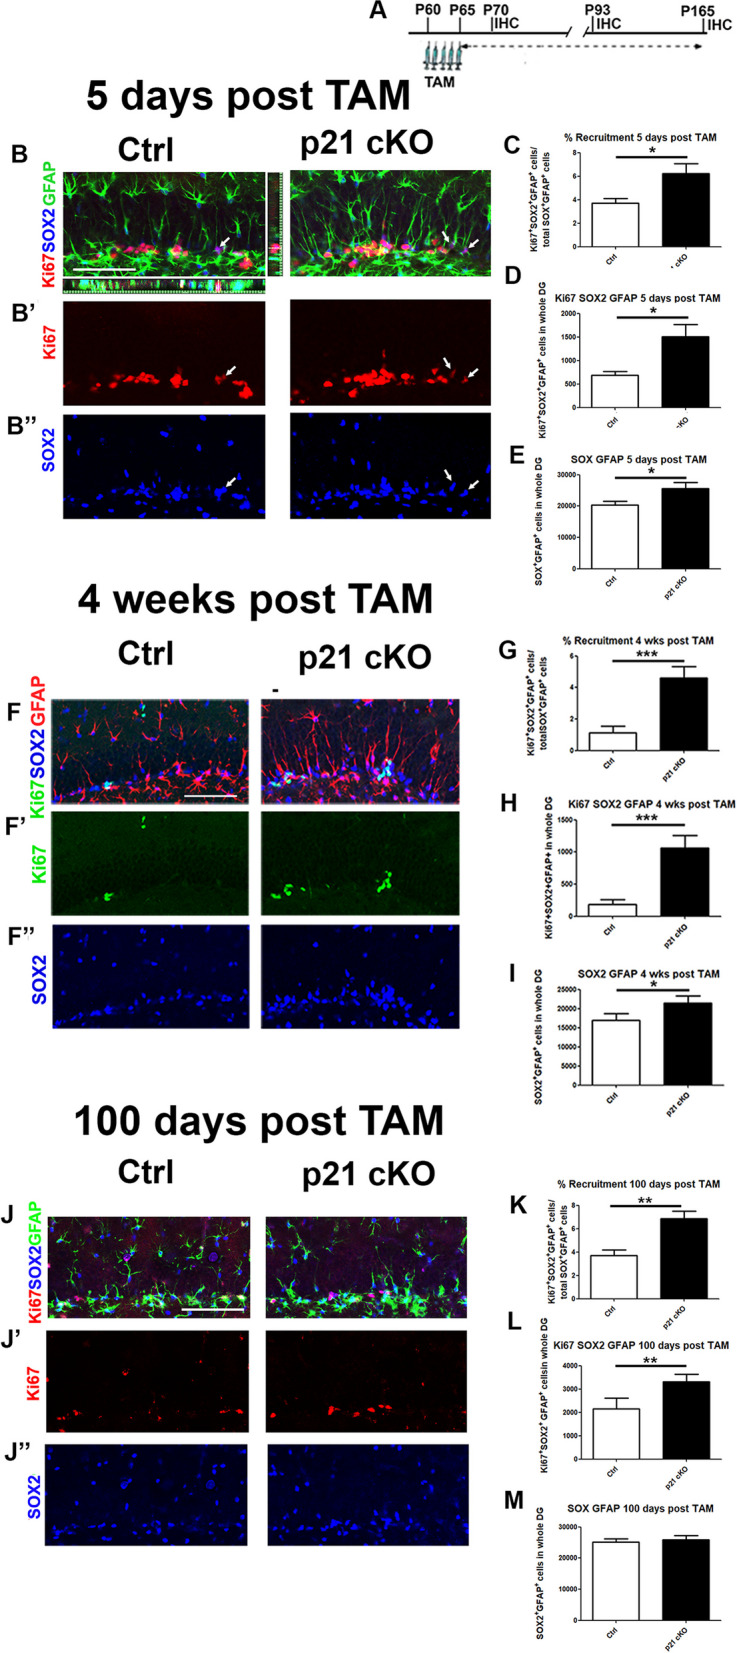
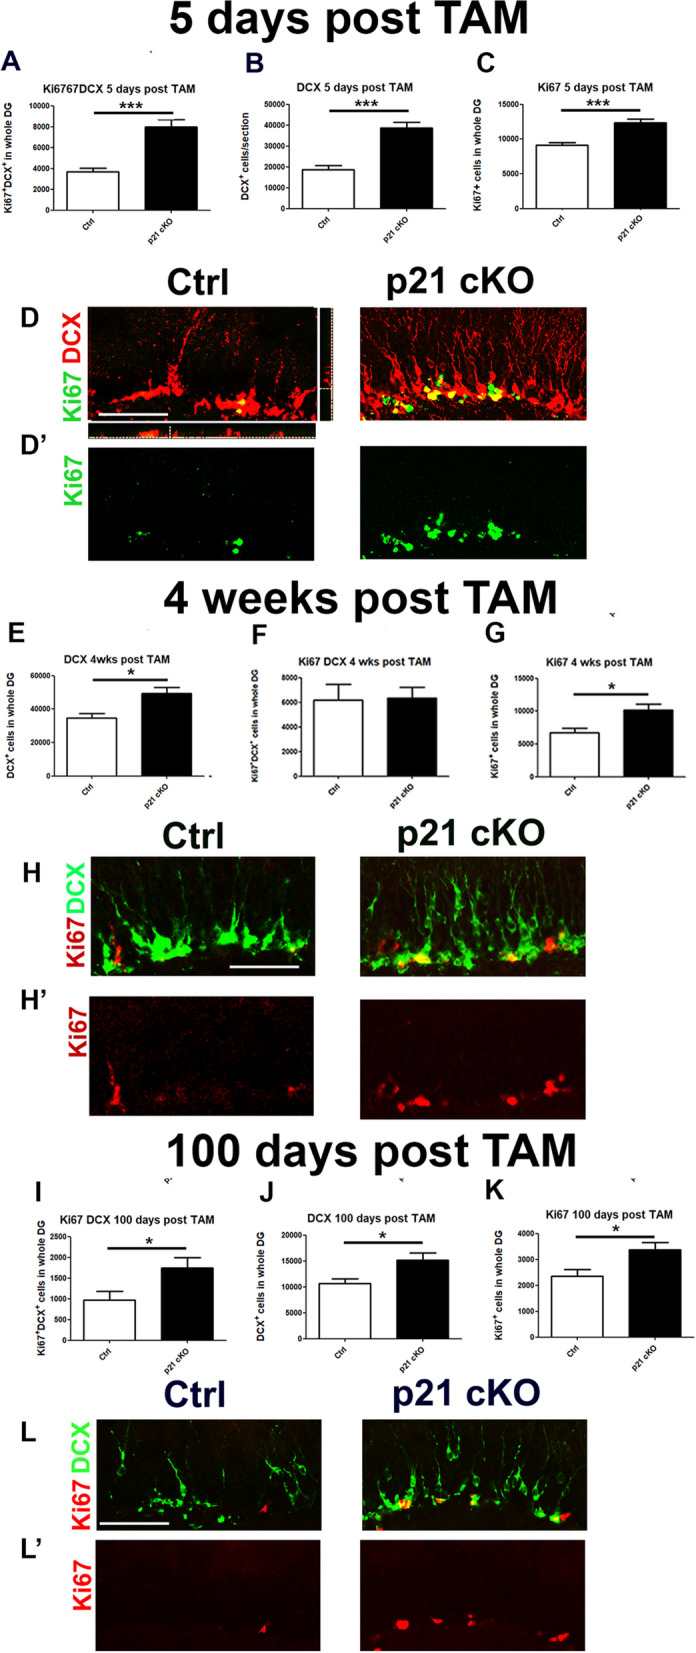
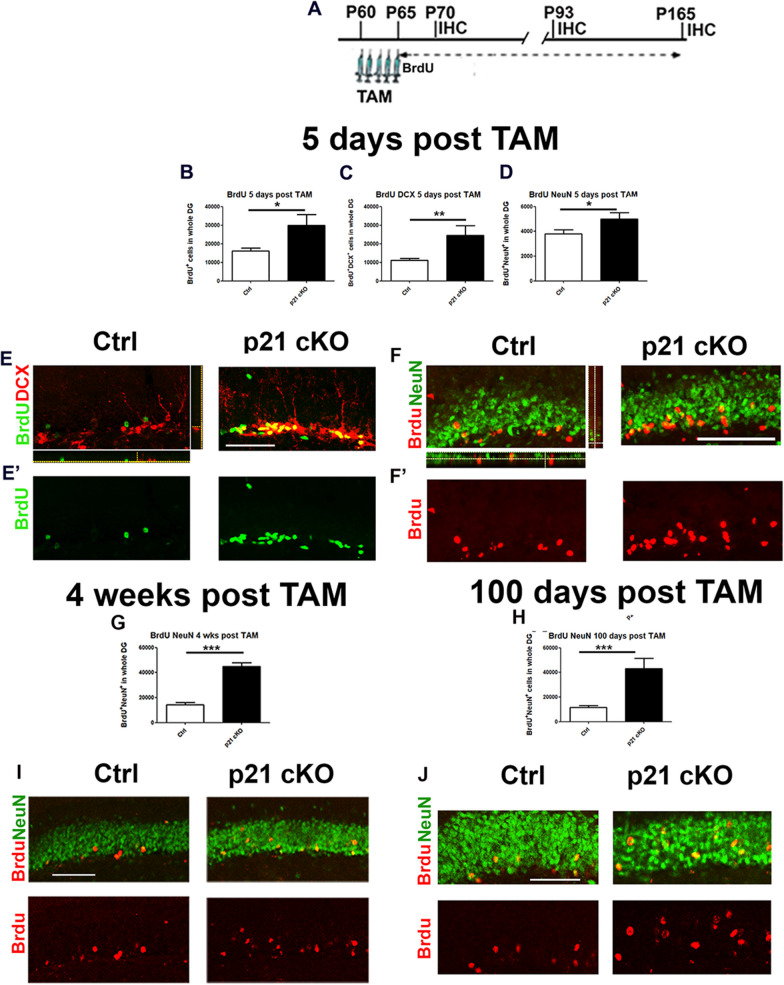
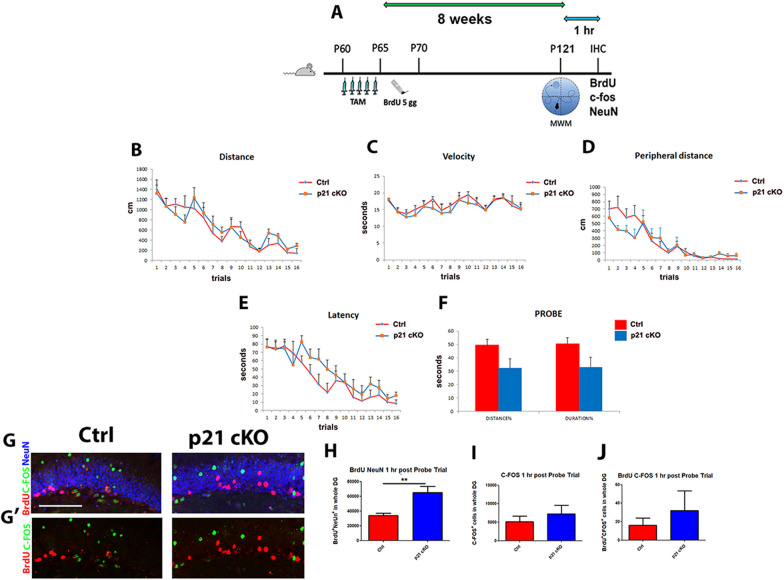
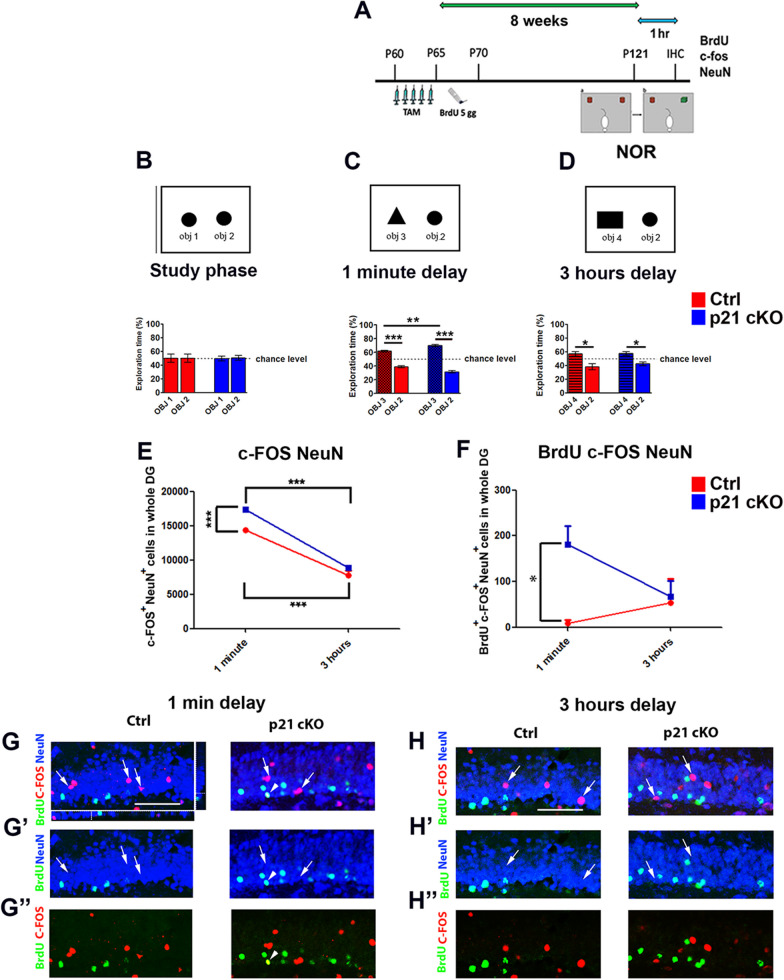
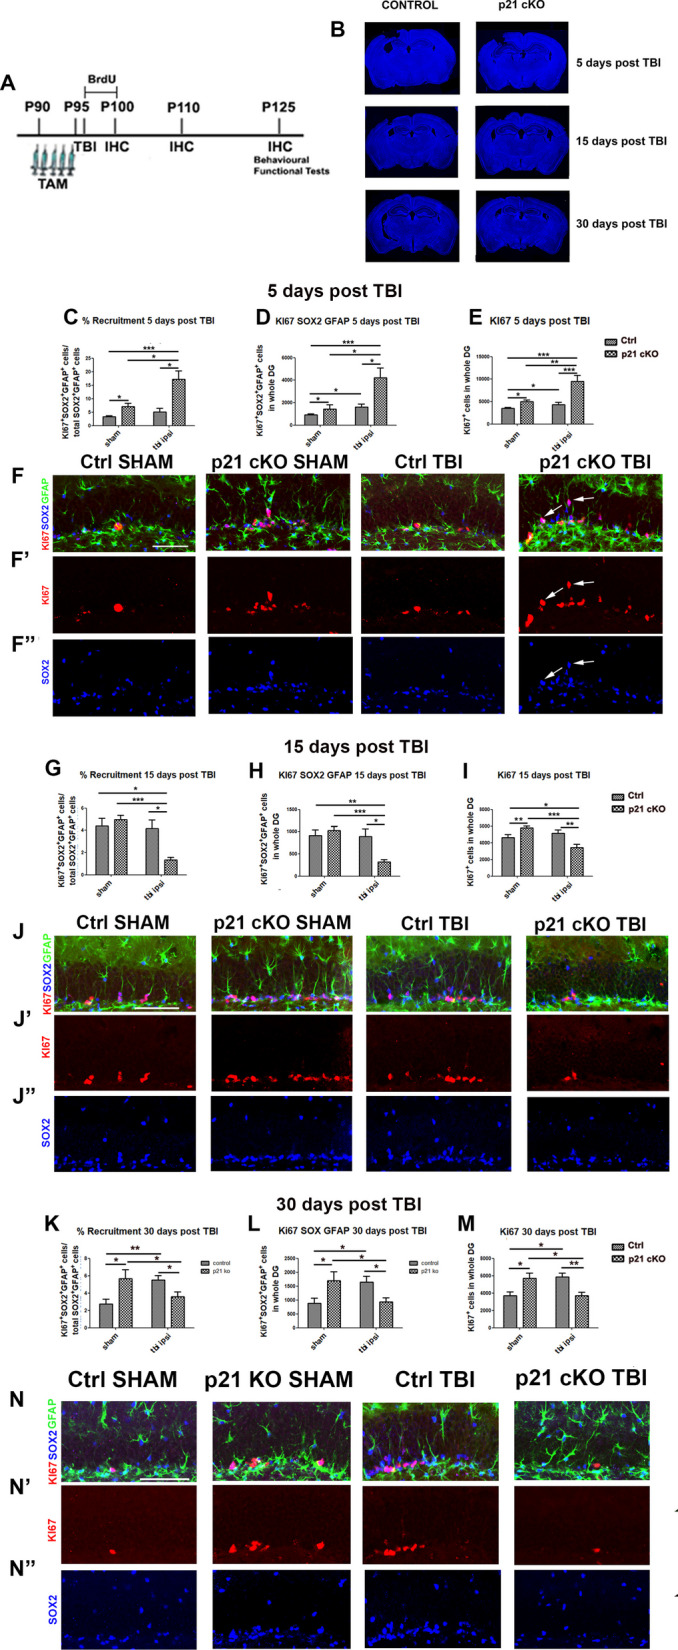
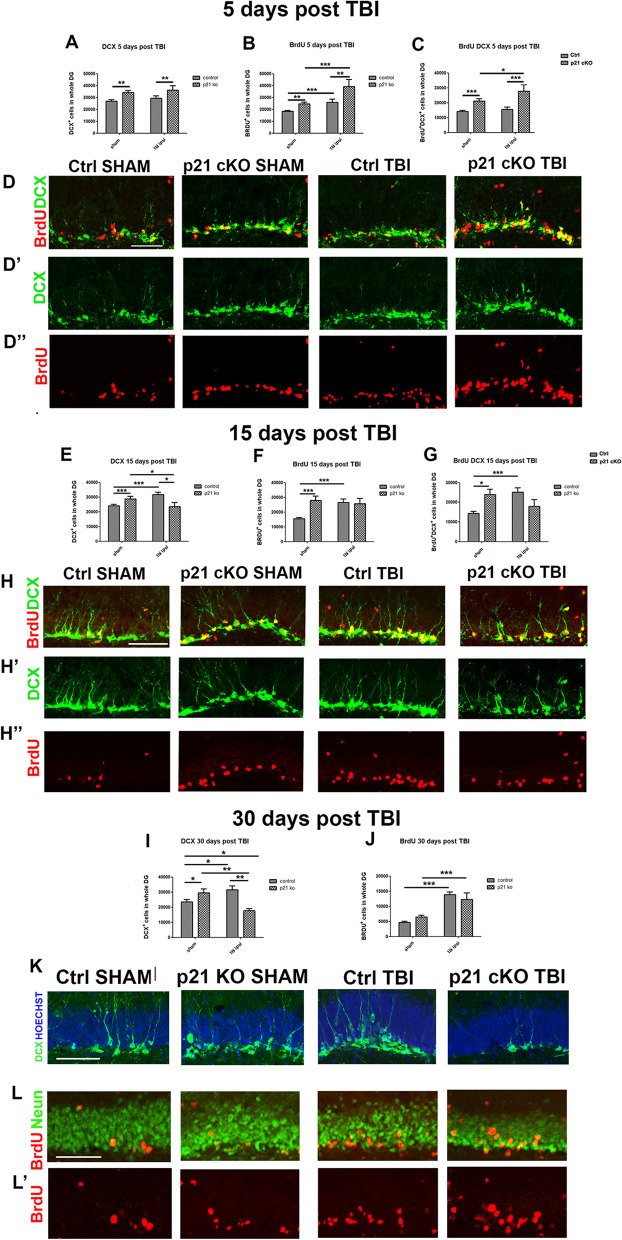
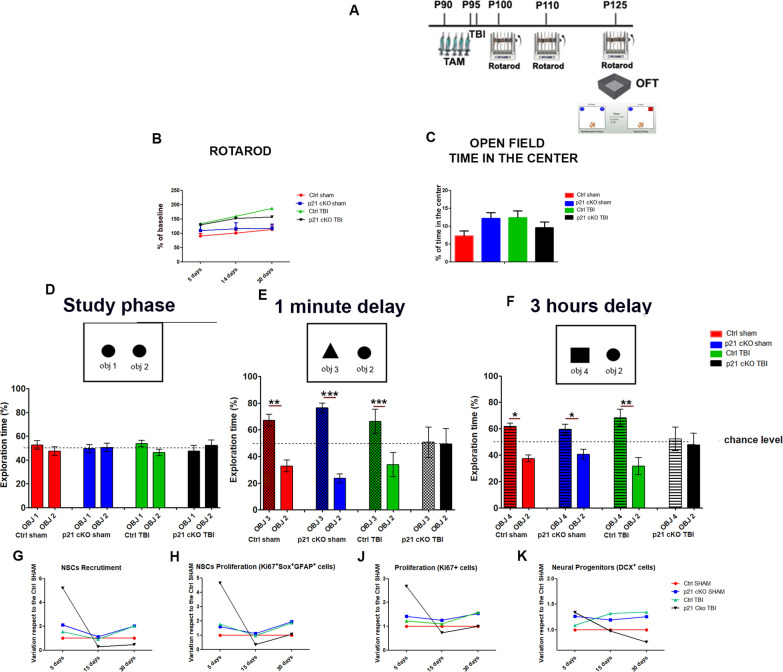
Methods: We designed a novel conditional p21Waf1/Cip1 knock-out mouse model, in which the deletion of p21Waf1/Cip1 (referred as p21) is temporally controlled and occurs in Nestin-positive aNSCs, following administration of Tamoxifen. This mouse model (referred as p21 cKO mice) was subjected to Controlled Cortical Impact to analyze how the deletion of p21 could influence the post-traumatic neurogenic response within the hippocampal niche.

Results: The data demonstrates that the conditional deletion of p21 in the aNSCs induces a strong increase in activation of aNSCs as well as proliferation and differentiation of neural progenitors in the adult dentate gyrus of the hippocampus, resulting in an enhancement of neurogenesis and the hippocampal-dependent working memory. However, following traumatic brain injury, the increased neurogenic response of aNSCs in p21 cKO mice leads to a fast depletion of the aNSCs pool, followed by declined neurogenesis and impaired hippocampal functionality.

Conclusions: These data demonstrate for the first time a fundamental role of p21 in modulating the post-traumatic hippocampal neurogenic response, by the regulation of the proliferative and differentiative steps of aNSCs/progenitor populations after brain damage.

Keywords: Adult Neural Stem Cells; Adult hippocampal neurogenesis; Neural regeneration; Traumatic brain injury; Working memory; p21.


Conflict of interest statement

The authors declare that they have no competing interests.

Figures

Fig. 1
Fig. 1
Generation and characterization of p21 cKO mice model. A Scheme of the putative synthetic allele before (I) and after (II) after Cdkn1a conditional mouse was bred with an ACT-CRE deleter. Loxp was inserted in Cis configuration. The breeding with a CRE deleter mouse lead to excision of the Exon1 of the Cdkn1a gene. B Sizes of the expected bands after Long Range PCR performed on: Heterozygotes mouse (Het), Homozygote mouse (Homo) and WT mouse (from the same litter). Expected additional bands were reported after PshAI restriction of the amplicons. C 1% Uncropped full-length agarose gel of the samples obtained by Long Range PCR using Primer A and B. As an additional control half of each sample was digested with PshAI restriction enzyme (PshAI). D-E rt-PCR analysis revealing the levels of p21 gene expression in the DG of p21 cKO and Control mice after 5 (D) and 28 (E) days after TAM injection. F-G Levels of expression of Cyclin D2 gene in the DG of p21 cKO and Control mice after 5 (F) and 28 (G) days after TAM injection. H Level of expression of p21 gene in the neurospheres obtained from p21 cKO and Control mice after 5 TAM injections. I-J Quantification of number of in vitro cultured NSCs isolated from Control and p21 cKO mice and immunostained for p21 (I), Nestin (J) and p21/Nestin (K) antibodies. (L) Representative images illustrating the decreased number of p21 (red), the increased number of Nestin (green), and the absence of p21 (red) in the Nestin+ cells (green) in the p21 cKO mice compared to the Control mice. M Number of clonal neurospheres derived from DG from the different experimental groups 5 days after TAM injection. Relative to the Control mice, neurospheres generated from p21 cKO mice largely increased. N Graph showing the number of secondary neurospheres (DIV 14), with a large enhancement of number neurospheres derived from p21 cKO mice. O Percentage of cell expansion of neurospheres expressed as the total number of cells at the end of the culture at the second passage divided by the initial number of cells. Compared with the Control conditions, a consistent expansion in the p21 cKO occurred. Statistical significance: *p < 0.05, **p < 0.01, ***p < 0.001, Mann Whitney Test. Confocal images magnification 20x. Expression analysis: N = 4 animals/groups. In vitro analysis: N = 5 animals/group
Fig. 2
Fig. 2
Deletion of p21 in NSCs induces a long-lasting expansion of NSCs pool. A Schematic timeline of the experimental procedure. Control and p21 cKO mice were injected with TAM for 5 days and sacrificed 5, 28 and 100 days after the last administration of TAM. B-B’’ Representative fluorescence confocal images showing the increased recruitment and proliferation of KI67+ (red)/SOX2+(blue)/GFAP+(green) NSCs in the DG of p21 cKO mice respect to the Control group at 5 days after TAM injections. Arrows indicate the NSCs expressing the three specific markers. (B) Representative orthogonal view showing co-localization of KI67+ SOX2+GFAP+ cells in zx and zy axes. C–E Graphs illustrating the increased recruitment (ratio between Ki67+/SOX2+/GFAP+ cells/SOX2+GFAP+ total cells, C), proliferation (number of Ki67+/SOX2+/GFAP+ cells, D) and pool expansion (number of SOX2+/GFAP+ cells, E) in the p21 cKO at 5 days after TAM. F–F’’ Representative confocal images describing the enhancement of recruitment and proliferation of KI67+ (green)/SOX2+(blue)/GFAP+(red) NSCs in the DG of p21 cKO mice respect to the Control group 28 days after TAM injections. G–I Graphs showing the increment of recruitment (G), proliferation (H) and pool expansion (I) in the p21 cKO respect to the Control mice at 28 days after TAM injections. J–J’’ 100 days after TAM injections the confocal images demonstrate the increase rate of NSCs (identified by the marker Ki67 red, SOX2 blue and GFAP green) recruitment and proliferation in the DG of p21 cKO mice. K–M The graphs show in the p21 cKO mice an increase of NSCs activation (K) and proliferation (L), without an expansion of NSCs pool (M). Statistical significance: *p < 0.05, **p < 0.01, ***p < 0.001, Mann Whitney Test. Scale bar 100 µm. Confocal images magnification 20x. N = 5 animals/group
Fig. 3
Fig. 3
Deletion of p21 in aNSCs induces long-lasting increase of number of neural progenitors (AB). Graphs illustrate in the DG of p21 cKO mice an increase in the number of proliferating neuroblasts (Ki67 + /DCX + cells, A), leading to an enhancement of total neuroblasts (DCX + cells, B) 5 days after TAM injections. C Graph showing the increased total proliferation (Ki67+ cells) in the DG of p21 cKO mice 5 days after TAM injections DD’. Representative confocal images showing that in the DG of p21 cKO group there is a significant increase of DCX+ (red) and Ki67+ (green) neural progenitors. D Representative orthogonal view showing co-localization of KI67+ DCX+ cells in zx and zy axes. E–G The graphs indicate that although no increase in Ki67 + DCX + cells is observed (E), the number of DCX+ (F) and Ki67+ (G) cells is significantly higher in the DG of p21 cKO mice respect to the Control 28 days after TAM. H–H’ Representative images indicating the increased number of DCX + neuroblasts (green) and proliferating cells (red) in the DG of p21 cKO mice respect to the Control 28 days after TAM injections. IK Graphs describing that 100 days from TAM injection it is still possible to observe a significant increase of proliferating neuroblasts (Ki67+/DCX+ cells, I), of neuroblasts pool (DCX+ cells, J) and of proliferation (Ki67+ cells, K) in the p21 cKO mice. LL’ Representative confocal images showing the increased number of DCX+ neuroblasts (green) and proliferating cells (red) in the DG of p21 cKO mice respect to the Control 28 days after TAM injections. Statistical significance: *p < 0.05, **p < 0.01, ***p < 0.001, Mann Whitney Test. Scale bar 100 µm. Confocal images magnification 20x. N = 5 animals/group
Fig. 4
Fig. 4
Deletion of p21 in NSCs induces a long-lasting enhancement of neurogenesis. A Schematic timeline of the experimental procedure. Control and p21 cKO mice were injected with for 5 days TAM, followed by 5-daily injections of BrdU and sacrificed 5, 28 and 100 days after the last administration of TAM. BD Graphs indicating that at 5 days following TAM injections, in the DG of p21 cKO there is a significant increase BrdU+ cells (B), co-expressing both DCX (C) and the marker of mature neuron NeuN (D). EE’ Representative confocal images showing the increased total number of BrdU+ (red) and BrdU+DCX+ (green and red) neuroblasts in the p21 cKO mice. E Representative orthogonal view showing co-localization of BrdU+ DCX+ cells in zx and zy axes. F’-F Representative confocal pictures showing the enhanced total number of BrdU+ (red) NeuN+ (green) newborn neurons in the p21 cKO mice. F Representative orthogonal view showing co-localization of BrdU+ Neun+ cells in zx and zy axes. G, H Graphs showing the enhanced number of new mature neurons (BrdU+/NeuN+ cells) in the DG of p21 cKO mice both 28 (G) and 100 (H) days after TAM injections. II’ and JJ’) Representative images indicating the significant increment of BrdU+/NeuN+ (red and green, respectively) in the DG of p21 cKO mice both 28 (II’) and 100 (JJ’) days after TAM. Statistical significance: *p < 0.05, **p < 0.01, ***p < 0.001, Mann Whitney Test. Scale bar 100 µm. Confocal images magnification 20x. N = 5 animals/group
Fig. 5
Fig. 5
Deletion of p21 in NSCs has no effect on Morris Water Maze. A Schematic timeline of the experimental procedure. 2 months-old control and p21 cKO mice were injected with TAM for 5 days, followed by 5 injections of BrdU. 10 weeks after TAM administration mice were subjected to Water Maze behavioural task. 1 h after the end of the test animals were sacrificed and analyzed for the quantification of newborn neurons recruited to the hippocampal neural circuits BF Distance (B, genotype effect: F1,17 = 0.83, p = 0.37; trial effect: F15,255 = 12.30, p < 0.0000001; genotype x trial effect: F15,255 = 0.65, p = 0.83), velocity (C, genotype effect: F1,17 = 0.40, p = 0.54; trial effect: F15,255 = 4.56, p < 0.0000001; genotype x trial effect: F15,255 = 0.35, p = 0.99), latency (D, genotype effect: F1,17 = 3.36, p = 0.08, trial effect: F15,255 = 19.23, p < 0.0000001; genotype x trial effect: F15,255 = 1.25, p = 0.23), and percentage of peripheral distance (E, genotype effect: F1,17 = 0.06, p = 0.81; trial effect: F15,255 = 16.98, p < 0.0000001; genotype x trial effect: F15,255 = 1.29, p = 0.21, Two-Way mixed-design ANOVA) during the Place phase of the Morris Water Maze (MWM); percentage of distance swum and time spent in the previously rewarded quadrant during the Probe trial (F, t-test, p > 0.05). GG’ Representative confocal images illustrating the increased BrdU+/NeuN+ cells in p21 cKO mice in comparison with the Control mice. HJ The graphs show the significant increase of BrdU+/NeuN+ cells in the p21 cKO mice (H), while we did not observe any difference in the number of c-Fos+/NeuN+ (I) and BrdU+/c-Fos+/NeuN+ (J) cells between the two groups of animals. Statistical significance **p < 0.01, Mann Whitney Test. Scale bar 100 µm. Confocal images magnification 20x. N = 12 Ctrl and 8 p21 cKO mice
Fig. 6
Fig. 6
Deletion of p21 in aNSCs increase working memory in NOR. A Schematic timeline of the experimental procedure. 2 months-old Control and p21 cKO mice were injected with TAM for 5 days, followed by 5 injections of BrdU. 8 weeks after TAM injections, the mice were subjected to then NOR behavioural task. One hour after the end of the test, the animals were sacrificed and analyzed for the quantification of newborn neurons recruited to the hippocampal neural circuits. B Diagram and graph relating to the study phase showing how the Control and p21 cKO mice showed no preference for two identical objects 1 and 2. C The graph indicates that 1 min after the study phase both the animal group show a preference for the new object 3, with a significantly higher performance in the p21 cKO mice. D In the 3-h delay task the percentage of time spent with the new object 4 is significantly higher respect to the familiar object 1 in both the groups. E–F The graphs illustrate the enhancement of c-Fos+/NeuN+ neurons (E) and BrdU+/c-Fos+/NeuN+ (green, red and blue cells, F) activated newborn neurons in the DG of p21 cKO mice only in the 1-min delay interval. GG’’ Representative confocal images illustrating the increased c-Fos+/NeuN+ cells (red/blue) and BrdU+/c-Fos+/NeuN+ cells (green, red and blue) in p21 cKO mice at 1-min interval. G Representative orthogonal view showing co-localization of BrdU+, c-Fos+ and NeuN+ cells in zx and zy axes. Arrows indicate cells double labelled for c-Fos and NeuN antibodies. Arrowhead show cells positive for BrdU, c-Fos and NeuN. H–H’’ Representative confocal images illustrating the comparable number of c-Fos+/NeuN+ cells (red/blue) and BrdU+/c-Fos+/NeuN+ cells (green, red and blue) between Control and p21 cKO mice at 3-h.interval. Statistical significance: *p < 0.05, **p < 0.01, ***p < 0.001, Mann Whitney Test. Scale bar 100 µm. Confocal images magnification 20x. Behavioural analysis N = 12 animals/group. Immunofluorescence analysis, N = 5 animals/group
Fig. 7
Fig. 7
Effect of deletion of p21 in NSCs during post-traumatic neurogenic response. A Schematic timeline of the experimental procedure. 3 months-old control and p21 cKO mice were injected with TAM for 5 days. The day after mice were subjected to CCI (TBI groups) or surgical procedure (SHAM groups) and injected with 5 daily injections of BrdU. The 4 groups of mice were analyzed at 5, 15 and 30 days after CCI. Motor coordination analysis (Rotarod) was carried out at 5, 15 and 30 days after CCI, while spontaneous behavior and locomotor activity (Open Field) and cognitive task (Open Field and NOR) were performed 30 days after CCI. B Representative images showing the cortical damage induced by CCI at the different time point analyzed. C–E Graphs showing the large increment of NSCs recruitment rate (C, genotype x TBI interaction: F(1,30) = 6,97, p < 0.05, followed by Bonferroni post-test, cKO TBI vs Ctrl SHAM p < 0.001, vs cKO SHAM and Ctrl TBI p < 0.05), aNSCs proliferation (D, genotype x TBI interaction: F(1,30) = 5.96, p < 0.05, followed by Bonferroni post-test, cKO TBI vs Ctrl SHAM, cKO SHAM and Ctrl TBI p < 0.001) and total proliferation (E, genotype x TBI interaction: F(1,76) = 7.38, p < 0.01, followed by Bonferroni post-test, cKO TBI vs Ctrl SHAM, cKO SHAM and Ctrl TBI p < 0.001,) in the ipsi-lateral DG of p21 cKO TBI mice respect to the other experimental groups 5 days after TBI. F–F’’ Representative images illustrating the increase in the ipsi-lateral DG of p21 cKO TBI of proliferating NSCs positive for Ki67 (red), GFAP (green) and SOX2 (blue) antibodies. G–I After 15 days from TBI, we observe a dramatic drop in the in the ipsi-lateral DG of p21 cKO TBI of NSCs activation (G, genotype x TBI interaction: F(1,39) = 5.9 p < 0.05, followed by Bonferroni post-test, cKO TBI vs Ctrl SHAM and Ctrl TBI p < 0.5, vs cKO SHAM and p < 0.001,), NSCs proliferation (H, genotype x TBI interaction: F(1,39) = 5.9, p < 0.05, followed by Bonferroni post-test, cKO TBI vs Ctrl SHAM, cKO SHAM p < 0.001 and Ctrl TBI p < 0.05) and total proliferation (I, genotype x TBI interaction: F(1,93) = 17.11 p < 0.001, followed by Bonferroni post-test, cKO TBI vs cKO SHAM and vs Ctrl TBI p < 0.05,) respect to the other mice groups. J–J’’ In these images it is possible to observe the strong decline of proliferating NSCs (Ki67+ red/GFAP + green/SOX2+ blue cells, J) as well as the decrease of total proliferation (Ki67+ red, cells, I’) in the ipsi-lateral DG of p21 cKO TBI mice. K–M The graphs show the decrease of NSCs recruitment (K, genotype x TBI interaction: F(1,34) = 9.8 p < 0.01, followed by Bonferroni post-test, cKO TBI vs cKO SHAM and vs Ctrl TBI p < 0.05), the NSCs proliferation (L, genotype x TBI interaction: F(1,34) = 10.4 p < 0.01, followed by Bonferroni post-test, cKO TBI vs cKO SHAM and vs Ctrl TBI p < 0.05) and the total proliferation (M, genotype x TBI interaction: F(1,33) = 17 p < 0.001, followed by Bonferroni post-test, cKO TBI vs cKO SHAM p < 0.05 and vs Ctrl TBI p < 0.01) in the ipsi-lateral DG of p21 cKO TBI respect to the p21 cKO SHAM and Ctrl TBI mice as well as the significant increase of the above parameters observed in the ipsi-lateral DG of Ctrl TBI mice respect their SHAM group. N–N’’ Representative images illustrating the decrease in the p21 cKO TBI mice and the increase in the Ctrl TBI mice of proliferating NSCs positive for Ki67 (red), GFAP (green) and SOX2 (blue) antibodies. Statistical significance: *p < 0.05, **p < 0.01, ***p < 0.001. Two-Way ANOVA analysis, by Bonferroni post hoc tests. Scale bar 100 µm. Confocal images magnification 20x. N = 5 animals/group
Fig. 8
Fig. 8
Effect of deletion of p21 in neurogenesis during post-traumatic neurogenic response. A Graph illustrating the effect of p21 deletion in the increase of DCX+ cells in the ipsi-lateral DG 5 days after TBI. AC Graphs showing the effect of p21 deletion in the increase of DCX+ cells in the ipsi-lateral DG 5 days after TBI. The data indicates that 5 days after TBI there is a significant increment of DCX+ (A, genotype effect F(1,70) = 10,12, p < 0.01, Fig. 8 A, D’), an increment of BrdU+ (B, genotype effect: F(1,37) = 10,69, p < 0.01, TBI effect: F(1,37) = 13,36, p < 0.001,) and BrdU+/DCX+ cells (C, genotype effect: F(1,35) = 27, p < 0.001, TBI effect: F(1,35) = 4,4, p < 0.05,) in the ipsi-lateral DG of p21 cKO TBI mice respect to the other groups. DD’’ Representative images showing the increased number of BrdU+ (red, D’’) and BrdU+ (red)/DCX+ (green, D) newborn progenitor cells in the p21 cKO TBI mice compared to the other groups. E Graph showing the increase of DCX+ cells in the ipsi-lateral DG of Ctrl TBI group respect to the Ctrl SHAM group and the decrease of DCX+ cells in the ipsi-lateral p21 cKO TBI mice in comparison with Ctrl TBI and p21 cKO mice, 15 days after TBI. EG Graphs indicating a significant decrease of DCX + cells (E, genotype x TBI interaction: F(1,104) = 12,17 p < 0.001, followed by Bonferroni post-test, cKO TBI vs Ctrl SHAM p < 0.05, vs cKO SHAM p < 0.001 and vs Ctrl TBI p < 0.01), an increase of BrdU + (F, genotype x TBI interaction: F(186) = 6, p < 0.05, followed by Bonferroni post-test, cKO TBI vs Ctrl SHAM, cKO SHAM and vs Ctrl TBI p < 0.05) and BrdU+/DCX+ (G, genotype x TBI interaction: F(1,57) = 9.3 p < 0.01, followed by Bonferroni post-test, cKO TBI vs Ctrl SHAM, cKO SHAM and vs Ctrl TBI p < 0.05) cells in the ipsi-lateral DG of Ctrl TBI mice respect their SHAM littermates, 15 days after TBI. H–H’’ Confocal micrographs showing the enhanced number BrdU+ (red, H’’) and BrdU+ (red)/DCX+ (green, H) newborn progenitors cells in the Ctrl TBI mice respect to the Ctrl SHAM group, 15 days after TBI. (I) Graph showing: 1) the significant drop in the number of DCX+ in the ipsi-lateral DG of p21 cKO mice respect to the other experimental condition ((genotype x TBI interaction: F(1,31) = 22 p < 0.001, followed by Bonferroni post-test, cKO TBI vs cKO SHAM p < 0.05 and vs Ctrl SHAM and Ctrl TBI p < 0.01) and 2) the increase of DCX+ cells in the ipsi-lateral DG of Ctrl TBI mice respect to the Ctrl SHAM group (ipsi- and contra-lateral: Ctrl TBI vs Ctrl SHAM p < 0.05) 30 days after TBI. J Graph showing the TBI-effect in the increase of BrdU+ cells in the ipsi-lateral DG, 30 days after TBI. K Confocal images showing the decreased number of DCX+ (green) in the p21 cKO mice and the BrdU+ cells enhancement in the Ctrl TBI group respect to the Ctrl SHAM mice. L Confocal pictures illustrating the increased number of BrdU+ (red)/NeuN+ (green) cells in the groups underwent to TBI when compared with the SHAM mice. Statistical significance: *p < 0.05, **p < 0.01, ***p < 0.001. Two-Way ANOVA analysis, by Bonferroni post hoc tests. Scale bar 100 µm. Confocal images magnification 20x. N = 5 animals/group
Fig. 9
Fig. 9
Functional and behavioural outcomes after TBI. A Schematic timeline of the experimental procedure, already described in Fig. 7A. B Graph showing that TBI does not induce significant differences in the Rotarod test within the 4 experimental groups at the different time-point after lesion (Three-way ANOVA genotype x TBI x time, F (1,57) = 0.9, p > 0.05). C The graph indicates that the animal of the 4 groups spend comparable amount of time in the Centre of the Open Field (Two-Way ANOVA p > 0.05). D The graph indicates that all the 4 groups of mice spent a comparable percentage of time with the identical object 1 and 2. E, F The graphs indicate that the Ctrl SHAM, cKO SHAM and Ctrl TBI display a significantly higher preference towards the new respect to the familiar object at the 1-min interval (t-Test object 3 vs object 2: Ctrl SHAM p < 0.01, cKO SHAM p < 0.05 and vs Ctrl TBI p < 0.001), as well as after 3 h from the study phase (t-Test object 4 vs object 2: Ctrl SHAM p < 0.05, cKO SHAM p < 0.05 and vs. Ctrl TBI p < 0.01). G-K Graphs representing the variation rate of NSCs recruitment (G) and proliferation (H) as well as total proliferation (K) observed in the cKO SHAM, Ctrl TBI, cKO TBI mice respect to the Ctrl SHAM group. Statistical significance: *p < 0.05, Mann Whitney Test. N = 12 animals/groups

References

    1. Hyder AA, Wunderlich CA, Puvanachandra P, Gururaj G, Kobusingye OC. The impact of traumatic brain injuries: a global perspective. NeuroRehabilitation. 2007;22:341–53. doi: 10.3233/NRE-2007-22502. - DOI - PubMed
    1. Capizzi A, Woo J, Verduzco-Gutierrez M. Traumatic brain injury: an overview of epidemiology, pathophysiology, and medical management. Med Clin North Am. 2020;104(2):213–238. doi: 10.1016/j.mcna.2019.11.001. - DOI - PubMed
    1. Majdan M, Plancikova D, Brazinova A, Rusnak M, Nieboer D, Feigin V, et al. Epidemiology of traumatic brain injuries in Europe: a cross-sectional analysis. Lancet Public Health. 2016;1:e76–e83. doi: 10.1016/S2468-2667(16)30017-2. - DOI - PubMed
    1. Haarbauer-Krupa J, Pugh MJ, Prager EM, Harmon N, Wolfe J, Yaffe K. Epidemiology of chronic effects of traumatic brain injury. J Neurotrauma. 2021;38(23):3235–3247. doi: 10.1089/neu.2021.0062. - DOI - PMC - PubMed
    1. Dewan MC, Rattani A, Gupta S, Baticulon RE, Hung YC, Punchak M, et al. Estimating the global incidence of traumatic brain injury. J Neurosurg. 2018 doi: 10.3171/2017.10.JNS17352. - DOI - PubMed

Publication types

Substances

LinkOut - more resources