. 2024 Jul 6;15(1):5677.
doi: 10.1038/s41467-024-49722-y.

Human navigation strategies and their errors result from dynamic interactions of spatial uncertainties

Affiliations

Human navigation strategies and their errors result from dynamic interactions of spatial uncertainties

Fabian Kessler et al. Nat Commun. .

Abstract

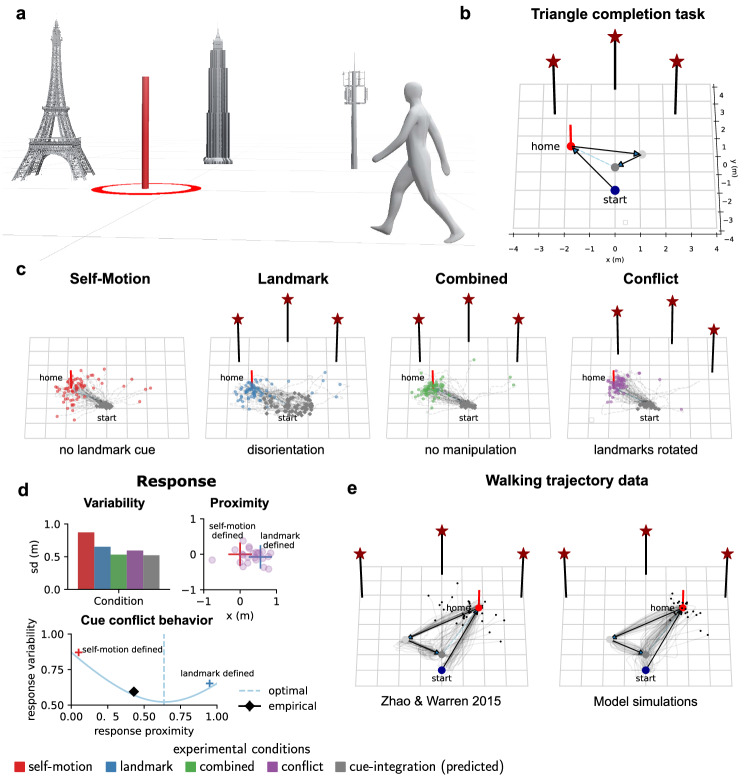
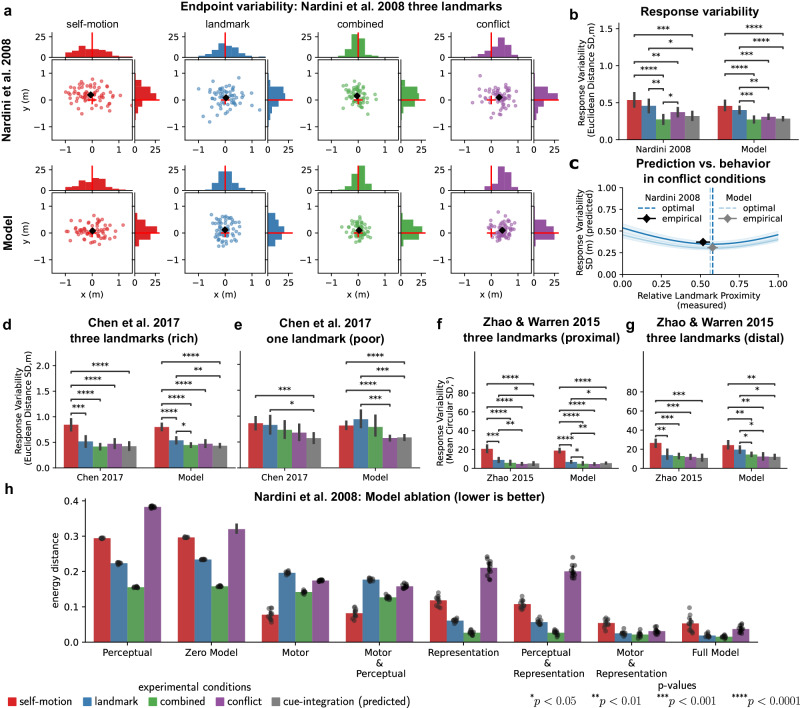
Goal-directed navigation requires continuously integrating uncertain self-motion and landmark cues into an internal sense of location and direction, concurrently planning future paths, and sequentially executing motor actions. Here, we provide a unified account of these processes with a computational model of probabilistic path planning in the framework of optimal feedback control under uncertainty. This model gives rise to diverse human navigational strategies previously believed to be distinct behaviors and predicts quantitatively both the errors and the variability of navigation across numerous experiments. This furthermore explains how sequential egocentric landmark observations form an uncertain allocentric cognitive map, how this internal map is used both in route planning and during execution of movements, and reconciles seemingly contradictory results about cue-integration behavior in navigation. Taken together, the present work provides a parsimonious explanation of how patterns of human goal-directed navigation behavior arise from the continuous and dynamic interactions of spatial uncertainties in perception, cognition, and action.


Conflict of interest statement

The authors declare no competing interests.

Figures

Fig. 1
Fig. 1. Triangle-completion task & cue integration account.
a Schematic of a typical homing task, here triangle completion, within a real or virtual, environment with landmarks in the background and a goal location (shown in red). b Participants walk from a start position through a sequence of three-goal locations (outbound path) before returning to the first goal location (home, shown in red). c Experimental manipulations of internal and external cues at the end of the outbound path for different experimental conditions: Self-motion condition (reduced visual information), landmark condition (reduced direction and position information), combined condition (all cues available), conflict condition (covert rotation of landmarks). Endpoint data from Chen et al.. d Cue integration accounts for endpoint variability in homing task. Response variability is computed as the standard deviation of Euclidean distances, (or heading direction) to mean response locations (or directions) for each condition. Top-Left: Response variability for different cue conditions. Variability in landmark (blue) and self-motion (red) conditions predict reduced variability in combined conditions (green and violet) according to perceptual cue integration models (gray). Top-Right: Biased homing responses in conflict conditions are used to determine how much participants relied on either of the two cues (relative response proximity). Red and blue crosses represent target locations for exclusive reliance on either self-motion or landmarks cues. Bottom: If cues are combined optimally in conflict conditions, response variability is reduced in double cue conditions (combined and conflict) compared to single cue conditions (landmark and self-motion) and the optimal response location is biased toward the more reliable cue. e Walking trajectories of participants from the study of Zhao & Warren compared to simulated participants from our computational model performing the triangle-completion task (Supplementary Movie 2).
Fig. 2
Fig. 2. Diverse navigational strategies dynamically emerge in simulations from the interaction of perceptual and internal model uncertainties during optimal control under uncertainty.
a Participants moving in an environment with landmarks and target locations build up a probabilistic allocentric internal representation by sequentially combining egocentric observations, capturing their uncertain subjective belief regarding their position, heading direction, as well as the expected location of landmarks and goals. b The true state xt which captures participant’s location, heading direction, as well as the location of goals and landmarks, is not directly accessible, hence participants rely on their probabilistic internal representation bt = (μt, Σt), reflecting their subjective spatial uncertainties, which serves as the basis for path planning and is updated by planned motor actions ut (prediction) alongside noisy sensory observations from perception zt (state estimation). c The internal subjective belief facilitates the planning of trajectories towards internally represented goal locations and sequential updating of the participant’s allocentric position within the internal representation (vector-based navigation). A goal is considered to be reached by a participant when the belief about self-location matches the belief of the goal location in the internal representation. d In the absence of landmarks, noisy motor actions increase positional and heading uncertainty tracked by the belief state, which may become increasingly discrepant from the actual state xt (path-integration). e During locomotion towards a visible goal, visual feedback from sensory perception reduces positional errors stemming from noisy motor actions (beaconing). f Initial noisy egocentric observations of objects (distance and bearing) are transformed into an internal allocentric representation taking into account the participant’s positional and observation uncertainties (left: oriented, low uncertainty, right: disoriented, high uncertainty). g The allocentric internal representation, reflects participant’s spatial estimates and uncertainties regarding the location of landmarks and goals in the environment, as well as their own location and heading direction within the environment (cognitive map). h Landmarks in the environment reduce participant’s positional and heading uncertainty and provide orientation (landmark-based navigation). Left: Participant is disoriented, i.e., belief about heading and position is discrepant from true heading and position and highly uncertain. Middle: Landmark observation reduces positional uncertainty allowing participants to re-orient. Right: Movement toward the invisible goal location using landmark observations to correct errors due to noisy motor actions.
Fig. 3
Fig. 3. Noise in perception, representation, and action explains endpoint variability across multiple studies and experimental manipulations.
a Endpoint distributions for all four conditions for (simulated) participants from Nardini et al.. Homogeneity energy test: self-motion (p = 0.296), landmark (p = 1.0), combined (p = 0.196), conflict (p = 0.156). b Analysis of response variability and cue integration for (simulated) participants from Nardini et al. (n = 17). A two-way repeated measures ANOVA testing type (model vs. empirical) and cue condition (self-motion, landmark, combined, conflict) showed a statistically significant effect for condition (F(4, 128) = 25.83, p < 0.0001, η2 = 0.31), but not for type (F(1, 32) = 2.88, p = 0.1, η2 = 0.03), with no significant interaction (F(4, 128) = 0.7, p = 0.6, η2 = 0.01). Post-hoc t-test (two-sided). Error bars represent mean response variability ± 1 SD. c Model predictions vs. actual behavior in conflict conditions for (simulated) participants from Nardini et al.. Error bars indicate relative landmark proximity (x-direction) and response variability (y-direction) with ± 1 SEM. d, e Analysis of response variability across cue conditions for (simulated) participants from Chen et al. (n = 18). In the three-landmark environment, statistically significant main effects were found for cue condition (F(4, 136) = 75.22, p < 0.0001, η2 = 0.48), but not for type (F(1, 34) = 0.01, p = 0.94, η2 = 0.0), with no significant interaction (F(4, 136) = 0.59, p = 0.67, η2 = 0.004). In the single landmark environment, the main effects were statistically significant for cue condition (F(4, 136) = 12.36, p < 0.0001, η2 = 0.139) without significant effects for type (F(1, 34) = 0.01, p = 0.94, η2 = 0.0) or their interaction (F(4, 136) = 1.28, p = 0.28, η2 = 0.014). Post-hoc t-test (two-sided). Error bars represent mean response variability ± 1 SD. f, g Response variability across cue conditions for (simulated) participants from Zhao & Warren. In the proximal landmark environment (n = 6), statistically significant main effects for cue condition were observed (F(4, 40) = 81.91, p < 0.0001, η2 = 0.86), with no significant effects for type (F(1, 10) = 3.23, p = 0.1, η2 = 0.006) or their interaction (F(4, 40) = 0.59, p = 0.67, η2 = 0.01). In the distal landmark environment (n = 5), there was a significant main effect for cue condition (F(4, 32) = 31.37, p < 0.0001, η2 = 0.636), but not for type (F(1, 8) = 0.59, p = 0.46, η2 = 0.011) or their interaction (F(4, 32) = 2.05, p = 0.11, η2 = 0.042). Post-hoc t-test (two-sided). Error bars represent mean response variability ± 1 SD. h Impact of perceptual, representational, and motor variability on endpoint distributions in the homing task from Nardini et al.. Energy distances were calculated between empirical and simulated data (n = 10) for each condition (Supplementary Fig. 4). Error bars indicate mean energy distance ± 1 SD. Source data are provided as a Source Data file.
Fig. 4
Fig. 4. Optimal sequential actions under perceptual, representational, and motor uncertainties predict seemingly sub-optimal cue-integration behavior in conflict conditions.
a Mean responses for conflict conditions for participants from Chen et al. (left) vs. simulated participants from our computational model (right) for an environment with three landmarks (top) and one landmark (bottom). b Optimal vs. empirical cue weights for participants from Chen et al. (left) vs. simulated participants from our computational model (right). Dots indicate individual (simulated) participants. Optimal cue weights were computed based on observed response variability in single cue conditions, whereas empirical cue weights were computed based on response proximity to either cue location in conflict conditions. Linear regression lines were fitted to (simulated) participants' cue weights for the two environments separately. c The reliance on landmark cues during homing is explained by the integration of egocentric landmark observations with subjective internal beliefs (see Supplementary Movie 4). Initially (t = 0), participants hold beliefs about their own location and that of landmarks. At t = 1, landmarks are covertly rotated, but participants' beliefs about their expected positions remain unchanged. By t = 10, participants turn around, encountering increased uncertainty in heading due to landmark rotation. The sight of landmarks recalibrates their internal heading estimate since they expect landmarks straight ahead, reducing uncertainty in position and heading. From t = 10 to t = 65, during homing, participants utilize their internal beliefs for path planning, employing landmarks to correct motor errors. This reduces positional uncertainty and variability in endpoints, though homing responses are biased. d Response bias in conflict conditions for (simulated) participants from Zhao & Warren. Two-sided paired t-tests for angles 15°, 30°, 45°, and 90° with p-values for the proximal environment (n = 5) of 0.33, 0.93, 0.96, and 0.001, and for the distal environment (n = 6) of 0.06, 0.57, 0.71, and 0.25. Error bars show mean homing direction ± 1 SD. e Response variability in conflict conditions for (simulated) participants from Zhao & Warren. Two-sided paired t-tests for angles 15°, 30°, 45°, and 90° with p-values of 0.85, 0.72, 0.46, 0.02 for the proximal environment (n = 5) and 0.85, 0.77, 0.41, 0.53 for the distal environment (n = 6). Error bars show mean homing variability ± 1 SD. Endpoint distributions are shown in Supplementary Fig. 14. Source data are provided as a Source Data file.

References

    1. Gallistel, C. R. The Organization of Learning. (The MIT Press, 1990).
    1. Wolbers T, Hegarty M. What determines our navigational abilities? Trends Cogn. Sci. 2010;14:138–146. doi: 10.1016/j.tics.2010.01.001. - DOI - PubMed
    1. Loomis JM, et al. Nonvisual navigation by blind and sighted: Assessment of path integration ability. J. Exp. Psychol. Gen. 1993;122:73–91. doi: 10.1037/0096-3445.122.1.73. - DOI - PubMed
    1. Stangl M, Kanitscheider I, Riemer M, Fiete I, Wolbers T. Sources of path integration error in young and aging humans. Nat. Commun. 2020;11:2626. doi: 10.1038/s41467-020-15805-9. - DOI - PMC - PubMed
    1. Mallot HA, Lancier S. Place recognition from distant landmarks: human performance and maximum likelihood model. Biol. Cybern. 2018;112:291–303. doi: 10.1007/s00422-018-0751-4. - DOI - PubMed

LinkOut - more resources