. 2024 Jul 7;15(1):5691.
doi: 10.1038/s41467-024-49371-1.

The human VGLUT3-pT8I mutation elicits uneven striatal DA signaling, food or drug maladaptive consumption in male mice

Affiliations

The human VGLUT3-pT8I mutation elicits uneven striatal DA signaling, food or drug maladaptive consumption in male mice

Mathieu Favier et al. Nat Commun. .

Abstract

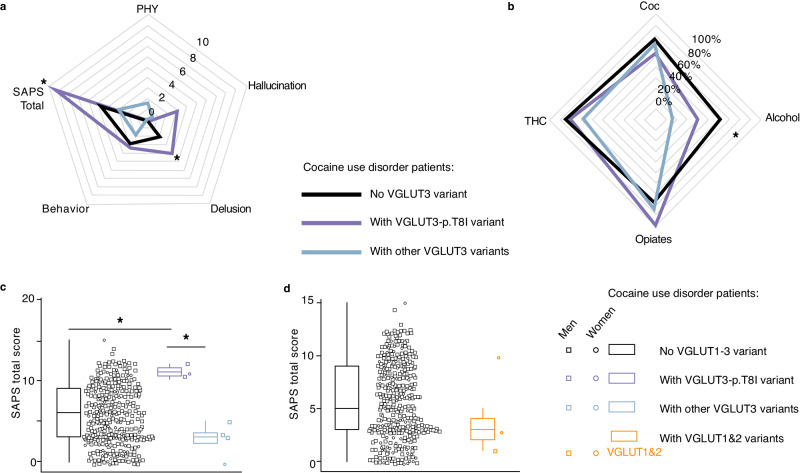
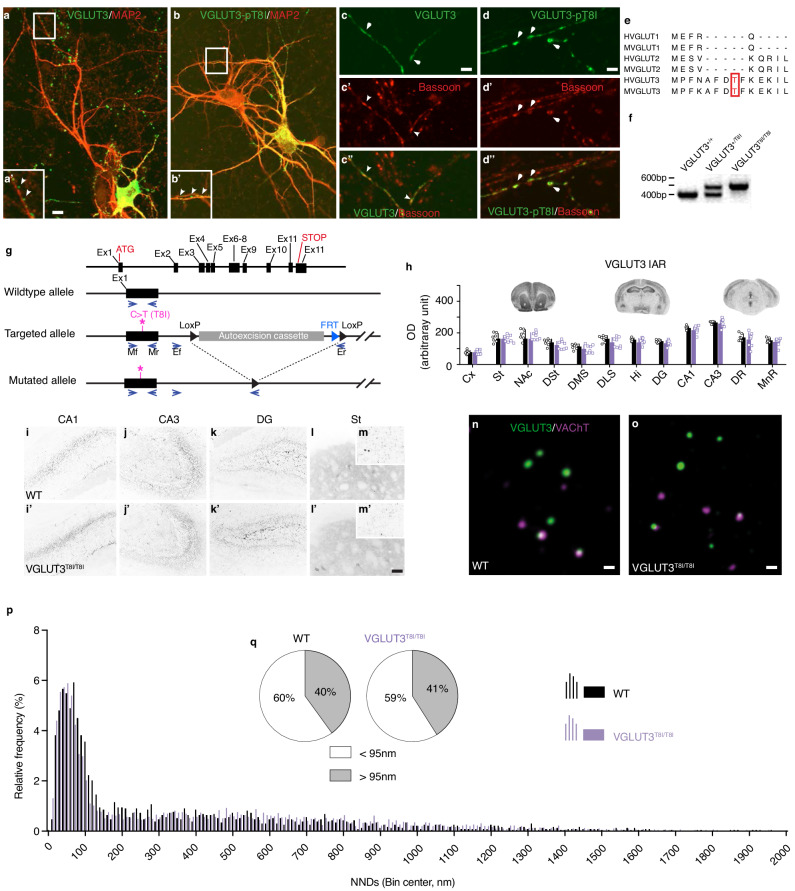
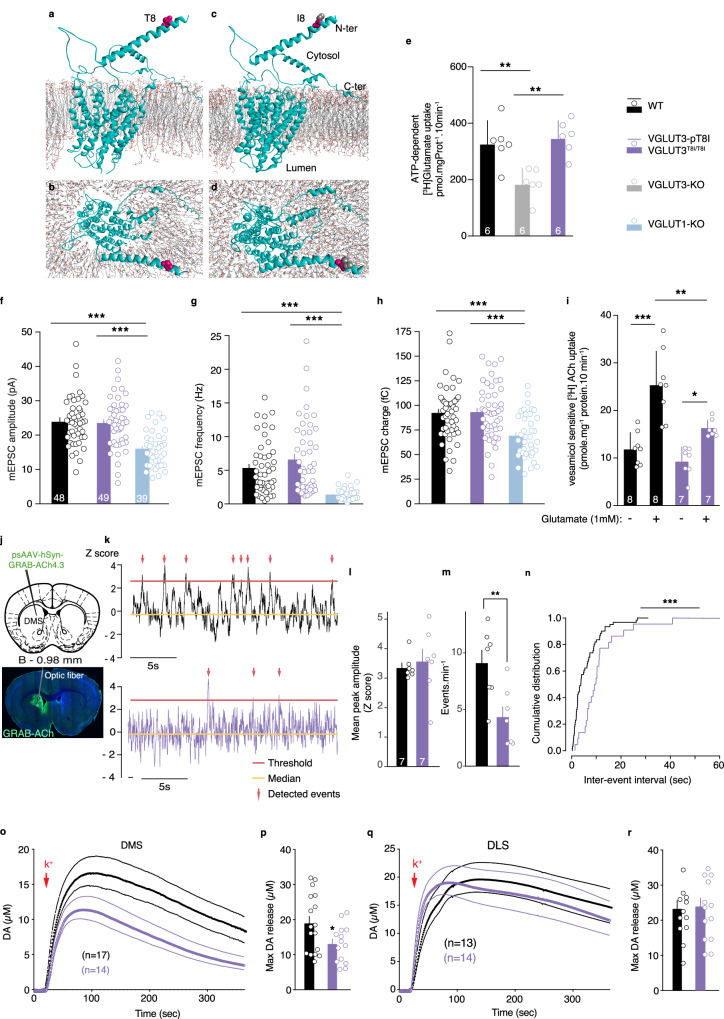
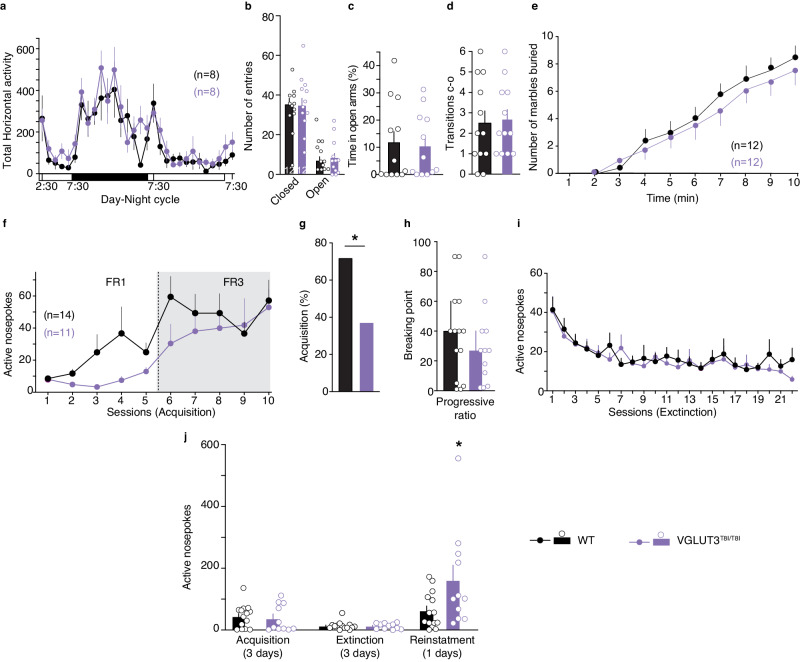
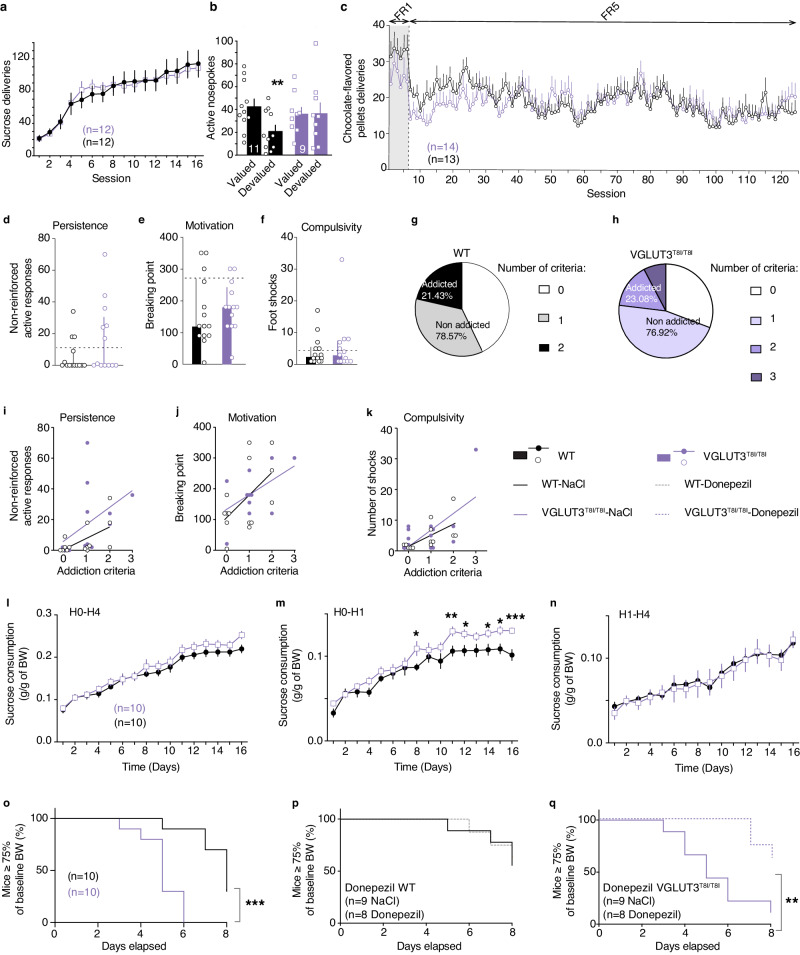
Cholinergic striatal interneurons (ChIs) express the vesicular glutamate transporter 3 (VGLUT3) which allows them to regulate the striatal network with glutamate and acetylcholine (ACh). In addition, VGLUT3-dependent glutamate increases ACh vesicular stores through vesicular synergy. A missense polymorphism, VGLUT3-p.T8I, was identified in patients with substance use disorders (SUDs) and eating disorders (EDs). A mouse line was generated to understand the neurochemical and behavioral impact of the p.T8I variant. In VGLUT3T8I/T8I male mice, glutamate signaling was unchanged but vesicular synergy and ACh release were blunted. Mutant male mice exhibited a reduced DA release in the dorsomedial striatum but not in the dorsolateral striatum, facilitating habit formation and exacerbating maladaptive use of drug or food. Increasing ACh tone with donepezil reversed the self-starvation phenotype observed in VGLUT3T8I/T8I male mice. Our study suggests that unbalanced dopaminergic transmission in the dorsal striatum could be a common mechanism between SUDs and EDs.


Conflict of interest statement

The authors declare no competing interests.

Figures

Fig. 1
Fig. 1. Patients carrying the VGLUT3-p.T8I variant show increased clinical severity of cocaine use disorders.
Scores at the scale for the assessment of psychotic symptoms (SAPS). Total score is the sum of the delusion, hallucination, physical symptoms during cocaine craving (PHY) and behavioral subscales. Uncorrected p-values are shown. VGLUT1 gene, SLC17A7; VGLUT2 gene, SLC17A6; VGLUT3 gene, SLC17A8. a, SAPS scores as a function of p.T8I vs other VGLUT3 variant vs. no VGLUT3 mutation in patients with cocaine use disorder (Kruskal-Wallis chi-squared=8.16, df=2, two-sided, p = 0.0169 for total score and Kruskal-Wallis chi-squared=8.16, df=2, p = 0.035 for delusion subscale). N = 338 biologically independent samples. b, Frequency of substance use disorders (SUDs) (Coc, CUD; alcohol; opioids; cannabis, THC) as a function of p.T8I vs other VGLUT3 mutations vs no VGLUT3 mutation in the whole SUDs sample. The presence of p.T8I was not associated with increased prevalence of CUD but with decreased prevalence of alcohol use disorders (two-sided Fisher exact test, p = 0.03034). N = 338 biologically independent samples. c, SAPS total score as a function of VGLUT3 variants (none vs. p.T8I vs. others) in patients with CUD score significantly differed across the three genotypes groups (Kruskal-Wallis p = 0.0169). p.T8I carriers had significantly higher SAPS score compared to patients without VGLUT3 mutation (two-sided Wilcoxon test, p = 0.018), to those with other VGLUT3 mutations (two-sided Wilcoxon test, p = 0.018) and to those without any VGLUT mutation (two-sided Wilcoxon test, p = 0.048). N = 363 biologically independent samples. d, Total score at the SAPS as a function of VGLUT1 or VGLUT2 vs no VGLUT gene variants in CUD patients (two-sided Wilcoxon test =210, p = 0.92). N = 363 biologically independent samples. Source data are provided as a Source Data file. Boxplots are defined as follows (R program defaults), where IQR stands for interquartile range [Q3 (75th percentile value) - Q1 (25th percentile value)]: lower whisker = max(min(x), Q1 − 1.5 * IQR), lower bound of box =25th percentile, center of box =median, upper bound of box =75th percentile, upper whisker =min(max(x), Q3 + 1.5 * IQR). Lack of association with SAPS - delusion not shown for VGLUT3 and VGLUT1-2 variants (see Supplementary Fig. 1b).
Fig. 2
Fig. 2. The p.T8I variant does not alter the anatomical distribution of VGLUT3.
a-d, Immunofluorescent detection of VGLUT3 (a, a’, c, c’, c”) or VGLUT3-p.T8I (b, b’, d, d’, d”) (green) and microtubule-associated protein (MAP2, a, a’, b, b’) or bassoon (c’, c”, d’, d”) (red) in hippocampal neuronal culture of WT mice. e, Alignment of human (H) or mouse (M) VGLUT1, VGLUT2 and VGLUT3 amino acid sequences. f, Genotyping of WT (VGLUT3+/+) mice, heterozygous mice (VGLUT3+/T8I) or homozygous mice (VGLUT3T8I/T8I). g, Schematic representation of the targeting strategy and genotyping strategy of mouse VGLUT3 by PCR. Mice were genotyped with primers (arrows) flanking exon 1 (mf, mr, ex1), in intron 1 (ef) and in the LoxP sites in 3’ of the autoexcision cassette (er). Asterisks represent the targeted site in exon 1. h, Top: Immunoautoradiographic (IAR) regional distribution of VGLUT3 and VGLUT3-p.T8I on coronal sections from the brain of WT mice (black, n = 7 mice) and VGLUT3T8I/T8I mice (purple, n = 8 mice). Bottom: Densitometric quantification of VGLUT3 and VGLUT3-p.T8I on mouse brain sections. Data are presented as mean values ± SEM. Statistical analysis performed with two-sided unpaired t-test. i-m’, Immunofluorescent detection of VGLUT3 (i-m) or VGLUT3-p.T8I (i’-m’) in the hippocampus and in the striatum of WT mice or VGLUT3T8I/T8I mice. n-o, Immunofluorescent detection with STED microscopy of VGLUT3 or VGLUT3-p.T8I (purple) and VAChT (green) in preparations of striatal synaptic vesicles. p, Automatic batch analysis of nearest neighbor distances (NNDs) between VGLUT3- or VGLUT3-p.T8I- and VAChT-immunofluorescent spots on striatal isolated synaptic vesicles. Statistical analysis two-sided Kolmogorov-Smirnov test, p = 0.218. q, Percentage of VGLUT3 or VGLUT3-p.T8I immunofluorescent spots displaying a NND with their closest VAChT-positive spot above and below 95 nm (p = 0.439, two-sided Chi-squared test). Source data are provided as a Source Data file. Abbreviations: CA1-3, fields of the hippocampus pyramidal layer; Cx, cortex; DG, dentate gyrus; DMS, dorsomedial striatum; DLS, dorsolateral striatum; DR, dorsal raphe nucleus; st, striatum; DSt, dorsal striatum; Hi, hippocampus; IAR, immunoautoradiography; MnR, median raphe nucleus; NAc, nucleus accumbens. Bar: 10 µm in a and b, 5 µm in a’ and b’, 2 µm in c-d”, 10 µm in i-l’, 0.1 µm in n and o.
Fig. 3
Fig. 3. The VGLUT3-p.T8I variant does not affect vesicular accumulation and release of glutamate but impairs ACh and DA signaling in the dorsal striatum.
a, Three-dimensional model of side and top view of VGLUT3 (a,b) and VGLUT3-p.T8I (c,d). e, Glutamate vesicular uptake in striatal vesicles from WT mice, VGLUT3T8I/T8I mice or VGLUT3-KO mice (for each genotype, n = 6 independent determinations). **p = 0.005 for WT mice vs VGLUT3-KO mice and **p = 0.002 WT mice vs VGLUT3T8I/T8I mice, one-way ANOVA, Tukey’s test post hoc analysis. f-h, Electrophysiological recordings of VGLUT1-KO autaptic neurons expressing VGLUT3 (WT) or VGLUT3-p.T8I. Plots of mean amplitude (f) frequency (g) or charge (h) of responses of autaptic neurons. ***p < 0.001 WT mice (n = 48 independent autapses recording) vs VGLUT3T8I/T8I mice (n = 49 independent autapses recording) vs VGLUT1-KO mice (n = 39 independent autapses recording), Kruskal-Wallis test; Dunn’s test post hoc analysis VGLUT3T8i/T8i mice vs VGLUT1-KO mice and WT mice vs VGLUT1-KO mice. i, Vesicular acetylcholine uptake measured in striatal synaptic vesicles, in absence (-) or presence (+) of glutamate (1 mM). ***p < 0.001 WT mice / Glu- vs WT mice / Glu + ; *p = 0.044 VGLUT3T8I/T8I mice / Glu- vs VGLUT3T8I/T8I mice / Glu + ; **p = 0.003 WT mice / Glu+ vs VGLUT3T8I/T8I mice / Glu + , (two-way ANOVA, Bonferroni’s test post hoc analysis) (Glu- n = 8 independent determinations, Glu + = n = 7 independent determinations). j, AAV-mediated delivery of GRAB-ACh4.3 sensor in DMS. k, Examples of fiber photometry recording (ΔF/F) for WT mice (black) or VGLUT3T8I/T8I mice (purple). l, m Mean peak amplitude and frequency of spontaneous ACh events (n = 7 WT mice and n = 7 VGLUT3T8I/T8I mice). **p = 0.009 (two-sided unpaired t-test) and Wilcoxon rank sum test with continuity correction (non-paired), W = 43.5, p = 0.017. n, Cumulative distribution of inter-event intervals. **p = 0.001 (two-sided Kolmogorov-Smirnov test). o-r, In vivo voltammetry of DA K+-evoked release in DMS (o) or DLS (q) of WT mice (black) and VGLUT3T8i/T8i mice (purple). (o) Genotype, F1,29 = 5.63, p = 0.024; time, F2.499, 72.46 = 39.76, p < 0.001; genotype x time, F399, 11571 = 1.84 p < 0.001 (two-way RM ANOVA, Bonferroni’s test post hoc analysis). Maximum level of DA release in DMS (p, n = 17 WT mice and n = 14 VGLUT3T8i/T8i mice), or DLS (r, n = 13 WT mice and n = 14 VGLUT3T8I/T8I mice). (p) *p = 0.03 (two-sided unpaired t-test). Data are presented as mean values ± SEM in e, f-i, l, m, p, r. Source data are provided as a Source Data file. Bar: 1000 µm in j.
Fig. 4
Fig. 4. VGLUT3T8I/T8I mice exhibit normal locomotor activity and anxiety phenotype but show increased vulnerability to cue-induced reinstatement of cocaine seeking compared to controls.
a, Horizontal locomotor activity of WT mice (black) or VGLUT3T8I/T8I mice (purple) measured during a complete day-night cycle (p = 0.776, two-way RM ANOVA). b-d, Elevated plus maze (n = 12 WT mice and n = 12 VGLUT3T8I/T8I mice). b, Number of entries in closed or open arms c, Time spent in open arms versus closed arms (%). d, Number of transitions from closed (c) to open (o) arms. e, Marble-burying test. Statistical analyses were performed with two-way RM ANOVA and post hoc comparison with Bonferroni’s test (a,e) and two-sided unpaired t-test (b-d). f-j, Cocaine (0.5 mg.kg−1 per infusion, iv) self-administration in WT mice (black, n = 14 mice) or VGLUT3T8I/T8I mice (purple, n = 11 mice). f, Number of active nosepokes during the acquisition (fixed ratio 1 (FR1) and 3 (FR3)) of self-administration. genotype x time F9,207 = 0.972, p = 0.464, two-way RM ANOVA. g, Percentage of mice reaching the criteria for operant conditioning learning. * p = 0.010 (two-sided chi-squared test). h, Motivation for cocaine measured by the breaking point achieved in the progressive ratio schedule of reinforcement (two-sided unpaired t-test, p = 0.60). i, Number of active nosepokes during extinction procedure (genotype x time, F21,483 = 0.7128, p = 0.8215, two-way RM ANOVA). j, Cue-induced reinstatement with the mean number of active nosepokes during the different experimental phases: acquisition of cocaine self-administration behavior (mean of 3 days acquisition criteria), extinction (mean of 3 days extinction criterion) and reinstatement induced by cues. Number of active nosepokes during cue-induced reinstatement test (two-sided unpaired t-test, * p = 0.041). Data are presented as mean values ± SEM in a-j. Source data are provided as a Source Data file.
Fig. 5
Fig. 5. VGLUT3T8I/T8I mice are more prone to habit formation and display an increased vulnerability to develop maladaptive eating compared to WT mice.
a, Number of sucrose pellets deliveries for VGLUT3T8I/T8I mice (purple) versus controls (black) during FR1 training (genotype, F1,22 = 0.0001, p = 0.992; time F3.064,67.41 = 54.11, p < 0.001; genotype x time F15,330 = 0.548, p = 0.912; two-way RM ANOVA and post hoc comparison with the method of contrasts). b, WT mice/valued vs WT mice/devalued **p = 0.001, two-sided paired t-test (n = 11 mice). VGLUT3T8i/T8i mice/valued vs VGLUT3T8i/T8i mice/devalued p = 0.945, two-sided paired t-test (n = 9 mice). c, Number of chocolate-flavored pellets deliveries during FR1 and FR5 training (genotype F1,25 = 0.059, p = 0.811; time F9.073,223.9 = 5.468, p < 0.001; genotype x time F123,3036 = 1.43, p = 0.002; Mixed effect model (REML)). d, Persistence to response (p = 0.113, two-sided unpaired t-test). e, Motivation (p = 0.677, unpaired t-test). f, Compulsivity (p = 0.597, two-sided unpaired t-test). Percentage of WT mice (g) and VGLUT3T8I/T8I mice (h) categorized as addicted or non-addicted (p = 0.918, Chi-squared test). i-k, Pearson correlations between individual values of addiction-like criteria and persistence to response (WT mice r2 = 0.334, p = 0.031; VGLUTT8I/T8I mice r2 = 0.2, p = 0.126) (i), motivation (WT mice r2 = 0.295, p = 0.045; VGLUTT8I/T8i mice r2 = 0.305, p = 0.051) (j) and compulsivity (WT mice r2 = 0.414, p = 0.013; VGLUTT8I/T8i mice r2 = 0.405, p = 0.011) (k). l-n, Sucrose binge-like overconsumption test (n = 10 WT mice and n = 10 mice for VGLUT3T8I/T8I mice). Daily sucrose consumption during 4 h (H0-H4) (genotype F1,18 = 0.96, p = 0.34; time F15,270 = 164.8, p < 0.001; genotype x time F15,270 = 1.432, p = 0.132, Two-way RM ANOVA) (l), First hour (H0-H1) (genotype F1,18 = 3.692, p = 0.071; time F5.587,100.6 = 119.5, p = <0.001; genotype x time F15,270 = 3.066, p < 0.001, Two-way RM ANOVA) (m) or last 3 h (H1-H4) (genotype F1,18 = 0.027, p = 0.872; time F15,270 = 42.37, p < 0.001; genotype x time F15,270 = 3.066, p < 0.001) (n) of access to sucrose solution. o-q, ABA model (n = 10 WT mice and n = 10 VGLUT3T8I/T8I mice). o, Survival curve (Log-rank (Mantel-Cox) post hoc comparison p < 0.001, Gehan-Breslow-Wilcoxon post hoc comparison p < 0.001, Kaplan-Meier test). p-q Effect of chronic donepezil (0.3 mg.kg−1) treatment on survival curves (Log-rank (Mantel-Cox) post hoc comparison p = 0.819, Gehan-Breslow-Wilcoxon post hoc comparison p = 0.83, Kaplan-Meier test) (p) or VGLUT3T8I/T8I mice (Log-rank (Mantel-Cox) post hoc comparison p = 0.006, Gehan-Breslow-Wilcoxon post hoc comparison p = 0.004, Kaplan-Meier test) (q). Data are presented as mean values ± SEM in a-f, i-n. Source data are provided as a Source Data file.

References

    1. Coniglio KA, et al. Won’t stop or can’t stop? Food restriction as a habitual behavior among individuals with anorexia nervosa or atypical anorexia nervosa. Eat Behav. 2017;26:144–147. doi: 10.1016/j.eatbeh.2017.03.005. - DOI - PubMed
    1. Everitt BJ, Robbins TW. Neural systems of reinforcement for drug addiction: from actions to habits to compulsion. Nat Neurosci. 2005;8:1481–1489. doi: 10.1038/nn1579. - DOI - PubMed
    1. Horstmann A, et al. Slave to habit? Obesity is associated with decreased behavioural sensitivity to reward devaluation. Appetite. 2015;87:175–183. doi: 10.1016/j.appet.2014.12.212. - DOI - PubMed
    1. Uniacke B, Timothy Walsh B, Foerde K, Steinglass J. The Role of Habits in Anorexia Nervosa: Where We Are and Where to Go From Here? Curr Psychiatry Rep. 2018;20:61. doi: 10.1007/s11920-018-0928-5. - DOI - PMC - PubMed
    1. Belin D, Belin-Rauscent A, Murray JE, Everitt BJ. Addiction: failure of control over maladaptive incentive habits. Curr Opin Neurobiol. 2013;23:564–572. doi: 10.1016/j.conb.2013.01.025. - DOI - PubMed

MeSH terms

LinkOut - more resources