. 2024 Jul 6;15(1):5667.
doi: 10.1038/s41467-024-49888-5.

Using real-time modelling to inform the 2017 Ebola outbreak response in DR Congo

Affiliations

Using real-time modelling to inform the 2017 Ebola outbreak response in DR Congo

R Thompson et al. Nat Commun. .

Abstract

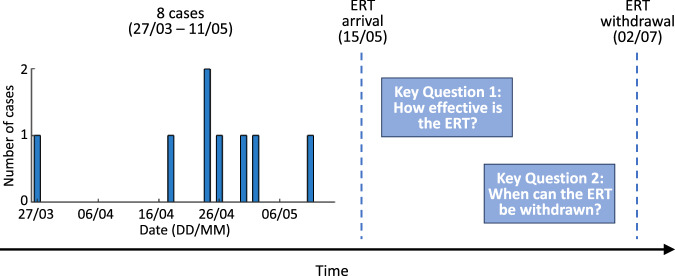
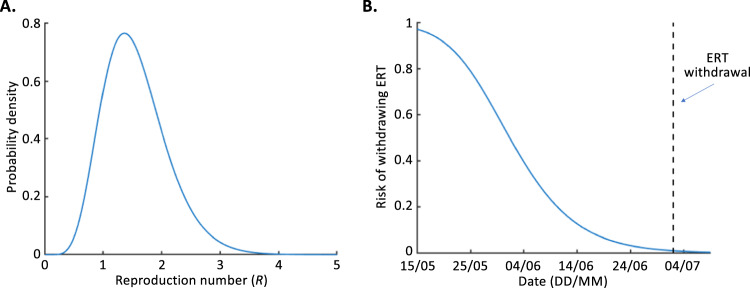
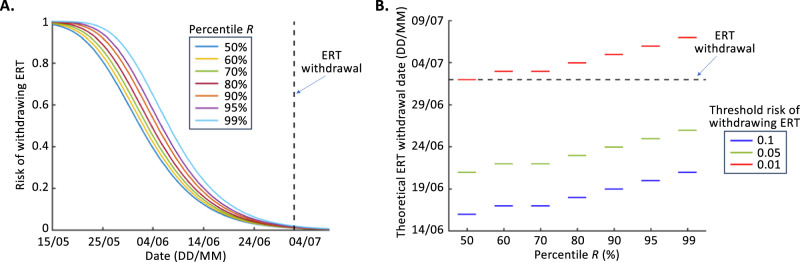
Important policy questions during infections disease outbreaks include: i) How effective are particular interventions?; ii) When can resource-intensive interventions be removed? We used mathematical modelling to address these questions during the 2017 Ebola outbreak in Likati Health Zone, Democratic Republic of the Congo (DRC). Eight cases occurred before 15 May 2017, when the Ebola Response Team (ERT; co-ordinated by the World Health Organisation and DRC Ministry of Health) was deployed to reduce transmission. We used a branching process model to estimate that, pre-ERT arrival, the reproduction number was R = 1.49 (95% credible interval ( 0.67, 2.81 ) ). The risk of further cases occurring without the ERT was estimated to be 0.97 (97%). However, no cases materialised, suggesting that the ERT's measures were effective. We also estimated the risk of withdrawing the ERT in real-time. By the actual ERT withdrawal date (2 July 2017), the risk of future cases without the ERT was only 0.01, indicating that the ERT withdrawal decision was safe. We evaluated the sensitivity of our results to the estimated R value and considered different criteria for determining the ERT withdrawal date. This research provides an extensible modelling framework that can be used to guide decisions about when to relax interventions during future outbreaks.


Conflict of interest statement

The authors declare no competing interests.

Figures

Fig. 1
Fig. 1. Schematic illustrating the key questions that mathematical modelling was used to address during the 2017 EVD outbreak in Likati Health Zone, DRC.
Following eight EVD cases occurring between 27 March and 11 May 2017, the ERT was deployed on 15 May 2017. Mathematical modelling was used to assess: (i) The effectiveness of the ERT at reducing transmission (Key Question 1), and; (ii) The risk of withdrawing the ERT, quantified in terms of the probability that further cases would occur if the ERT was withdrawn (Key Question 2; this quantity was evaluated every day until the ERT was withdrawn on 2 July 2017). In this figure, and in all subsequent figures in the main text, dates are expressed in DD/MM format (all in 2017).
Fig. 2
Fig. 2. Assessing the effectiveness of the ERT and the risk of withdrawing the ERT.
A The estimated value of R prior to the arrival of the ERT (calculated using Eq. (3)). B The risk of withdrawing the ERT (blue, calculated each day using Eq. (5); i.e., the probability of future cases occurring if the ERT is withdrawn on each date on the x-axis, based on the distributional estimate of R in panel A) and the actual date of withdrawal of the ERT (black dashed). In panel B, the first date shown is the ERT deployment date (15 May 2017).
Fig. 3
Fig. 3. Determining when to withdraw the ERT for different assumed values of R and different risk tolerance levels.
A The risk of withdrawing the ERT each day (Eq. (4)) for different percentile values of the distributional estimate of R (see Fig. 2A) and the actual date of withdrawal of the ERT (black dashed). B The date on which the ERT could theoretically have been withdrawn, if the ERT was withdrawn as soon as the risk of withdrawing the ERT fell below different threshold values (0.1—blue; 0.05—green; 0.01—red). A threshold value of 0.01 corresponds to (at most) a 1% chance of cases arising following ERT withdrawal. Results are shown for different percentile values from the distributional estimate of R (see Fig. 2A). In both panels, the percentile R values shown correspond to: 50% – R=1.49; 60% – R=1.63; 70% – R=1.79; 80% – R=1.99; 90% – R=2.29; 95% – R=2.56; 99% – R=3.11.

Similar articles

Cited by

References

    1. WHO Ebola Response Team. Ebola virus disease in West Africa—the first 9 months of the epidemic and forward projections. N. Engl. J. Med.371, 1481–1495 (2014). - PMC - PubMed
    1. Lindblade KA, et al. Decreased Ebola transmission after rapid response to outbreaks in remote areas, Liberia, 2014. Emerg. Infect. Dis. 2015;21:1800–1807. doi: 10.3201/eid2110.150912. - DOI - PMC - PubMed
    1. Chretien J-P, Riley S, George DB. Mathematical modeling of the West Africa Ebola epidemic. eLife. 2015;4:e09186. doi: 10.7554/eLife.09186. - DOI - PMC - PubMed
    1. Polonsky, J. et al. Outbreak analytics: a developing data science for informing the response to emerging pathogens. Philos. Trans. R. Soc. B374, 20180276 (2019). - PMC - PubMed
    1. Heesterbeek H, et al. Modeling infectious disease dynamics in the complex landscape of global health. Science. 2015;347:aaa4339. doi: 10.1126/science.aaa4339. - DOI - PMC - PubMed

MeSH terms