. 2024 Jul 6;15(1):201.
doi: 10.1186/s13287-024-03816-y.

Decoding cellular plasticity and niche regulation of limbal stem cells during corneal wound healing

Affiliations

Decoding cellular plasticity and niche regulation of limbal stem cells during corneal wound healing

Di Sun et al. Stem Cell Res Ther. .

Abstract

Background: Dysfunction or deficiency of corneal epithelium results in vision impairment or blindness in severe cases. The rapid and effective regeneration of corneal epithelial cells relies on the limbal stem cells (LSCs). However, the molecular and functional responses of LSCs and their niche cells to injury remain elusive.

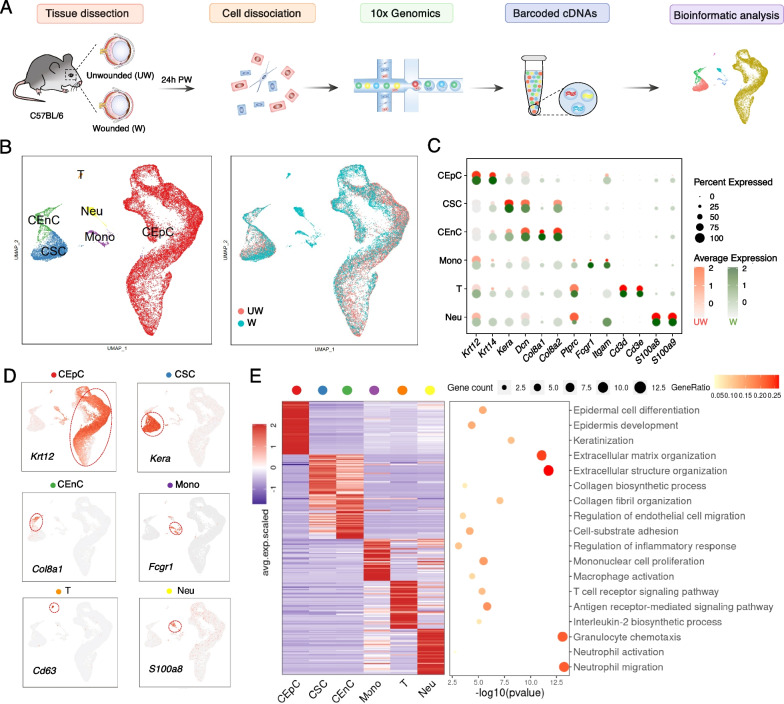
Methods: Single-cell RNA sequencing was performed on corneal tissues from normal mice and corneal epithelium defect models. Bioinformatics analysis was performed to confirm the distinct characteristics and cell fates of LSCs. Knockdown of Creb5 and OSM treatment experiment were performed to determine their roles of in corneal epithelial wound healing.

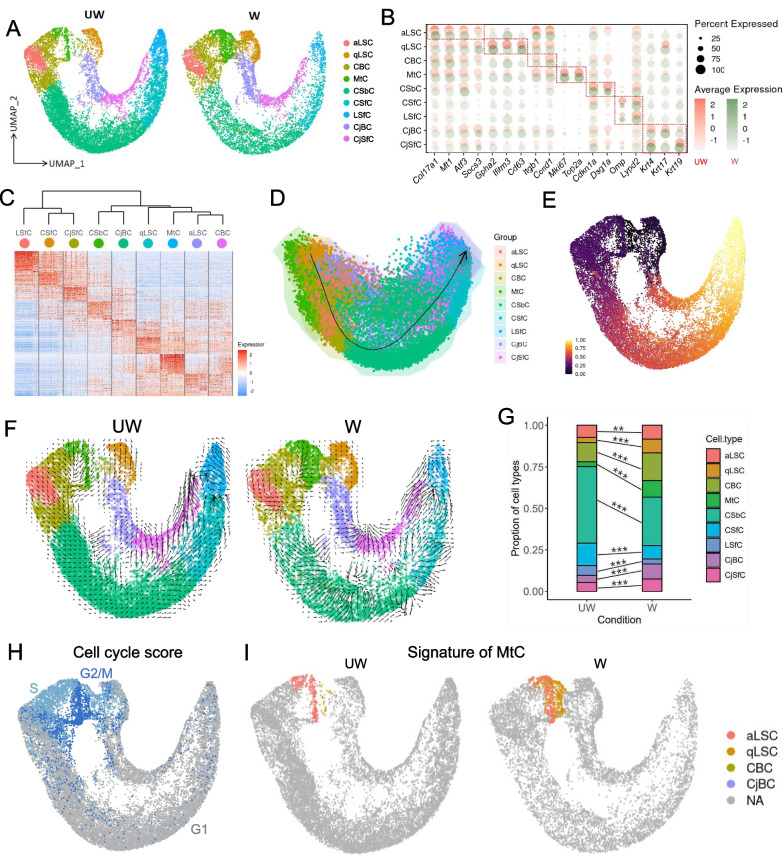
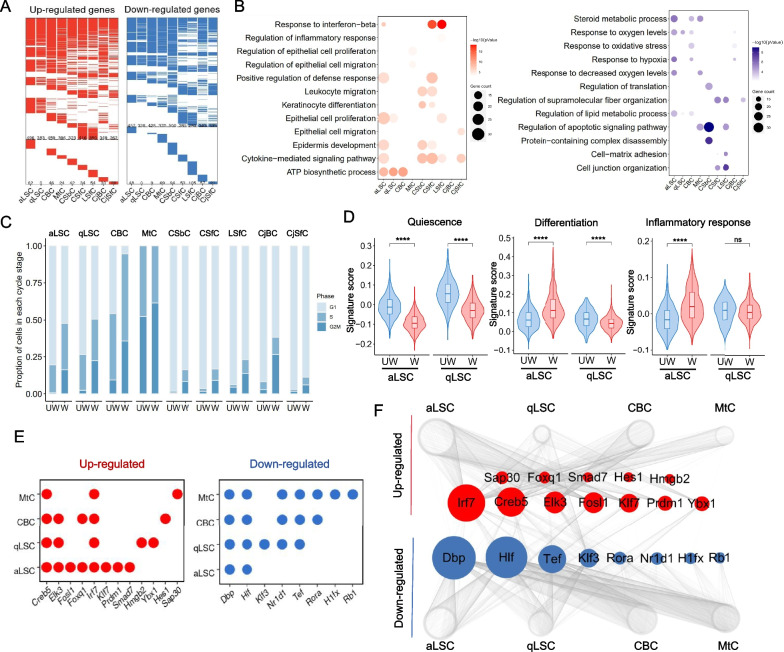
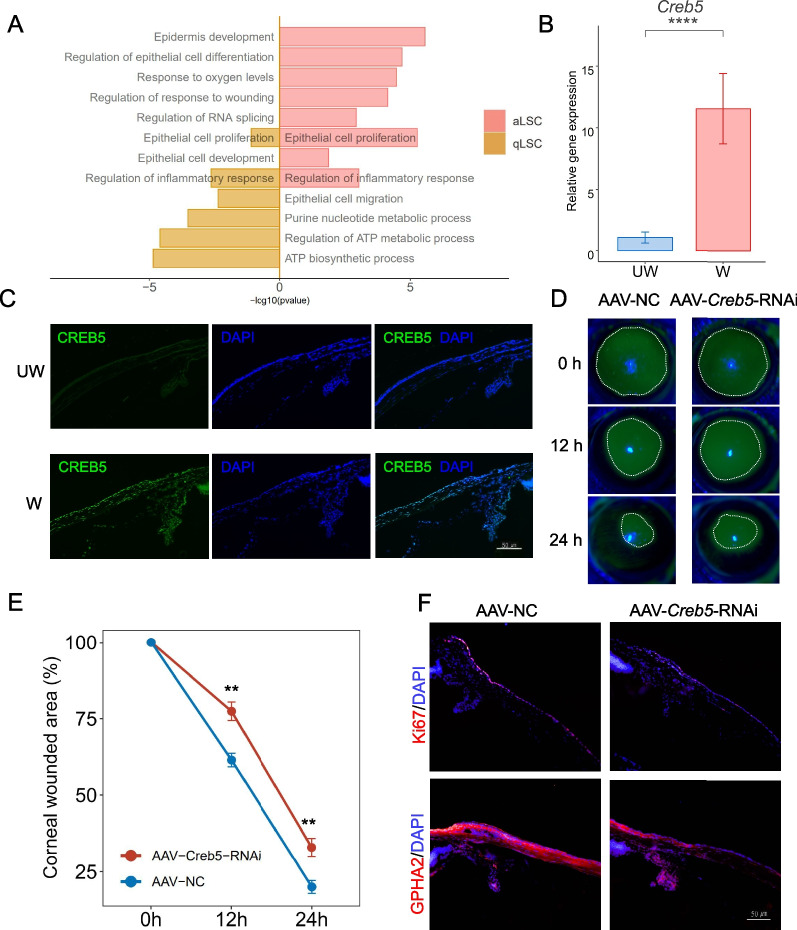
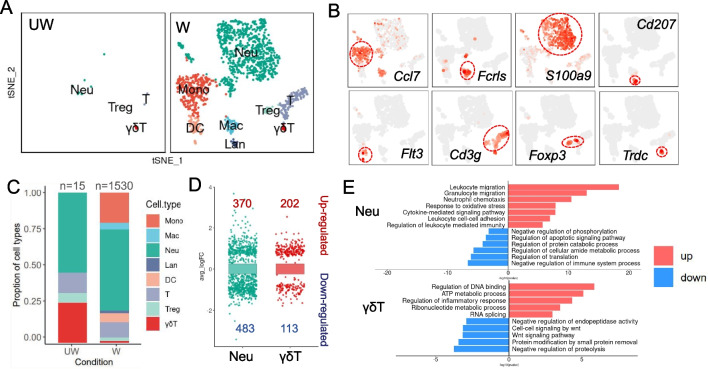
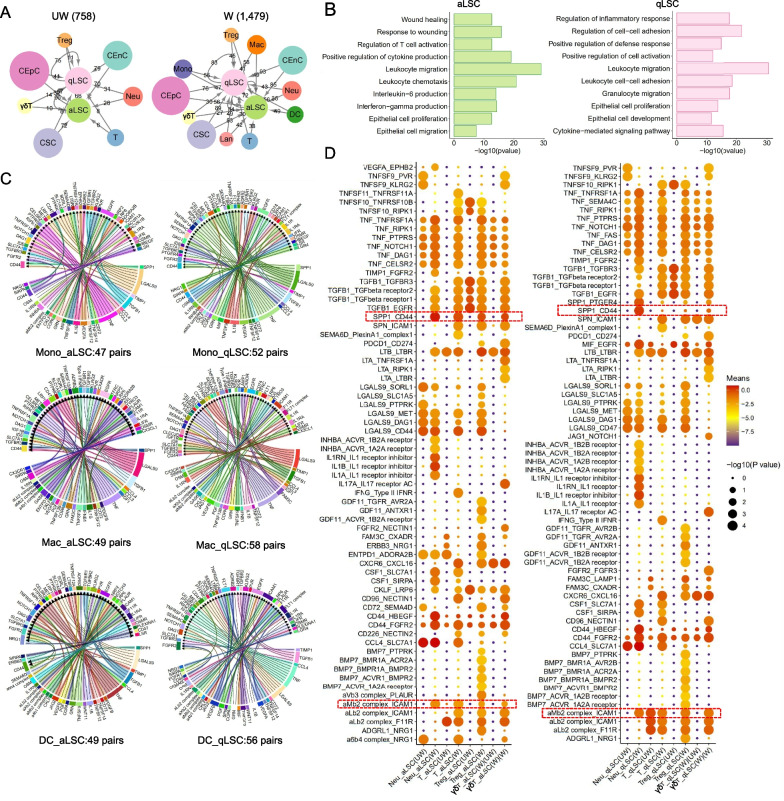
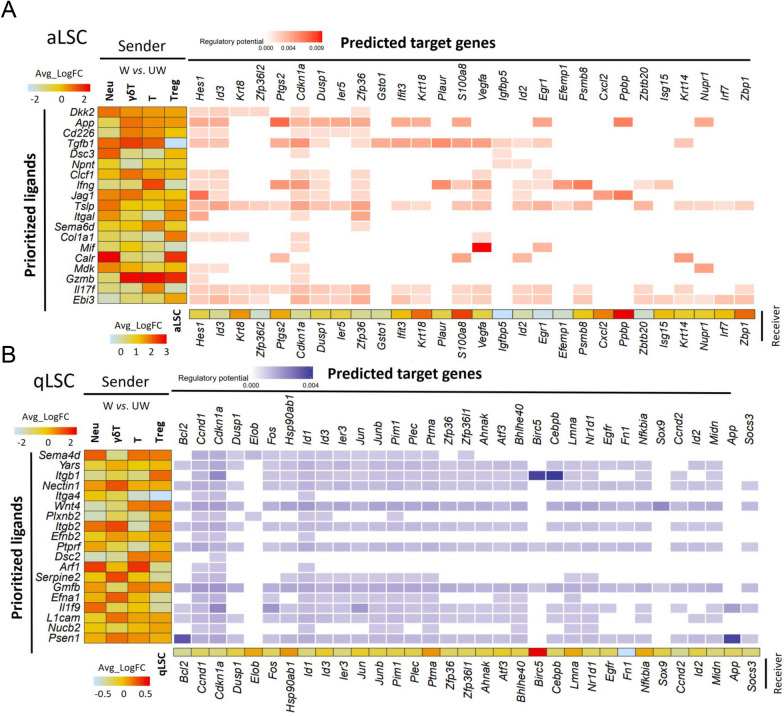
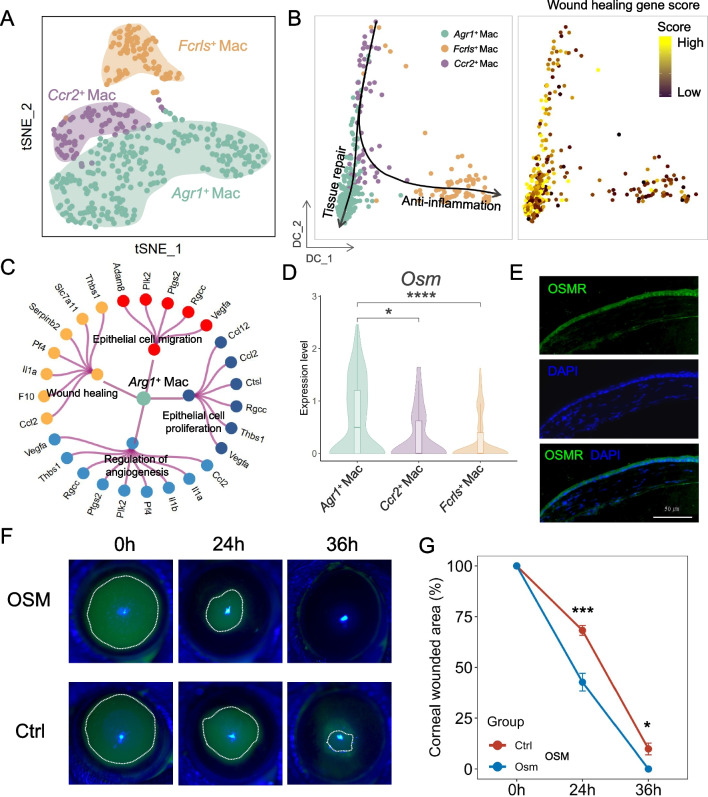
Results: Our data defined the molecular signatures of LSCs and reconstructed the pseudotime trajectory of corneal epithelial cells. Gene network analyses characterized transcriptional landmarks that potentially regulate LSC dynamics, and identified a transcription factor Creb5, that was expressed in LSCs and significantly upregulated after injury. Loss-of-function experiments revealed that silencing Creb5 delayed the corneal epithelial healing and LSC mobilization. Through cell-cell communication analysis, we identified 609 candidate regeneration-associated ligand-receptor interaction pairs between LSCs and distinct niche cells, and discovered a unique subset of Arg1+ macrophages infiltrated after injury, which were present as the source of Oncostatin M (OSM), an IL-6 family cytokine, that were demonstrated to effectively accelerate the corneal epithelial wound healing.

Conclusions: This research provides a valuable single-cell resource and reference for the discovery of mechanisms and potential clinical interventions aimed at ocular surface reconstruction.

Keywords: Cornea; Corneal epithelium; Limbal stem cells; Niche regulation; Single-cell RNA sequencing.


Conflict of interest statement

The authors declare no competing interests.

Figures

Fig. 1
Fig. 1
Cell types in mouse cornea identified by scRNA-seq analysis. A Flowchart overview of the scRNA-seq of unwounded and wounded mouse cornea. B UMAP plots showing cells colored by cell types (left) and groups (right). Abbreviations: CEpC, corneal epithelial cell; CSC, corneal stromal cell; CEnC, corneal endothelial cell; Mono, monocyte lineage; T, T cell; Neu, neutrophil; UW, un-wounded; W, wounded. C Dot plot showing high expression of classical marker genes for each cell type in two groups. Dots in red means UW and green means W. The color key from light to dark indicates low to high gene expression levels, and the dot size positively correlates with the percentage of cells positive for a given marker in a given type of cells. D Feature plots showing expression of classical genes for each cell types. The color key from light to dark red indicates gene expression levels. E Expression (left) and enriched GO terms (right) for top DEGs in each cell type. Each row represents one gene expression and each column represents one cell type, the value of each gene is row-scaled Z score
Fig.2
Fig.2
The heterogeneity and behaviors of corneal epithelial subtypes. A UMAP plots showing nine subtypes of corneal epithelial cells from UW and W groups. aLSC, active limbal stem cell; qLSC, quiescent limbal stem cell; CBC, corneal basal cell; MtC, mitotic cell; CSbC, corneal suprabasal cell; CSfC, corneal superficial cell; LSfC, limbal superficial cell; CjBC, conjunctival basal cell; CjSfC, conjunctival superficial cell. B Dot plot showing high expression of classical marker genes for each subtype in UW and W groups. C Heatmap showing the top DEGs of each corneal epithelial subtype. D Differentiation pseudotime trajectory of corneal epithelial subtypes calculated using SCORPIUS. E Projection of corneal epithelial cells pseudotemporal ordering analysis onto the UMAP space in Fig.S3A. Pseudotime order from black purple to bright yellow. F RNA velocity maps projecting onto the UMAP space in A. G Barplot showing the changes of corneal epithelial subtypes proportion between UW and W groups. The difference between the two groups was determined by chi-square test. **p < 0.01. ***p < 0.001. H Cell cycle score analysis revealed the signature of cells captured in specific stages of mitosis. I Cell type classification for MtCs shows that they consist of a mixture of cells with a hallmark of aLSCs, qLSCs and basal cells
Fig.3
Fig.3
Alterations and differences in transcriptional profiles of nine subpopulations of corneal epithelial cells during wound healing. A Heatmaps showing the up-regulated (red, left) and down-regulated (blue, right) DEGs in nine subtypes of corneal epithelial cells between W and UW groups. Color white represents genes without differential expression. The number of DEGs are indicated on the maps. The part above the dotted line indicates DEGs are shared by at least two cell subtypes, and the part below the dotted line indicates DEGs are unique to each cell subtype. B Dot plots showing the representative GO terms of up-regulated (red) and down-regulated (blue) DEGs in each corneal epithelial cell type. C Barplot showing the proportion of each subpopulation of corneal epithelial cells at the cell cycle stage in both UW and W groups. D Gene signature scoring analysis across aLSC and qLSC in both UW and W groups using quiescence, differentiation and inflammatory response related genes. ****P < 0.0001 (two-sided Wilcoxon rank-sum test). E Dot plots showing up-regulated (red) and down-regulated (blue) core regulatory TFs of aLSC, qLSC, CBC and MtC. F Visualized network showing up-regulated (red) and down-regulated (blue) core regulatory TFs of aLSC, qLSC, CBC and MtC. The size of nodes is positively correlated with the number of edges
Fig.4
Fig.4
Knockdown of Creb5 in mouse corneal epithelium. A Barplot showing the representative GO terms of Creb5-target genes of aLSC and qLSC. B Barplot showing the expression of Creb5 in UW and W mice corneal epithelium quantified by RT-qPCR. ****P < 0.0001, t test. C Immunofluorescence staining showing the expression of CREB5 in UW and W mice healing corneal limbus. D Fluorescent dye staining showing the wound healing at 0, 12 and 24 h after corneal epithelial debridement in mice injected with AAV-NC and AAV-Creb5-RNAi. E Line chart showing the rate of epithelial healing in AAV-NC and AAV-Creb5-RNAi. **P < 0.01, t test. F Immunofluorescence staining showing the expression of Ki67, GPHA2 in mice injected with AAV-NC and AAV-Creb5-RNAi healing corneal limbus
Fig.5
Fig.5
Immune cells in mice cornea during wound healing. A The t-distributed stochastic neighbor embedding (t-SNE) plots showing immune cells from UW and W groups. Mono, mononuclear cell; Mac, macrophage; Neu, neutrophil; Lan, Langerhans cell; DC, dendritic cell; Treg, regulatory T cell; γδT, γδT cell. B Feature plots showing expression of classical marker genes for immune cells. The color red indicates high gene expression levels. C Barplot showing the proportional changes of immune cells between UW and W groups. D Differential gene expression analysis showing up- and down-regulated genes in Neu and γδT in W group. E Barplots showing the representative GO terms of up-regulated (red) and down-regulated (blue) DEGs in Neu and γδT
Fig.6
Fig.6
Changes in cell–cell communications between LSCs and immune cells during wound healing. A Visualized networks showing the number of regulatory effects of other corneal cells on LSCs in UW (left) and W (right) groups. Node size represents the number of ligand-receptor pairs. B Barplots showing the representative GO terms of target genes of increased Immune-LSC pairs. C Chord plots showing cellular interactions between Mono/Macs/DCs and aLSCs (up)/qLSCs (down), separately. The cell types and interaction pairs number are labeled. D Dot plots showing the ligand-receptor interactions associated with aLSCs (left)/qLSCs (right) in W group compared to that in UW group. aLSCs/qLSCs express receptors and receive ligand signals from Neus, T, Tregs and γδTs. Rows represent ligand-receptor pairs, and columns represent interactions between cells. The samples of UW or W are labeled in parentheses. The P value and means are calculated by the CellphoneDB analysis. Deep color represents high means, large circle represents high P value
Fig.7
Fig.7
NicheNet analysis between increased immune cells and LSCs during cornea wound healing. A NicheNet analysis showing the interaction between Neus/T/Tregs/γδTs and aLSCs. Middle, heatmap predicting ligand-target regulatory potential. Left, heatmap predicting the average log2FC of the top ligands’ expression between UW and W groups for Neus/T/Tregs/γδTs. Bottom, heatmap predicting the average log2FC of ligand-matched targets expression between UW and W groups for aLSCs. B NicheNet analysis showing the interaction between Neus/T/Tregs/γδTs and qLSCs. Middle, heatmap predicting ligand-target regulatory potential. Left, heatmap predicting the average log2FC of the top ligands’ expression between UW and W groups for Neus/T/Tregs/γδTs. Bottom, heatmap predicting the average log2FC of ligand-matched targets expression between UW and W groups for qLSCs
Fig.8
Fig.8
The burst of Arg1+ Macs during corneal wound healing. A t-SNE plot showing the distribution of three subpopulaitons of Monos and Macs. B Diffusion map showing the distribution of Macs subpopulations (left) and the scores of wound healing-related genes (right). C Network showing the enriched GO terms of Arg1+ Mac marker genes. D Violin plot showing the expression levels of Osm in Macs subpopulations. *P < 0.05, ****P < 0.0001, t test. E Immunofluorescence staining showing the expression of OSMR in corneal limbus. F Fluorescent dye staining showing the wound healing at 0, 24 and 36 h after corneal epithelial debridement in mice injected with Ctrl and Osm. G Line chart showing the rate of epithelial healing in Ctrl and Osm. *P < 0.05, ***P < 0.001, t test

Similar articles

Cited by

References

    1. Kumar A, Yun H, Funderburgh ML, Du Y Regenerative therapy for the Cornea. Prog Retin Eye Res. 2022;87:101011. doi: 10.1016/j.preteyeres.2021.101011. - DOI - PMC - PubMed
    1. Masterton S, Ahearne M. Mechanobiology of the corneal epithelium. Exp Eye Res. 2018;177:122–129. doi: 10.1016/j.exer.2018.08.001. - DOI - PMC - PubMed
    1. Eghrari AO, Riazuddin SA, Gottsch JD. Overview of the cornea: structure, function, and development. Prog Mol Biol Transl Sci. 2015;134:7–23. doi: 10.1016/bs.pmbts.2015.04.001. - DOI - PubMed
    1. Catala P, Groen N, Dehnen JA, Soares E, van Velthoven AJH, Nuijts R, et al. Single cell transcriptomics reveals the heterogeneity of the human cornea to identify novel markers of the limbus and stroma. Sci Rep. 2021;11:21727. doi: 10.1038/s41598-021-01015-w. - DOI - PMC - PubMed
    1. Bonnet C, Gonzalez S, Roberts JS, Robertson SYT, Ruiz M, Zheng J, et al. Human limbal epithelial stem cell regulation, bioengineering and function. Prog Retin Eye Res. 2021;85:100956. doi: 10.1016/j.preteyeres.2021.100956. - DOI - PMC - PubMed

Publication types