. 2024 Jul 6;14(1):15613.
doi: 10.1038/s41598-024-66519-7.

Tumor biomechanics as a novel imaging biomarker to assess response to immunotherapy in a murine glioma model

Affiliations

Tumor biomechanics as a novel imaging biomarker to assess response to immunotherapy in a murine glioma model

Yannik Streibel et al. Sci Rep. .

Abstract

Glioblastoma is the most common and aggressive primary malignant brain tumor with poor prognosis. Novel immunotherapeutic approaches are currently under investigation. Even though magnetic resonance imaging (MRI) is the most important imaging tool for treatment monitoring, response assessment is often hampered by therapy-related tissue changes. As tumor and therapy-associated tissue reactions differ structurally, we hypothesize that biomechanics could be a pertinent imaging proxy for differentiation. Longitudinal MRI and magnetic resonance elastography (MRE) were performed to monitor response to immunotherapy with a toll-like receptor 7/8 agonist in orthotopic syngeneic experimental glioma. Imaging results were correlated to histology and light sheet microscopy data. Here, we identify MRE as a promising non-invasive imaging method for immunotherapy-monitoring by quantifying changes in response-related tumor mechanics. Specifically, we show that a relative softening of treated compared to untreated tumors is linked to the inflammatory processes following therapy-induced re-education of tumor-associated myeloid cells. Mechanistically, combined effects of myeloid influx and inflammation including extracellular matrix degradation following immunotherapy form the basis of treated tumors being softer than untreated glioma. This is a very early indicator of therapy response outperforming established imaging metrics such as tumor volume. The overall anti-tumor inflammatory processes likely have similar effects on human brain tissue biomechanics, making MRE a promising tool for gauging response to immunotherapy in glioma patients early, thereby strongly impacting patient pathway.

Keywords: Glioma; Immunotherapy; MR elastography; Tissue biomechanics; Tumor stiffness.


Conflict of interest statement

The authors declare no competing interests.

Figures

Figure 1
Figure 1
CDNP-R848 treatment leads to tumor regression. The study design is shown in (A). Consecutive axial T2w MRI images that show the Gl261 glioma of a CDNP vehicle control (B, left) and a CDNP-R848 treated animal (B, right) are provided. Of note, MR images are not displayed in radiologic convention to match the LSM and histology data presented in this manuscript (i.e., the right hemisphere is on the right side of the image). Gl261 glioma can be identified as heterogeneously T2w-hyperintense mass in the right striatum. Progressive increase in glioma volume is already visually perceptible in the vehicle control on the left. In contrast, immunotherapy led to tumor regression as visible on the right. This visual perception was confirmed when assessing tumor response according to the iRANO criteria (C). Glioma progressed in all CDNP vehicle controls (PD = %VolumeMRIweek4–MRIweek2 ≥ 40%; C, left), while the majority of CDNP-R848 treated mice presented either with partial response (PR = %VolumeMRIweek4–MRIweek2 ≤ − 65%) or stable disease (SD = %VolumeMRIweek4–MRIweek2 > − 65% and < 40%; C, right). Week-wise comparison of mean tumor volumes (D) shows a significant and progressive increase in CDNP vehicle controls (dark red bars, dots and brackets). The temporal evolution of tumor volumes per individual animal are displayed in (E). In CDNP-R848 treated animals, tumor volume plateaued when comparing weeks 2 and 3 and then significantly decreased (light red bars, dots and brackets). Tumor volume of both groups only differed significantly in week 4 (black line). Asterisks indicate level of significance based on adjusted p-values derived from a mixed-effects analyses followed by Šídák’s or Tukey’s multiple comparisons test, respectively.
Figure 2
Figure 2
Diffusion and biomechanical properties of Gl261 glioma are different from healthy brain tissue. Mean values of ADC, FA, stiffness |G*| and phase angle Y in Gl261 glioma (dots and unfilled bars) were compared to mean values in the contralateral normal appearing brain tissue (squares and striped bars) of animals receiving the CDNP vehicle (top row, dark colors) or the CDNP-R848 immunotherapy (bottom row, light colors). Asterisks indicate level of significance based on adjusted p-values derived from paired t-tests corrected for multiple testing and from a mixed-effects analysis followed by Tukey’s multiple comparisons test, respectively.
Figure 3
Figure 3
Tumor stiffness early differentiates treated animals and controls and outperforms MRI metrics. (A) shows the evolution of ADC in animals receiving the CDNP vehicle and the CDNP-R848 immunotherapy, respectively. ADC progressively increases in CDNP vehicle controls (B, dark purple dots, bars and brackets), while in CDNP-R848 treated animals ADC only increased from week 2 to week 3 and stabilized thereafter (B, light purple dots, bars and brackets). Mean ADC values did not differ between groups. Exemplary images demonstrating the evolution of FA in the same animals are shown in (C). The comparison of mean FA in the glioma of both groups (D) revealed an initial increase in FA in CDNP vehicle controls (dark green dots, bars and brackets). CDNP-R848 immunotherapy led to a decrease in FA, which was reversible in week 4 (light green dots, bars and brackets). Mean FA values of both groups differed in week 3 (black line). Elastograms of tumor stiffness |G*| for these animals are shown in (E). Mean glioma stiffness did not change over time, but dynamic changes can be appreciated in individual animals (F). When comparing both groups, CDNP-R848 treated glioma were softer than tumors in vehicle controls (black lines) in the therapeutic effector phase in week 3 as well as in the clearing phase in week 4. Exemplary elastograms of the phase angle Y are provided in (G). Mean tumor phase angle did not change over time and was similar in both groups (H). ROC analyses were performed separately for the effector phase (I) and the clearing phase (J). Gl261 glioma are encircled in pink on all maps. Asterisks indicate level of significance based on adjusted p-values derived from a mixed-effects analyses followed by Šídák's or Tukey’s multiple comparisons test, respectively.
Figure 4
Figure 4
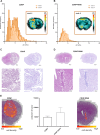
Gl261 glioma exhibit biomechanical heterogeneity reflecting histological composition. Elastograms displaying cerebral stiffness of CDNP vehicle controls and CDNP-R848 treated animals were visually different. This notion is reflected in histograms displaying the frequency distribution of |G*| within the tumors (A, B). Visual inspection of H&E- and Alcian blue-stained slides (C, D) revealed that the biomechanical appearance of untreated and treated Gl261 gliomas was reflected in their histological composition. The H&E-stain of animals receiving the CDNP vehicle only showed areas with increased cell density distributed in the tumor area (C, left; color-coded cell density map E, left). These regions alternated with patchy accumulation of glycosaminoglycans and mucopolysaccharides stained blue in the Alcian blue-staining (C, right). In CDNP-R848 treated gliomas cell density was homogeneously increased in the tumor area (D, left; color-coded cell density map E, right). Similarly, glycosaminoglycan and mucopolysaccharide content in the tumor was increased compared to the healthy surrounding tissue and evenly distributed within the entire tumor region (D, right). The boxes in the upper rows of (C) and (D) mark the areas that are magnified in the respective bottom rows. We additionally quantified the cell density in the tumor area on representative H&E-stained slides (E). There was a trend toward a higher cell density per mm2 of the tumor area in CDNP-R848 treated animals.
Figure 5
Figure 5
MRE captures effects of CDNP-R848 induced anti-tumor inflammation. To further characterize the mechanism underlying the differences in tumor stiffness between CDNP-R848 treated animals and those that received the CDNP-vehicle only, elastograms and LSM-data were comparatively analyzed (A). To determine whether tumor stiffness is influenced by the presence of TAMs and their effects on the tissue, iba1-stained LSM data and |G*|-elastograms were semi-quantitatively compared. For this, |G*|-elastograms and iba1-stained LSM-data were co-registered to the respective T2w 3D images of each animal (B). Tumors were segmented on T2w images (B, top row). The tumor label was applied to elastograms, which were used to semi-automatically segment glioma subregions with lower, similar, and higher stiffness than healthy brain parenchyma (B, second row). These labels were applied to AHE-filtered iba1-stained LSM data and iba1-positive cells were segmented in glioma subregions (B, third row). Finally, the percentage of areas containing iba1-positive cells with regard to the entire tumor area was compared between soft, intermediate and stiff glioma subregions (B, bottom row; C). Tumor areas with obvious tissue damage, i.e. cracks, holes or missing tissue, were excluded from this analysis. Asterisks indicate level of significance based on adjusted p-values derived from a two-way ANOVA followed by Šídák’s and Tukey’s multiple comparisons test, respectively.
Figure 6
Figure 6
Graphical summary of findings. Immunotherapy with CDNP-R848 re-educates myeloid cells towards a pro-inflammatory phenotype. The following inflammatory processes globally affect the tumor microstructure, which leads to significant differences in diffusion properties (FA) and in biomechanics between untreated and treated gliomas well before changes in tumor volume are evident. Ultimately, this specific treatment causes regression of GL261-glioma. This is reflected in significantly smaller and softer tumors in treated animals, while diffusion properties did not differ between treated and untreated glioma after completion of therapy. This figure was created with www.biorender.com.

Similar articles

Cited by

References

    1. Platten M, Reardon DA. Concepts for immunotherapies in gliomas. Semin. Neurol. 2018;38:62–72. doi: 10.1055/s-0037-1620274. - DOI - PubMed
    1. Chuntova, P. et al. Unique challenges for glioblastoma immunotherapy—Discussions across neuro-oncology and non-neuro-oncology experts in cancer immunology. Meeting Report from the 2019 SNO Immuno-Oncology Think Tank. Neuro-Oncol.23, 356–375 (2020). - PMC - PubMed
    1. Franson, A. et al. Development of immunotherapy for high-grade gliomas: Overcoming the immunosuppressive tumor microenvironment. Front. Med.9, (2022). - PMC - PubMed
    1. Turco V, et al. T cell-independent eradication of experimental glioma by intravenous TLR7/8-agonist-loaded nanoparticles. Nat. Commun. 2023;14:771. doi: 10.1038/s41467-023-36321-6. - DOI - PMC - PubMed
    1. Ellingson BM, Chung C, Pope WB, Boxerman JL, Kaufmann TJ. Pseudoprogression, radionecrosis, inflammation or true tumor progression? Challenges associated with glioblastoma response assessment in an evolving therapeutic landscape. J. Neurooncol. 2017;134:495–504. doi: 10.1007/s11060-017-2375-2. - DOI - PMC - PubMed

Substances