Review
. 2024 Jul 6;15(1):169.
doi: 10.1186/s13244-024-01754-0.

How to update esophageal masses imaging using literature review (MRI and CT features)

Affiliations
Review

How to update esophageal masses imaging using literature review (MRI and CT features)

Jinrong Qu et al. Insights Imaging. .

Abstract

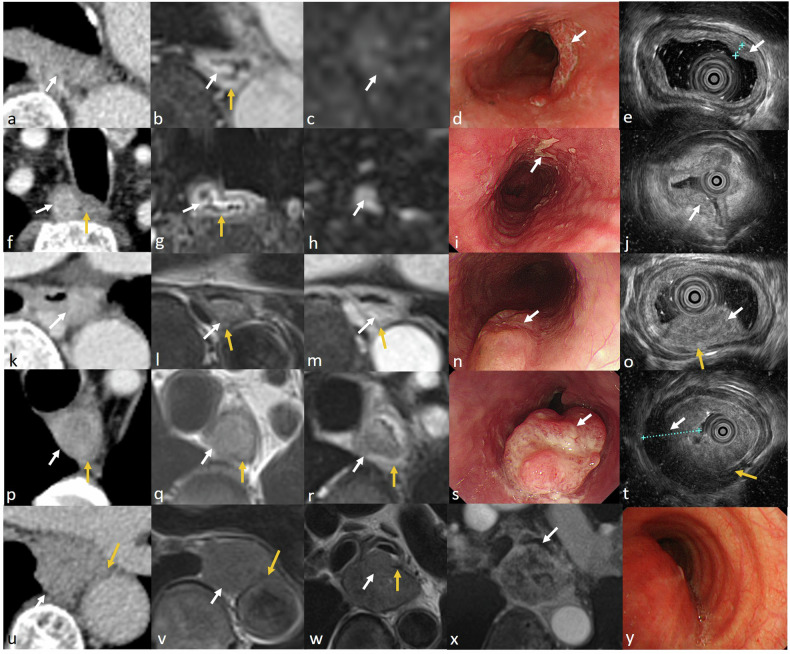
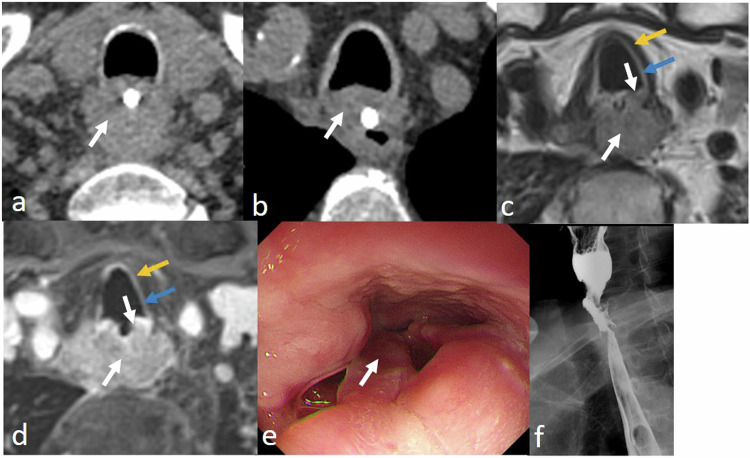
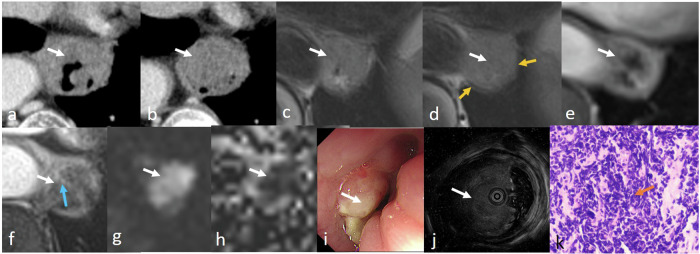
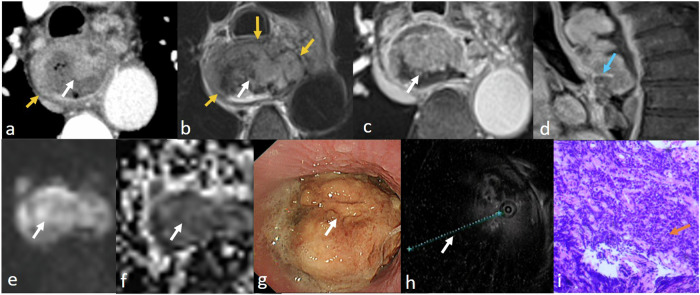
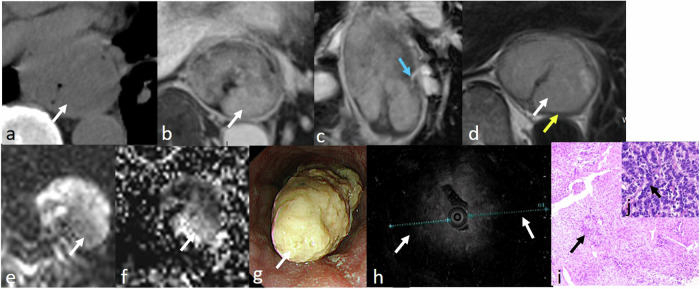
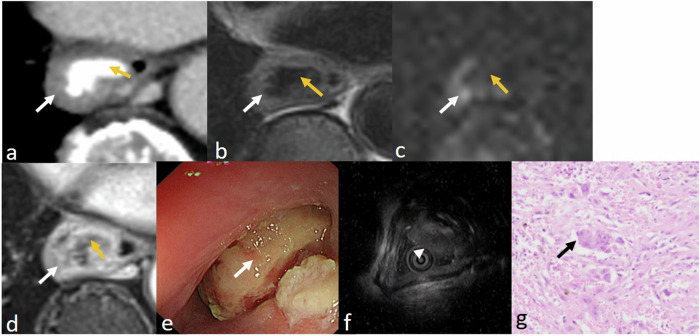
MRI offers new opportunities for detailed visualization of the different layers of the esophageal wall, as well as early detection and accurate characterization of esophageal lesions. Staging of esophageal tumors including extramural extent of disease, and status of the adjacent organ can also be performed by MRI with higher accuracy compared to other imaging modalities including CT and esophageal endoscopy. Although MDCT appears to be the primary imaging modality that is indicated for preoperative staging of esophageal cancer to assess tumor resectability, MDCT is considered less accurate in T staging. This review aims to update radiologists about emerging imaging techniques and the imaging features of various esophageal masses, emphasizing the imaging features that differentiate between esophageal masses, demonstrating the critical role of MRI in esophageal masses. CRITICAL RELEVANCE STATEMENT: MRI features may help differentiate mucosal high-grade neoplasia from early invasive squamous cell cancer of the esophagus, also esophageal GISTs from leiomyomas, and esophageal malignant melanoma has typical MR features. KEY POINTS: MRI can accurately visualize different layers of the esophagus potentially has a role in T staging. MR may accurately delineate esophageal fistulae, especially small mediastinal fistulae. MRI features of various esophageal masses are helpful in the differentiation.

Keywords: Computed tomography; Esophageal neoplasms; Magnetic resonance imaging.


Conflict of interest statement

S.Y.W. is an employee of MR Scientific Marketing, Siemens Healthineers. The remaining authors of this manuscript declare no relationships with any companies, whose products or services may be related to the subject matter of the article.

Figures

Fig. 1
Fig. 1
Stage T1-4 esophageal cancer on MR imaging. Stage T1a (ae), it is difficult to detect the lesion on contrast-enhanced CT image (a). The lesion shows an intensely enhancing homogenous pedunculated mass (white arrow), with a degree of enhancement similar to that of the mucosa (yellow arrow) after contrast injection on T1-weighted image (b) and no restricted diffusion (c). Stage T1b (fj), the lesion shows heterogeneously enhancing mass (white arrow) on contrast-enhanced CT image (f), similar to normal mucosa (yellow arrow), tumor blurs intensely enhanced mucosa after contrast injection on T1-weighted image (g) and has restricted diffusion (h). Stage T2 (ko), it is difficult to detect the lesion on contrast-enhanced CT image (k). The tumor (white arrow) invades muscularis propria (yellow arrow), which is blurred on the T2-weighted image (l) and on the contrast-enhanced T1-weighted image (m). Stage T3 (pt), the lesion (white arrow) appears to invade muscularis propria (yellow arrow) on contrast-enhanced CT image (p), however, the tumor involves muscularis propria and invades adjacent fat and fibrosis tissue. The muscularis propria is interrupted on the T2-weighted image (q) and on the contrast-enhanced T1-weighted image (r). Stage T4 (ux) in two cases, the tumor (white arrow) appears to invade the aorta (yellow arrow) on contrast-enhanced CT image (u). The tumor invades the aorta on the T2-weighted image (v). The hypointense adventitia of the left principal bronchus (yellow arrow) is interrupted on the T2-weighted image (w) and on the contrast-enhanced T1-weighted image (x). The lesion is shown in the oesophagoscope (d, I, n, and s) and endoscopic ultrasonography (e, j, o, and d). The bronchoscope(y) shows the lesion invades the outer membrane of the left principal bronchus, while the inner membrane is intact
Fig. 2
Fig. 2
Esophageal fistula in a 62-year-old man. A tumor (white arrow) is poorly defined on CT and tracheal involvement is not confirmed (a, b). MRI clearly delineates that the tumor invades the trachea. The hypointense adventitia (yellow arrow) and hyperintense intima (blue arrow) of the trachea are interrupted in the T2-weighted image (c) and in the contrast-enhanced T1-weighted image (d). The tumor obstructs the entire esophagus, making it impossible for the oesophagoscope or endoscopic ultrasonography to pass through (e). Barium esophagogram shows the esophageal fistula (orange arrow)
Fig. 3
Fig. 3
ENEC images in a 67-year-old woman. Lesion (white arrow) shows heterogeneous slightly enhancing mass after contrast injection on CT image (a, b). The lesion is relatively homogeneous slightly hyperintensity, and hypointense muscularis propria (yellow arrow) is interrupted on T2-weighted images (c, d). The lesion has slightly heterogeneous enhancement with intensely enhancing stalk (blue arrow) on contrast-enhanced T1-weighted images (e, f), restricted diffusion (g), and low ADC value (mean: 1.318 × 10−3 mm2/s) (h). The lesion is shown in oesophagoscope (i) and endoscopic ultrasonography (j). H&E-stained section at × 200 microscopies confirmed the presence of esophageal neuroendocrine carcinoma (ENEC) (orange arrow) (k) with CD56 (neuronal cell marker) ( + ), CgA (neuroendocrine marker) ( + ), SyN (synaptophysin, synapses marker) ( + )
Fig. 4
Fig. 4
ENEC images in a 63-year-old man. Lesion (white arrow) shows large heterogeneous enhancing mass after contrast injection on CT image (a). The mass is heterogeneous and slightly hyperintense on the T2-weighted image. The hypointense muscularis propria (yellow arrow) is interrupted (b). The mass is heterogeneous and moderately enhancing with intensely enhancing stalk (blue arrow) (c, d) on post-contrast T1-weighted image, restricted diffusion (e), and low ADC value (mean: 0.815 × 10−3 mm2/s) (f). The lesion is shown in oesophagoscope (g) and endoscopic ultrasonography (h). H&E-stained section at × 100 microscopy confirmed the presence of ENEC (orange arrow) by biopsy (i) with CD56 (neuronal cell marker) ( + ), CgA (neuroendocrine marker) ( + ), SyN (synaptophysin, synapses marker) ( + ). CD56 can be used as a biomarker to detect neuroendocrine carcinoma. CgA is widespread in neuroendocrine cells and is found in almost all types of neuroendocrine tumors. SyN can be used as a marker for neuroendocrine cells. This patient received nCT and TRG 0 after surgery
Fig. 5
Fig. 5
Mixed carcinosarcoma and poorly differentiated neuroendocrine carcinoma images in a 64-year-old man. The lesion is large on CT image (a), and is slightly enhancing (white arrow) with enhancing stalk (blue arrow) on contrast-enhanced T1-weighted images (b, c). the mass is slightly hyperintense compared with muscularis propria (yellow arrow) on the T2-weighted image and has restricted diffusion (e) and low ADC value (mean: 0.523 × 10−3 mm2/s) (f). The lesion is shown in oesophagoscope (g) and endoscopic ultrasonography (h), and almost obstructs the esophagus completely. H&E-stained section at × 200 microscopy confirms the presence of esophageal cancerous sarcoma (black arrow) (i) with Vimentin (mesenchymal cell marker) ( + ). H&E-stained section at × 200 microscopy confirms the presence of ENEC (gray arrow) with CD56 ( + ), CgA ( + ), SyN ( + ) (h)
Fig. 6
Fig. 6
Esophageal carcinosarcoma in a 68-year-old woman. The lesion shows moderate inhomogeneous enhancing mass (white arrow) with coarse calcification (yellow arrow) on contrast-enhanced CT image (a). The mass is slightly hyperintense than muscularis propria on the T2-weighted image with a small focus of lower-signal intensity (yellow arrow) (b). The solid part shows restricted diffusion (white arrow) with the focus of calcification showing no diffusion restriction and no restricted diffusion (yellow arrow) (c). The mass shows heterogeneous enhancement on post post-contrast T1-weighted image, except for the focus of calcification which is not enhancing (d). The lesion is shown in oesophagoscope (e) and endoscopic ultrasonography (f). H&E-stained section at × 200 microscopy confirms the presence of esophageal cancerous sarcoma (green arrow) with Vimentin ( + ) (g)

Similar articles

References

    1. Leeflang MMG. The accuracy of MRI for esophageal cancer staging. Radiology. 2021;299:595–596. doi: 10.1148/radiol.2021210374. - DOI - PubMed
    1. Lee SL, Yadav P, Starekova J et al (2021) Diagnostic performance of MRI for esophageal carcinoma: a systematic review and meta-analysis. Radiology 299:583–594. 10.1148/radiol.2021202857 - PubMed
    1. Qu J, Zhang H, Wang Z, et al. Comparison between free-breathing radial VIBE on 3-T MRI and endoscopic ultrasound for preoperative T staging of resectable oesophageal cancer, with histopathological correlation. Eur Radiol. 2018;28:780–787. doi: 10.1007/s00330-017-4963-0. - DOI - PubMed
    1. Zhao K, Chu F, Wang Z et al (2023) Aorta and tracheobronchial invasion in esophageal cancer: comparing diagnostic performance of 3.0-T MRI and CT. Eur Radiol. 10.1007/s00330-023-09425-2 - PubMed
    1. Wang Z, Guo J, Qin J, et al. Accuracy of 3-T MRI for preoperative T staging of esophageal cancer after neoadjuvant chemotherapy, with histopathologic correlation. AJR Am J Roentgenol. 2019;212:1–8. doi: 10.2214/AJR.18.20204. - DOI - PubMed

LinkOut - more resources