

Muscle MRI as a biomarker of disease activity and progression in myotonic dystrophy type 1: a longitudinal study
- PMID: 38972019
- PMCID: PMC11377679
- DOI: 10.1007/s00415-024-12544-5
Muscle MRI as a biomarker of disease activity and progression in myotonic dystrophy type 1: a longitudinal study
Erratum in
-
Correction: Muscle MRI as a biomarker of disease activity and progression in myotonic dystrophy type 1: a longitudinal study.J Neurol. 2025 Feb 1;272(2):178. doi: 10.1007/s00415-024-12886-0. J Neurol. 2025. PMID: 39891752 Free PMC article. No abstract available.
Abstract
Introduction: Myotonic dystrophy type 1 (DM1) is an autosomal dominant disease characterized by myotonia and progressive muscular weakness and atrophy. The aim of this study was to investigate the usefulness of longitudinal muscle MRI in detecting disease activity and progression in DM1, and to better characterize muscle edema, fat replacement and atrophy overtime.
Materials and methods: This is a prospective, observational, longitudinal study including 25 DM1 patients that performed at least two muscle MRIs. Demographic and genetic characteristics were recorded. Muscular Impairment Rating Scale (MIRS) and MRC score were performed within 3 months from MRIs at baseline (BL) and at follow-up (FU). We analysed 32 muscles of lower body (LB) and 17 muscles of upper body (UB) by T1 and STIR sequences. T1-, STIR- and atrophy scores and their variations were evaluated. Correlations between MRIs' scores and demographic, clinical and genetic characteristics were analysed.
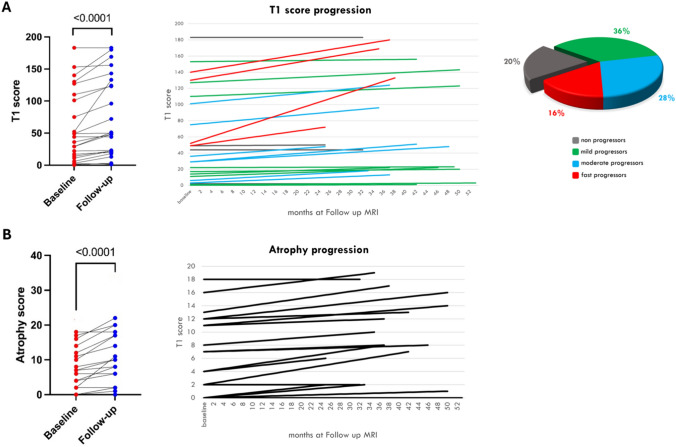
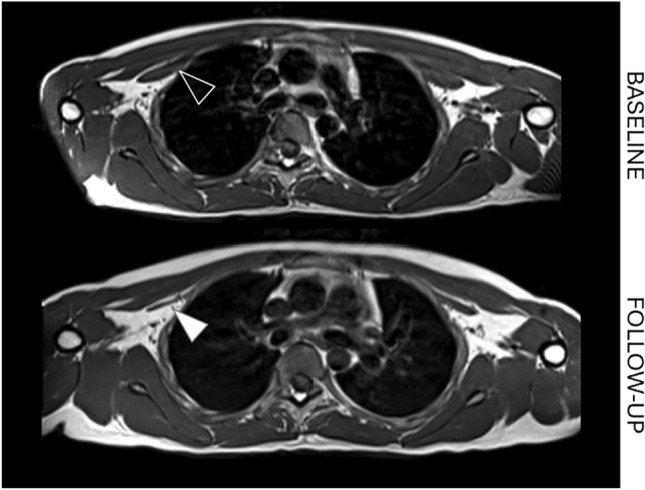
Results: Eighty (80%) of patients showed fat replacement progression at FU. The median T1 score progression (ΔT1-score) was 1.3% per year in LB and 0.5% per year in UB. The rate of fat replacement progression was not homogenous, stratifying patients from non-progressors to fast progressors (> 3% ΔT1-score per year). Half of the STIR-positive muscles at BL showed T1-score progression at FU. Two patients with normal MRI at baseline only showed STIR-positive muscle at FU, marking the disease activity onset. STIR positivity at baseline correlated with fat replacement progression (ΔT1-score; p < 0.0001) and clinical worsening at FU (ΔMRC-score; p < 0.0001). Sixty-five (65%) of patients showed STIR- and fat replacement-independent muscle atrophy progression, more evident in UB.
Conclusions: Muscle MRI represents a sensitive biomarker of disease activity, severity, and progression in DM1. STIR alterations precede fat replacement and identify patients with a higher risk of disease progression, while T1-sequences reveal atrophy and fat replacement progression before clinical worsening.
Keywords: Biomarkers; Longitudinal study; Muscle MRI; Myotonic dystrophy type 1.
© 2024. The Author(s).
Conflict of interest statement
The authors report no competing interests.
Figures


References
-
- Udd B, Krahe R (2012) The myotonic dystrophies: molecular, clinical, and therapeutic challenges. Lancet Neurol 11:891–905 - PubMed
-
- Bucci E, Testa M, Licchelli L et al (2018) A 34-year longitudinal study on long-term cardiac outcomes in DM1 patients with normal ECG at baseline at an Italian clinical centre. J Neurol 265(4):885–895. 10.1007/s00415-018-8773-3 - PubMed
-
- Ten Dam L, van der Kooi AJ, Verhamme C et al (2016) Muscle imaging in inherited and acquired muscle diseases. Eur J Neurol 23:688–703. 10.1111/ene.12984 - PubMed
Publication types
MeSH terms
Substances
LinkOut - more resources
Full Text Sources
Medical
