. 2024 Sep:199:106595.
doi: 10.1016/j.nbd.2024.106595. Epub 2024 Jul 6.

Excitatory synaptic structural abnormalities produced by templated aggregation of α-syn in the basolateral amygdala

Affiliations

Excitatory synaptic structural abnormalities produced by templated aggregation of α-syn in the basolateral amygdala

Nolwazi Z Gcwensa et al. Neurobiol Dis. 2024 Sep.

Erratum in

Abstract

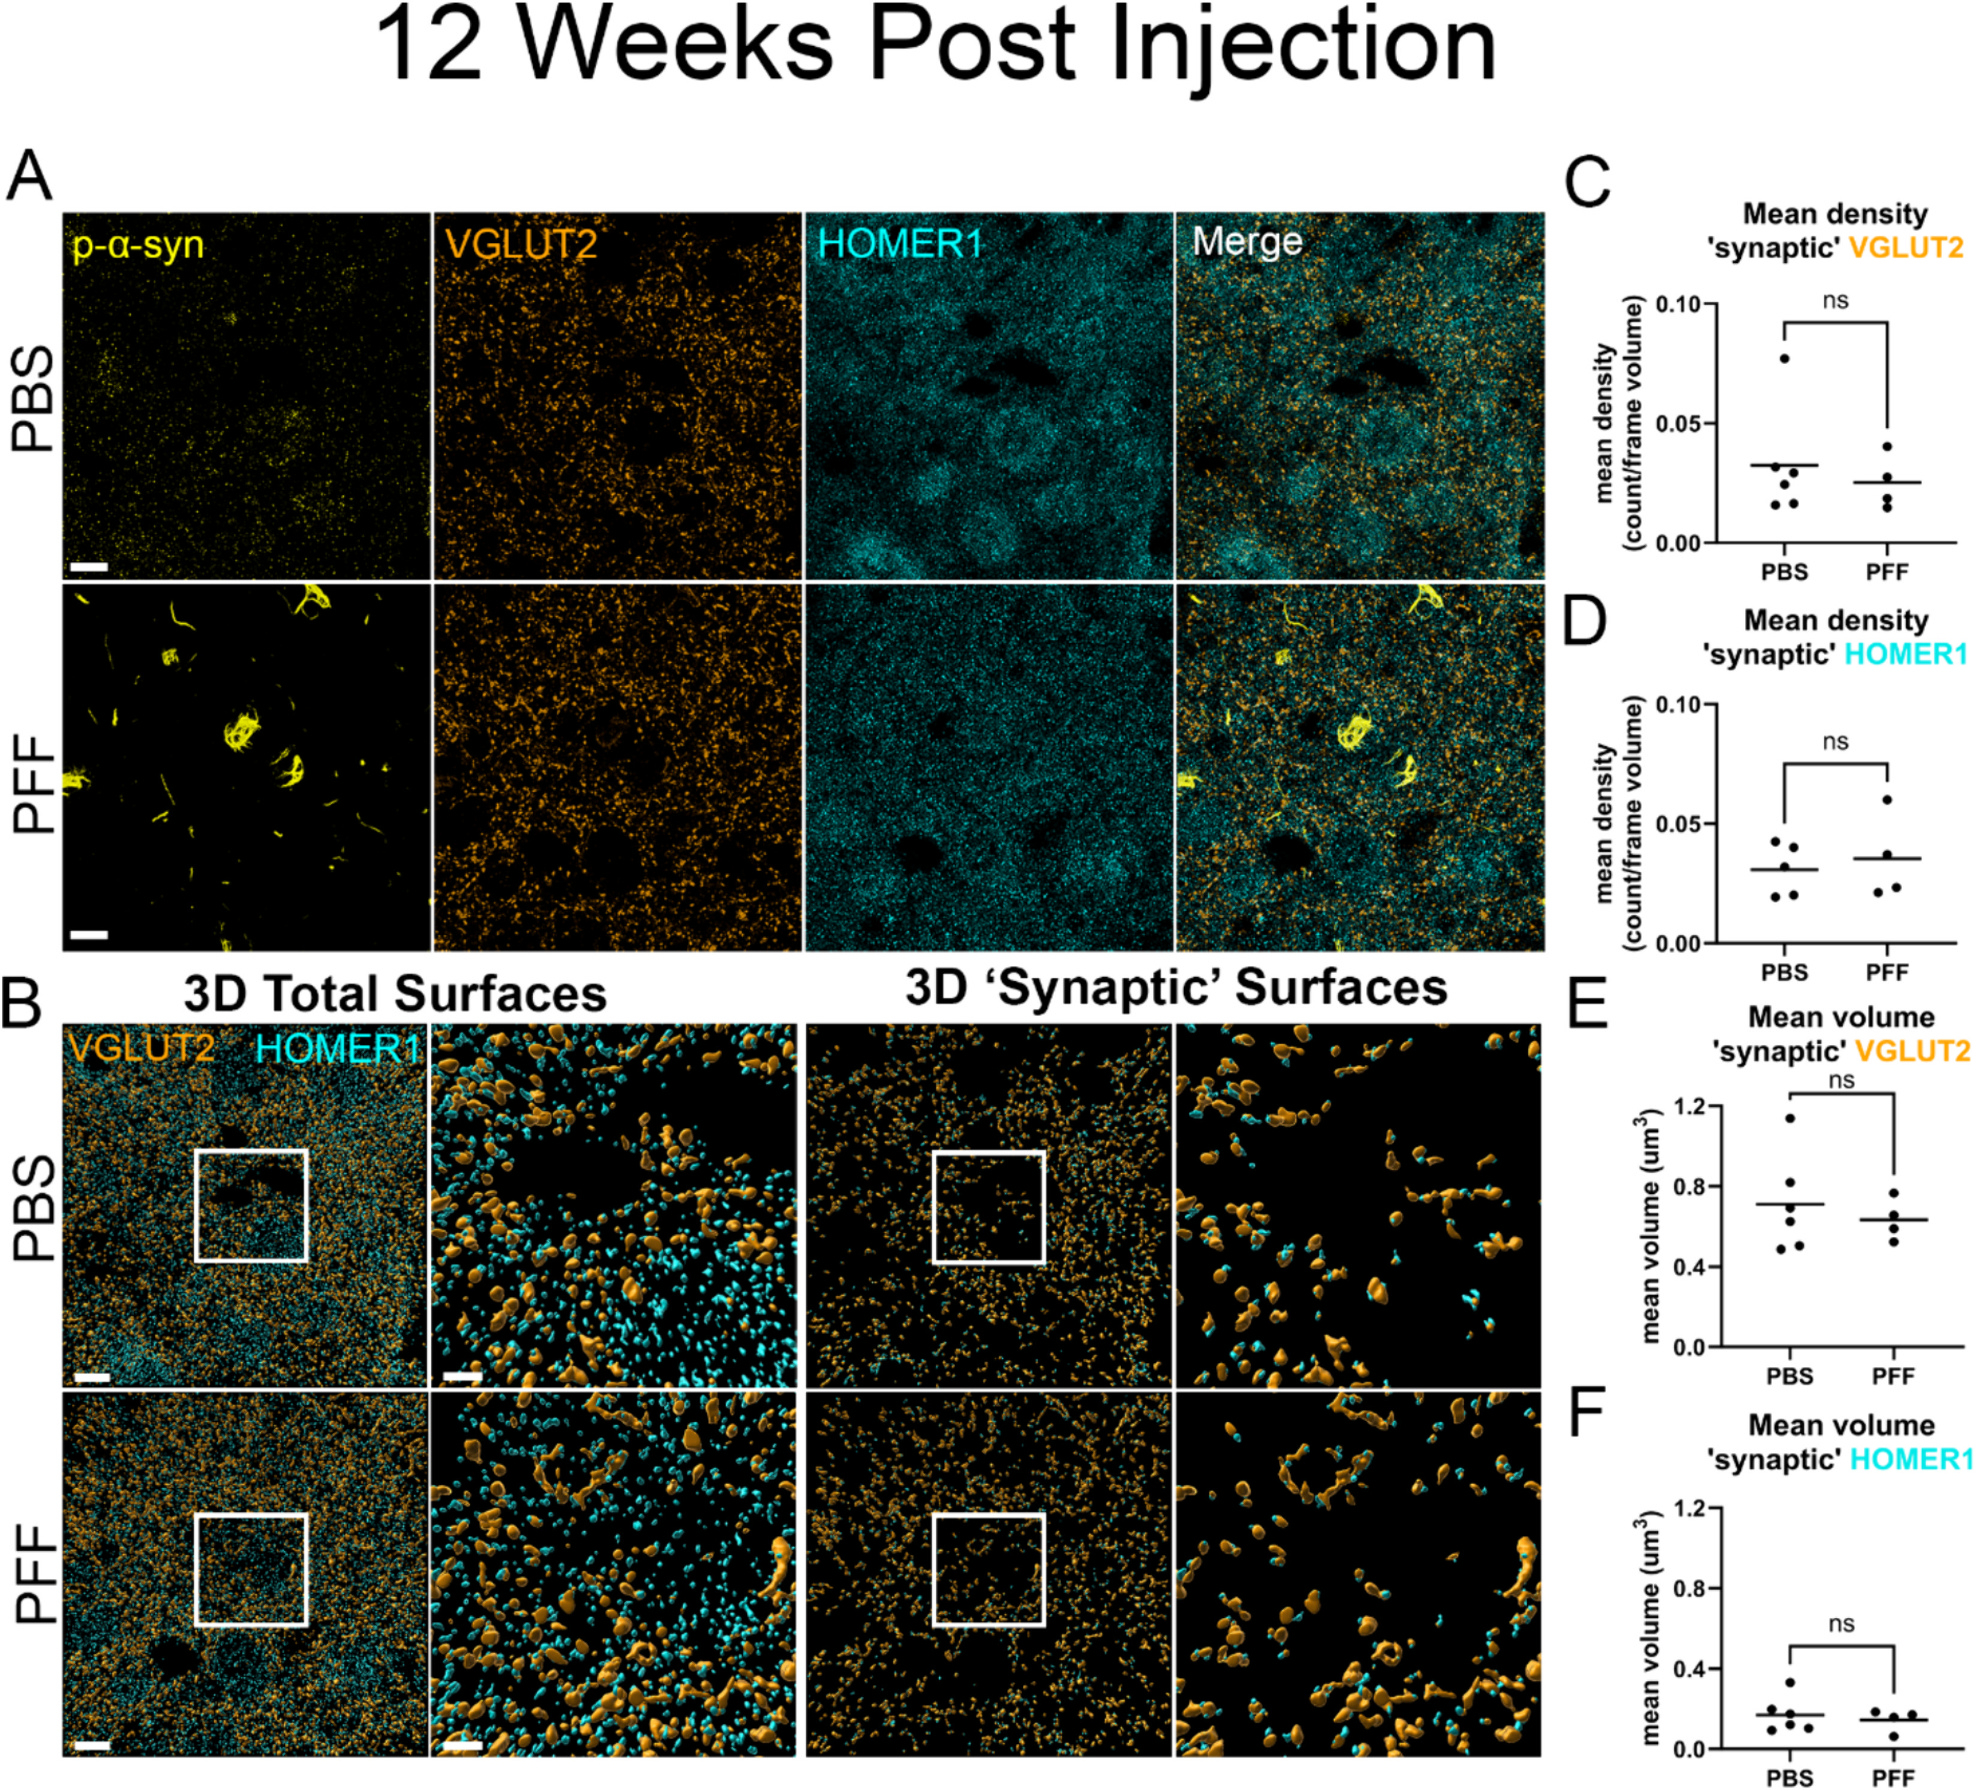
Parkinson's disease (PD) and Dementia with Lewy bodies (DLB) are characterized by neuronal α-synuclein (α-syn) inclusions termed Lewy Pathology, which are abundant in the amygdala. The basolateral amygdala (BLA), in particular, receives projections from the thalamus and cortex. These projections play a role in cognition and emotional processing, behaviors which are impaired in α-synucleinopathies. To understand if and how pathologic α-syn impacts the BLA requires animal models of α-syn aggregation. Injection of α-syn pre-formed fibrils (PFFs) into the striatum induces robust α-syn aggregation in excitatory neurons in the BLA that corresponds with reduced contextual fear conditioning. At early time points after aggregate formation, cortico-amygdala excitatory transmission is abolished. The goal of this project was to determine if α-syn inclusions in the BLA induce synaptic degeneration and/or morphological changes. In this study, we used C57BL/6 J mice injected bilaterally with PFFs in the dorsal striatum to induce α-syn aggregate formation in the BLA. A method was developed using immunofluorescence and three-dimensional reconstruction to analyze excitatory cortico-amygdala and thalamo-amygdala presynaptic terminals closely juxtaposed to postsynaptic densities. The abundance and morphology of synapses were analyzed at 6- or 12-weeks post-injection of PFFs. α-Syn aggregate formation in the BLA did not cause a significant loss of synapses, but cortico-amygdala and thalamo-amygdala presynaptic terminals and postsynaptic densities with aggregates of α-syn show increased volumes, similar to previous findings in human DLB cortex, and in non-human primate models of PD. Transmission electron microscopy showed that asymmetric synapses in mice with PFF-induced α-syn aggregates have reduced synaptic vesicle intervesicular distances, similar to a recent study showing phospho-serine-129 α-syn increases synaptic vesicle clustering. Thus, pathologic α-syn causes major alterations to synaptic architecture in the BLA, potentially contributing to behavioral impairment and amygdala dysfunction observed in synucleinopathies.

Keywords: Basolateral amygdala; Dementia with Lewy bodies; Glutamatergic; P-α-syn; Parkinson's disease; Presynaptic terminal; Synapses.


Figures

Fig. 1.
Fig. 1.
PFF injection induces α-syn inclusions in mouse BLA 6- and 12-weeks post-injection. Representative images for 3–4 month old mice injected bilaterally with PFFs in the striatum and sacrificed (A - C) 6 weeks post-injection and (D - F) 12 weeks post-injection. Left panels show p-α-syn positive aggregates (yellow) and Hoechst stained nuclei (blue). (A, D) Robust p-α-syn inclusion formation observed in the basolateral amygdala (BLA), cortical layer V and the paraventricular nucleus of the thalamus shown in right panels (inverted LUT, black). (B. E) Low magnification images of p-α-syn aggregates (yellow) and nuclei (Hoechst) and (C, F) high magnification images where inclusions can be observed in the neurons of the BLA and CeA. Inclusions in the soma are indicated by white arrowheads and Lewy neurite-like inclusions indicated by white arrows. Scale Bar = 500, 100 and 25 μm for low magnification and high magnification, respectively.
Fig. 2.
Fig. 2.
Effect of p-α-syn inclusion formation in density and volume of cortico-amygdala synaptic surfaces at 6-weeks post-injection. Mice were injected with either PBS, monomeric αsyn (MON), or PFFs and sacrificed 6-weeks post-injection. (A) Representative images of the deconvolved immunofluorescence for p-α-syn (yellow), presynaptic marker VGLUT1 (magenta) and postsynaptic marker HOMER1 (cyan). Scale bar = 10 μm. (B) 3D rendered surfaces for presynaptic VGLUT1 (magenta) and postsynaptic HOMER1 (cyan) total surfaces and 3.4× zoom inset and closely juxtaposed pre- and post- ‘synaptic’ surfaces and 3.4× zoom inset. Scale bar = 10 μm and 3 μm, respectively. Mean values for the density of ‘synaptic’ surfaces for (C) VGLUT1+ and (D) HOMER1+ puncta normalized to the volume of the frame showed no significant differences between treatment and control mice. Mean values of the volume for (E) ‘synaptic’ VGLUT1+ and (F) ‘synaptic’ HOMER1+ puncta showed overall no significant differences in puncta volume for pre- and postsynaptic puncta compared to negative controls. Statistical model: One-way ANOVA with Brown-Forsythe correction applied to groups with unequal variance. Data points represent average values for each individual mouse.
Fig. 3.
Fig. 3.
Inducing p-α-syn inclusion formation significantly increased mean volume of excitatory cortico-amygdala VGLUT1-positive terminals in mouse BLA 12-weeks post-injection. For animals injected with either PBS or PFFs and perfused for immunofluorescence at 12-weeks post-injection. (A) Representative images of the deconvolved immunofluorescence for p-α-syn (yellow), presynaptic marker VGLUT1 (magenta) and postsynaptic HOMER1 (cyan) signal. Scale bar = 10 μm. (B) 3D rendered surfaces for presynaptic VGLUT1 (magenta) and postsynaptic HOMER1 (cyan) total surfaces and 3.4× zoom inset and closely juxtaposed pre- and post- ‘synaptic’ surfaces and 3.4× zoom inset. Scale bar = 10 μm and 3 μm, respectively. Mean values for the density of surfaces for (C) ‘synaptic’ VGLUT1+ and (D) ‘synaptic’ HOMER1+ puncta normalized to the volume of the frame showed no significant differences between treatment and control mice. Mean values of the volume for (E) ‘synaptic’ VGLUT1+ puncta showed significant increase in mean volume for PFF-injected animals compared to PBS-injected animals. (F) No significant difference in mean volume of ‘synaptic’ HOMER1+ puncta closely juxtaposed to VGLUT1+ was observed. Statistical model: Students t-test with Welch’s correction applied to groups with significant differences in variance. Data points represent average values for individual mouse.
Fig. 4.
Fig. 4.
Inducing p-α-syn inclusion formation has no significant effect on density and volume of thalamo-amygdala synaptic pairs at 6-weeks post-injection. Mice were injected with either PBS or PFFs and perfused for immunofluorescence at 6-weeks post-injection, (A) representative images of the deconvolved immunofluorescence for p-α-syn (yellow), presynaptic marker VGLUT2 (orange) and postsynaptic HOMER1 (cyan). Scale bar = 10 μm. (B) 3D rendered surfaces for presynaptic VGLUT2 (orange) and postsynaptic HOMER1 (cyan) total surface and 3.4× zoom inset as well as closely juxtaposed pre- and post- ‘synaptic’ surfaces and 3.4× zoom inset. Scale bar = 10 μm and 3 μm, respectively. Mean values for the density of ‘synaptic’ surfaces for (C) VGLUT2+ and (D) ‘synaptic’ HOMER1+ puncta normalized to the volume of the frame showed no significant differences between treatment and control mice. Mean values of the volume for (E) ‘synaptic’ VGLUT2+ and (F) ‘synaptic’ HOMER1+ puncta showed no significant differences in mean volume of puncta. Statistical model: Students t-test with Welch’s correction applied to groups with significant differences in variance. Data points represent average values for individual mouse.
Fig. 5.
Fig. 5.
Inducing p-α-syn inclusion formation has no significant effect on density and volume of thalamo-amygdala projections 12-weeks post-injection. (A) Mice were injected with either PBS or PFFs and perfused for immunofluorescence at 12-weeks post-injection. Representative images of the deconvolved immunofluorescence for p-α-syn (yellow), presynaptic marker VGLUT2 (orange) and postsynaptic HOMER1 (cyan) are shown. (B) 3D rendered surfaces for presynaptic VGLUT2 (orange) and postsynaptic HOMER1 (cyan) total surfaces and 3.4× zoom inset and closely juxtaposed pre- and post- ‘synaptic’ surfaces and 3.4× zoom inset. Scale bar = 10 μm and 3 μm, respectively. Mean values for the density of (C) ‘synaptic’ VGLUT2+ and (D) ‘synaptic’ HOMER1+ puncta normalized to the volume of the frame showed no significant differences between treatment and control mice. Mean values of the volume for (E) ‘synaptic’ VGLUT2+ and (F) ‘synaptic’ HOMER1+ puncta showed no significant differences in mean volume of puncta. Statistical model: Students t-test with Welch’s correction applied to groups with significant differences in variance (p > 0.5). Data points represent average values for individual mouse.
Fig. 6.
Fig. 6.
Volumes of synaptic puncta containing p-α-syn are larger than those that do not contain p-α-syn aggregates at 6- and 12-weeks post-injection. For animals injected with PFFs, representative images of 3D rendered surfaces for p-α-syn inclusions and pre- and postsynaptic excitatory markers closely juxtaposed to inclusions. (A) 3D surfaces for VGLUT1+ (magenta) and HOMER1+ (cyan) cortico-amygdala projections containing p-α-syn inclusions (yellow). (B) 3D surfaces for VGLUT2+ (orange) and HOMER1+ (cyan) thalamo-amygdala projections containing p-α-syn inclusions (yellow). The second inset represents only synaptic puncta containing p-α-syn aggregates. For visual clarity, p-α-syn aggregates with volume >0.1 μm have been removed. White arrows used to indicate synaptic puncta containing p-α-syn aggregates with volume below 0.1 μm. Scale bar left = 10 μm, scale bar middle = 3 μm & scale bar right = 0.5 μm. (C – F) Mean volume of pre- and postsynaptic puncta show significant increases in mean volume of puncta when those puncta are positive for p-α-syn (w p-α-syn) compared to those puncta without p-α-syn (wo p-α-syn) measured as distance from surface between synaptic puncta and p-α-syn for cortico-amygdala (VGLUT1/HOMER1) and thalamo-amygdala (VGLUT2/HOMER1) projections. Statistical model: Students t-test with Welch’s correction applied to groups with significant differences in variance. Data points represent average values for individual mouse.
Fig. 7.
Fig. 7.
Intervesicular distances and synaptic vesicle volumes are reduced in excitatory synapses in the BLA of PFF-injected mice. At 12-weeks post-injection, transmission electron microscopy was performed using the BLA from PBS (N = 4) and PFF (N = 4) mice. (A) Representative image of asymmetric synapses quantified from PBS- and PFF-injected mice (Scale bar = 600 nm). (B) Fiji was used to quantify the length of the PSD in asymmetric synapses (n = 412). Data were log10 transformed and analyzed using linear mixed models with synapses nested within each mouse, treatment as a fixed variable and compound symmetry as the covariance type. (F(1,6) = 1.6, p = 0.245). (C) Docked vesicles were defined as SVs that fell within distance ≤100 nm from active zone adjacent to traced PSD length. The number of docked vesicles was divided by the PSD length measured for that synapse. Data were log10 transformed and analyzed using linear mixed models with synapses nested within each mouse, treatment as a fixed variable and compound symmetry as the covariance type. (F(1,6) = 0.149, p = 0.714). (D, E) Intervesicular distances and synaptic vesicle were measured using a previously published convolution neural network algorithm (n = 10,400 for PBS, n = 9570 for PFF). For (D), intervesicular distances, data were analyzed using linear mixed models with synapses nested within each mouse, treatment as fixed variable and compound symmetry as the covariance type. (F(1,6) = 14.3, p = 0.007). For (E), the synaptic vesicle areas did not fit a continuous distribution because of the thresholding built into the neural network. The data were thus binned into cases above or below the grand median for PBS and PFF. A Fisher’s exact test revealed a significantly higher percentage of smaller synaptic vesicle areas in the PFF treated group χ2 = 37.8, p < 0.001).
Fig. 8.
Fig. 8.
Simplified Amygdala Circuit Diagram illustrating distribution of pathology and synapse structural changes in intrastriatal PFF model. Vesicular glutamate transporter 1-positive (VGLUT1+) terminals (magenta) represent cortico-BLA projections from the cortex to the striatum that also send collaterals to the basolateral amygdala. VGLUT2+ terminals represent axonal collaterals from the thalamus to the striatum with collaterals in the basolateral amygdala. Following intrastriatal injections of PFFs into the striatum, p-α-syn pathology localizes to both VGLUT1 cortico-BLA and VGLUT2 thalamo-BLA terminals, resulting in increased volumes (Gao et al., 2022; Guo et al., 2015; Lai et al., 2022; McHale et al., 2022; Sarter and Markowitsch, 1984; Shih and Chang, 2024).

Update of

References

    1. Beesley PW, Herrera-Molina R, Smalla KH, Seidenbecher C, 2014. The Neuroplastin adhesion molecules: key regulators of neuronal plasticity and synaptic function. J. Neurochem. 131 (3), 268–283. 10.1111/jnc.12816. - DOI - PubMed
    1. Blumenstock S, Rodrigues EF, Peters F, Blazquez-Llorca L, Schmidt F, Giese A, Herms J, 2017. Seeding and transgenic overexpression of alpha-synuclein triggers dendritic spine pathology in the neocortex. EMBO Mol. Med 9 (5), 716–731. 10.15252/emmm.201607305. - DOI - PMC - PubMed
    1. Bousset L, Pieri L, Ruiz-Arlandis G, Gath J, Jensen PH, Habenstein B, Madiona K, Olieric V, Böckmann A, Meier BH, Melki R, 2013. Structural and functional characterization of two alpha-synuclein strains. Nat. Commun. 4, 2575. 10.1038/ncomms3575. - DOI - PMC - PubMed
    1. Braak H, Del Tredici K, 2017. Neuropathological staging of brain pathology in sporadic Parkinson’s disease: separating the wheat from the chaff. J. Parkinsons Dis. 7 (s1), S71–s85. 10.3233/jpd-179001. - DOI - PMC - PubMed
    1. Braak H, Braak E, Yilmazer D, de Vos RA, Jansen EN, Bohl J, Jellinger K, 1994. Amygdala pathology in Parkinson’s disease. Acta Neuropathol. 88 (6), 493–500. 10.1007/bf00296485. - DOI - PubMed

Publication types

LinkOut - more resources