. 2024 Jul 7;15(1):5694.
doi: 10.1038/s41467-024-49916-4.

Single-cell resolution characterization of myeloid-derived cell states with implication in cancer outcome

Affiliations

Single-cell resolution characterization of myeloid-derived cell states with implication in cancer outcome

Gabriela Rapozo Guimarães et al. Nat Commun. .

Abstract

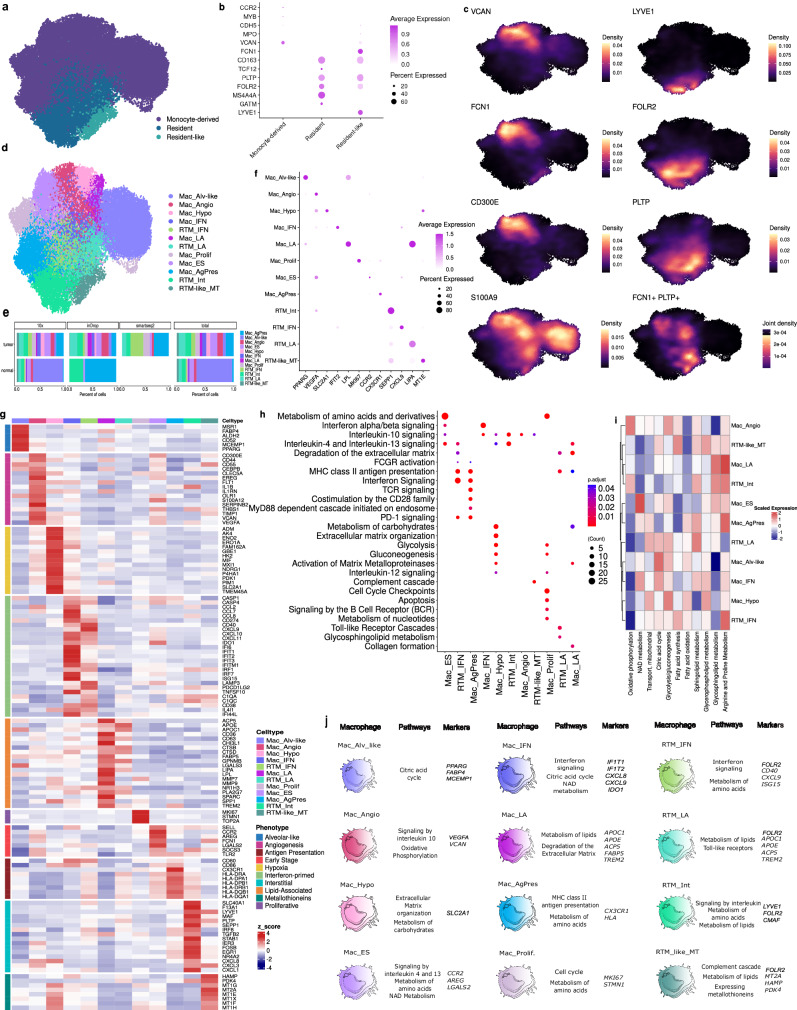
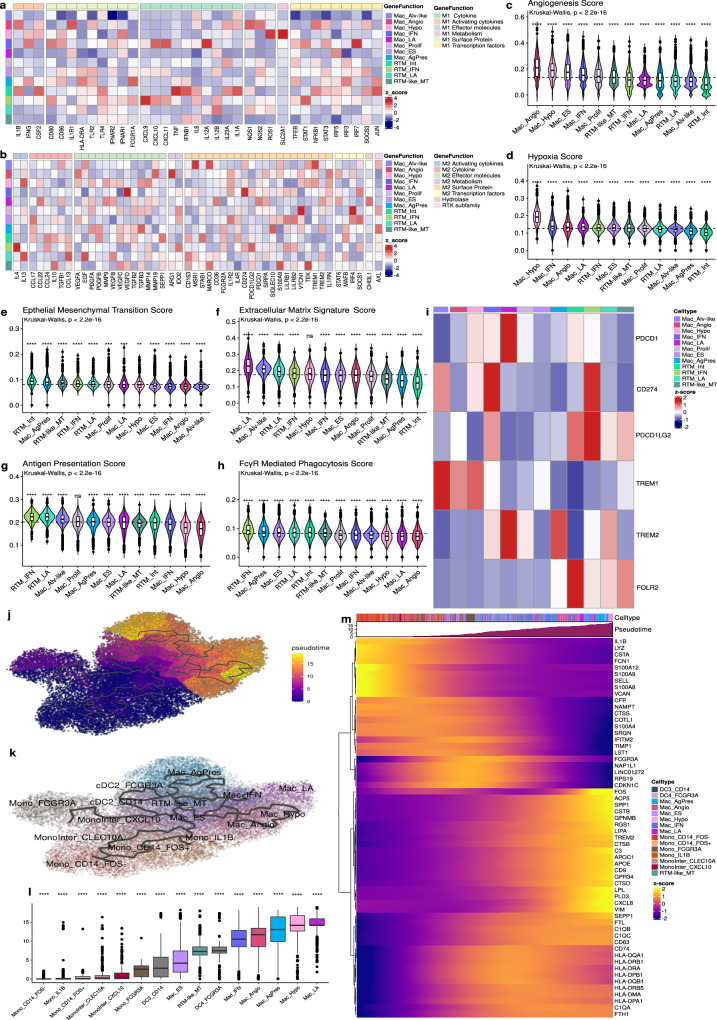
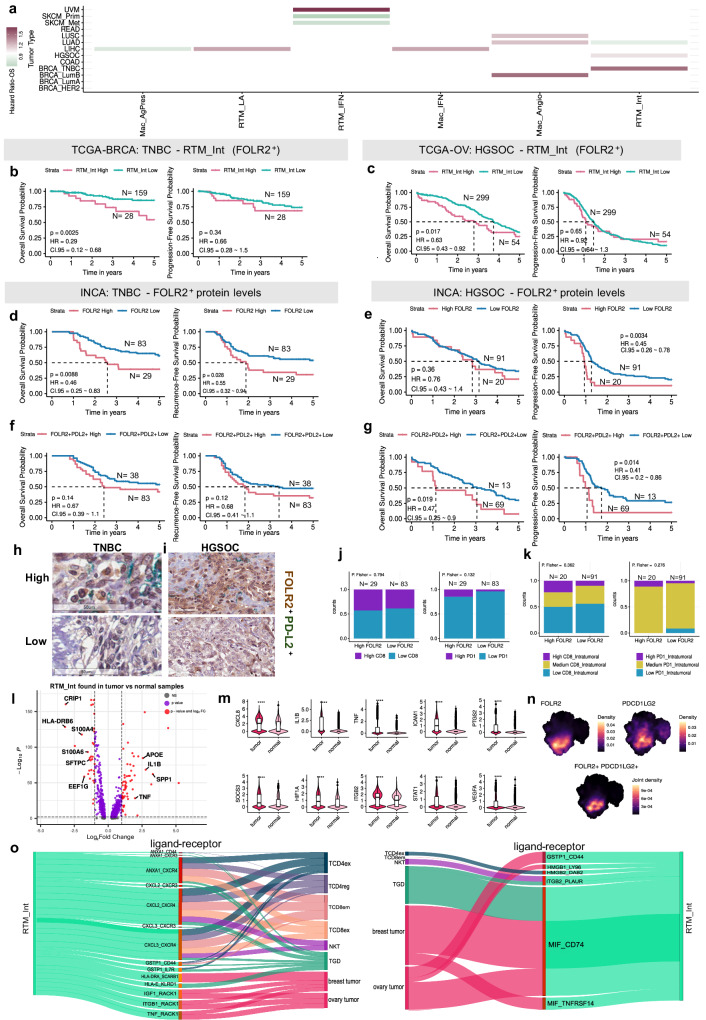
Tumor-associated myeloid-derived cells (MDCs) significantly impact cancer prognosis and treatment responses due to their remarkable plasticity and tumorigenic behaviors. Here, we integrate single-cell RNA-sequencing data from different cancer types, identifying 29 MDC subpopulations within the tumor microenvironment. Our analysis reveals abnormally expanded MDC subpopulations across various tumors and distinguishes cell states that have often been grouped together, such as TREM2+ and FOLR2+ subpopulations. Using deconvolution approaches, we identify five subpopulations as independent prognostic markers, including states co-expressing TREM2 and PD-1, and FOLR2 and PDL-2. Additionally, TREM2 alone does not reliably predict cancer prognosis, as other TREM2+ macrophages show varied associations with prognosis depending on local cues. Validation in independent cohorts confirms that FOLR2-expressing macrophages correlate with poor clinical outcomes in ovarian and triple-negative breast cancers. This comprehensive MDC atlas offers valuable insights and a foundation for futher analyses, advancing strategies for treating solid cancers.


Conflict of interest statement

During the preparation of the manuscript M.A.P. was hired by Egle Therapeutics. The other authors declare no competing interests.

Figures

Fig. 1
Fig. 1. Multi-tissue single-cell atlas of tumor and healthy samples.
a Workflow for integrative analysis of single-cell RNA-sequencing data outlining a comprehensive pipeline from preprocessing multiple scRNA-Seq studies through quality control, data integration, and normalization, to the identification and annotation of cell subpopulations. Key analytic tools are noted at each step, including Seurat for object creation and quality control, scVI-tools for data normalization and integration, and other methods used for cell type annotation, ambient RNA removal, and cluster purity assessment. b Dot plot showing the distribution of sample types across the tissues and peripheral blood mononuclear cells (PBMC) analyzed in this study. Dot size indicates the number of cells by sample type. c Uniform Manifold Approximation and Projection (UMAP) of 51,687 myeloid-derived cells, color-coded by cell types. d Density plots highlighting the expression of gene/score for each cell. e Dot plot showing the expression of specific markers by each myeloid-derived subpopulation. Dot size indicates the percent of expressing cells, and the color is the scaled average expression. f Heatmap showing the proportion of cells and their respective specific markers from each MDC. The color scale represents the scaled expression of each gene. g Dendrogram represents the hierarchical clustering of MDCs based on their gene expression similarity. The branch’s height indicates the distance or dissimilarity between clusters, with a lower height reflecting greater similarity. The Jaccard bootstrap mean values are overlaid on the dendrogram, measuring cluster stability based on resampling. Values closer to 1 indicate higher confidence. The dashed line across the dendrogram serves as a cut-off threshold for defining distinct clusters based on Jaccard similarity. The colored boxes correspond to broad cell types categorized by their predominant function or phenotype. Each terminal node of the dendrogram is labeled with the subcluster name derived from the expression of key marker genes. The values in red on each node represent the bootstrap percentage related to the confidence of the node’s position. A total of 10.000 replicates were used for bootstrapping. Source data are provided as a Source Data file. %MT - percentage of transcripts that map to mitochondrial genes.
Fig. 2
Fig. 2. Characterization of dendritic cell subpopulations.
a UMAP color-coded by the broad classification of dendritic cells. b Density plots highlighting the gene expression of each cell for specific markers. c UMAP of DC subpopulations colored by eight states: DC1_CLE9A, DC2_207, DC2_AREG, DC2_FCER1A, DC3_CD14, DC4_FCGR3A, DC_CXCL8 and DC_LAMP3. d Heatmap showing the DEGs per cluster. The color scale represents the scaled expression of each gene. e Dot plot showing the mean expression of genes related to DC cell subpopulations. Dot size indicates the fraction of expressing cells, colored based on normalized expression levels. f Bar plot showing the distribution of DC cells across sample types by three different sequencing platforms (10x, inDrop, Smart-seq2), with an aggregated total. g Enrichment pathways analysis of DC subpopulations using Reactome database. The size of each circle represents the number of genes and such circles are colored by p-adjust corrected by Benjamini-Hochberg (BH) after one-sided Fisher’s exact test. Source data are provided as a Source Data file.
Fig. 3
Fig. 3. Characterization of monocytes subpopulations.
a UMAP of monocytes subpopulations colored by four states: Mono_Inflammatory, Mono_Intermediate, Mono_Non-Classical, and Classical. b Density plots highlighting the gene expression and co-expression of specific genes for each cell. c UMAP of monocytes subpopulations colored by the six states identified. d Heatmap showing the DEGs per cluster. The color scale represents the scaled expression of each gene. e Dot plot showing the mean expression of genes related to monocytes subpopulations. Dot size indicates the percent of expressing cells, and the dot color the scaled average expression. f Bar plot showing the distribution of monocytes across sample types by three different sequencing platforms (10x, inDrop, Smart-seq2), with an aggregated total. g Enrichment pathways analysis of monocytes subpopulations using Reactome database. The size of each circle represents the number of genes and such circles are colored by p-adjust using one-sided Fisher’s exact test with BH multiple-testing correction. Source data are provided as a Source Data file.
Fig. 4
Fig. 4. Characterization of macrophage subpopulations.
a UMAP of macrophages color-coded by the ontogeny subdivision. b Dot plot showing the mean expression of the resident and monocyte-derived macrophage-related markers. The dot size indicates the percent of expressing cells, and the dot color is the scaled average expression. c Density plots highlighting the gene expression and co-expression of each cell. d UMAP of macrophages colored by the twelve states identified. e Bar plot showing the distribution of Mac subpopulations across sample types by three different sequencing platforms (10x, inDrop, Smart-seq2), with an aggregated total. f Dot plot showing the mean expression of genes related to the Mac subpopulation. Dot size indicates the percent of expressing cells, and the dot color the scaled average expression. g Heatmap showing the gene signature per subpopulation. The color scale represents the scaled expression of each gene. h Dot plot representing the functional enrichment analysis of Mac subpopulations using Reactome database. The size of each circle represents the number of genes and such circles are colored by p-adjust using one-sided Fisher’s exact test with BH multiple-testing correction. i Heatmap showing main metabolism signature for each Mac states. The color scale represents the scaled expression of each pathway. j Schematic overview of the diverse phenotypes and functional signatures of Mac subpopulations characterized in this study. Source data are provided as a Source Data file.
Fig. 5
Fig. 5. Macrophages exhibited diverse phenotypes and functional states.
Heatmap showing the distribution and score signature of (a) M1 and (b) M2 markers across the Mac subpopulations. The color scale represents the row-wise scaled expression of each gene. Violin plot showing the gene signature of five hallmarks of cancer: c angiogenesis, d hypoxia, e EMT, f ECM, g antigen presentation, and h phagocytosis. Dashed lines represent the average score. i Heatmap of immunosuppressive gene signature. Pseudotime analysis of monocytes, macrophages, and dendritic cells derived from monocytes. UMAP color-coded by the (j) pseudotime and by the (k) subpopulations. l Boxplot of the pseudotime across the subpopulations arranged in ascending order. m Heatmap showing expression variation of the indicated transcripts (only genes with q value = 0 and morans_I > 0.25, are depicted). Box indicates the range from 25th to 75th percentile, with whiskers extending to 1.5 times the interquartile range. Outliers are plotted separately, center indicates the median value. For statistical significance, we performed the Kruskall–Wallis test (p <2.2×10⁻¹⁶) followed by Wilcoxon to compare each group against “all” (i.e., base-mean). Ns non-significant.; **p < 0.01; ***p < 0.001; ****p < 0.0001. Source data are provided as a Source Data file.
Fig. 6
Fig. 6. Impact of Mac_LA (TREM2+) on clinical outcomes.
Bar plot showing the distribution of (a) broad cell types and (b) mononuclear phagocytes estimated through deconvolution across different tumor types (data sourced from TCGA database). c Violin plot of TREM2 expression across macrophage populations. Dashed lines represent the average score. Box represents the 25th to 75th percentile range, with whiskers extending to 1.5 times the interquartile range. Outliers are plotted separately, and the median is marked in the center. Statistical significance was tested using the Kruskall–Wallis test followed by Wilcoxon tests, with significance levels indicated as **p < 0.01 and ****p < 0.0001. d Density plots of PD1 encoding gene and TREM2 expression and co-expression in macrophages. e Overall Survival (OS) and Progression-Free Survival (PFS) associated with Mac_LA estimated through deconvolution in TNBC (TCGA-BRCA cohort, N = 187). HIGH and LOW groups cutoff were determined using the surv_cutpoint R function. OS and Recurrence-Free Survival (RFS) analysis for (f) TREM2+ and (g) CD68+TREM2+ co-staining markers in the TNBC-INCA cohort (N = 110 and N = 96, respectively). For TREM2 alone, staining was measured through ImageJ software and HIGH and LOW group cutoffs were calculated using the surv_cutpoint R function. For co-staining, levels of staining and groups were determined on the percentage of marked cells by a pathologist. For all Kaplan-Meier curves, the log-rank test was applied, and p values ≤ 0.05 were considered significant. h IHC representative of CD68+ TREM2+ expression in TNBC-INCA cohort. Image obtained by Aperio ImageScope v12.4.6.5003. i Proportions of CD8+ and PD1+ markers in the TREM2+ HIGH and LOW groups in TNBC-INCA. j Sankey diagram representing the putative cell-cell interactions between Mac_LA and other cells. Ligand-receptor pairs are represented in the middle. Line thickness represents ligand and receptor expression-based z-scores. Source data are provided as a Source Data file. INCA Brazilian National Cancer Institute, TCGA The Cancer Genome Atlas, TNBC Triple Negative Breast Cancer, HGSOC High-Grade Serous Ovarian Carcinoma, BRCA Breast Carcinoma, COAD Colon Adenocarcinoma, READ Rectum Adenocarcinoma, LIHC Liver Hepatocellular Carcinoma, SKCM Skin Cutaneous Melanoma, LUAD Lung Adenocarcinoma, LUSC Lung Squamous Cell Carcinoma, UVM Uveal Melanoma.
Fig. 7
Fig. 7. Impact of RTM_Int (FOLR2+) on clinical outcomes.
a Cox univariate analysis (log-rank, p-value <0.05) in macrophage subpopulations. OS and PFS for (b) TNBC (N = 187) and (c) HGSOC (N = 353), associated with RTM_Int estimated through deconvolution in bulk RNA-Seq samples from TCGA cohort. HIGH and LOW groups cutoff were determined using surv_cutpoint. OS and PFS considering FOLR2 levels for (d) TNBC-INCA (N = 112) and (e) HGSOC-INCA (N = 111) cohorts. For TNBC-INCA, IHC FOLR2 levels were measured with ImageJ software and groups cutoff were determined using the surv_cutpoint. For HGSOC-INCA, levels of staining and groups were determined by the percentage of marked cells by a pathologist. OS and PFS considering FOLR2+ PDL-2+ co-staining for (f) TNBC-INCA (N = 121) and (g) HGSOC-INCA (N = 82) cohorts, measured by HALO software version 3.6. Group cutoffs were calculated using surv_cutpoint. For all Kaplan-Meier curves, the log-rank test was applied, and p-values ≤0.05 were considered significant. IHC representative of FOLR2+ PDL-2+ co-satining in (h) TNBC-INCA and (i) HGSOC-INCA cohorts. Image obtained by Aperio ImageScope v12.4.6.5003. Proportions of CD8+ and PD1+ markers in the FOLR2+ HIGH and LOW groups in the (j) TNBC-INCA and (k) HGSOC-INCA cohorts. l Volcano Plot representing DEGs between RTM-Ints found in tumor vs normal samples (Wilcoxon rank sum, FDR adjusted p-value < 0.05, and cutoff |Log2FC| > = 1). m Violin plot of DEGs belonging to IL4 and IL13 signaling from the Reactome database. Box indicates 25th to 75th percentile range, with whiskers extending to 1.5 times the interquartile range. Outliers are plotted separately, center indicates median value. Groups were compared using Wilcoxon rank sum test (****p < 0.0001). n Density plots highlighting FOLR2 and PDCD1 co-expression in macrophage populations. o Sankey diagram representing putative cell-cell interactions between RTM_Int and other cells. Ligand-receptor pairs are represented in the middle. Line thickness represents ligand and receptor expression-based z-score. Source data are provided as a Source Data file. TNBC Triple Negative Breast Cancer, INCA Brazilian National Cancer Institute, TCGA The Cancer Genome Atlas, BRCA Breast Cancer, HGSOC High-Grade Serous Ovarian Carcinoma.

References

    1. Waldman AD, Fritz JM, Lenardo MJ. A guide to cancer immunotherapy: from T cell basic science to clinical practice. Nat. Rev. Immunol. 2020;20:651–668. doi: 10.1038/s41577-020-0306-5. - DOI - PMC - PubMed
    1. Sharma P, et al. The next decade of immune checkpoint therapy. Cancer Discov. 2021;11:838–857. doi: 10.1158/2159-8290.CD-20-1680. - DOI - PubMed
    1. Greene JT, Brian BF, 4th, Senevirathne SE, Freedman TS. Regulation of myeloid-cell activation. Curr. Opin. Immunol. 2021;73:34–42. doi: 10.1016/j.coi.2021.09.004. - DOI - PMC - PubMed
    1. Mantovani A, Marchesi F, Jaillon S, Garlanda C, Allavena P. Tumor-associated myeloid cells: diversity and therapeutic targeting. Cell. Mol. Immunol. 2021;18:566–578. doi: 10.1038/s41423-020-00613-4. - DOI - PMC - PubMed
    1. Zhou X, Liu X, Huang L. Macrophage-mediated tumor cell phagocytosis: opportunity for nanomedicine intervention. Adv. Funct. Mater. 2021;31:2006220. doi: 10.1002/adfm.202006220. - DOI - PMC - PubMed

MeSH terms