. 2024 Jul 7;14(1):15633.
doi: 10.1038/s41598-024-66610-z.

Identification and validation of a prognostic model based on four genes related to satellite nodules in hepatocellular carcinoma

Affiliations

Identification and validation of a prognostic model based on four genes related to satellite nodules in hepatocellular carcinoma

Feng Liu et al. Sci Rep. .

Abstract

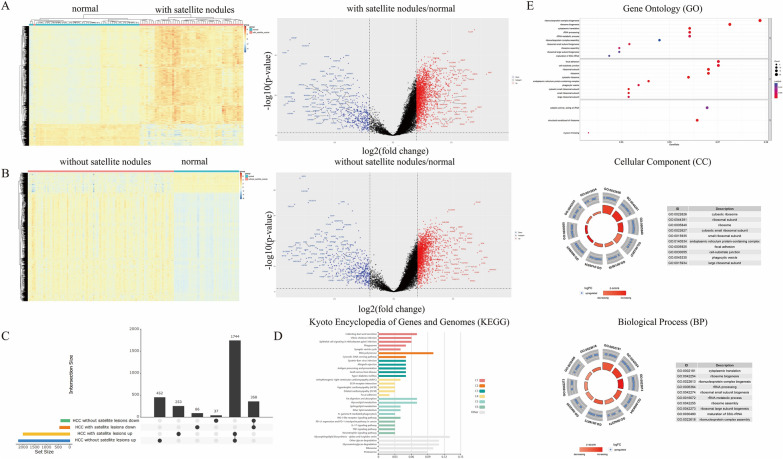
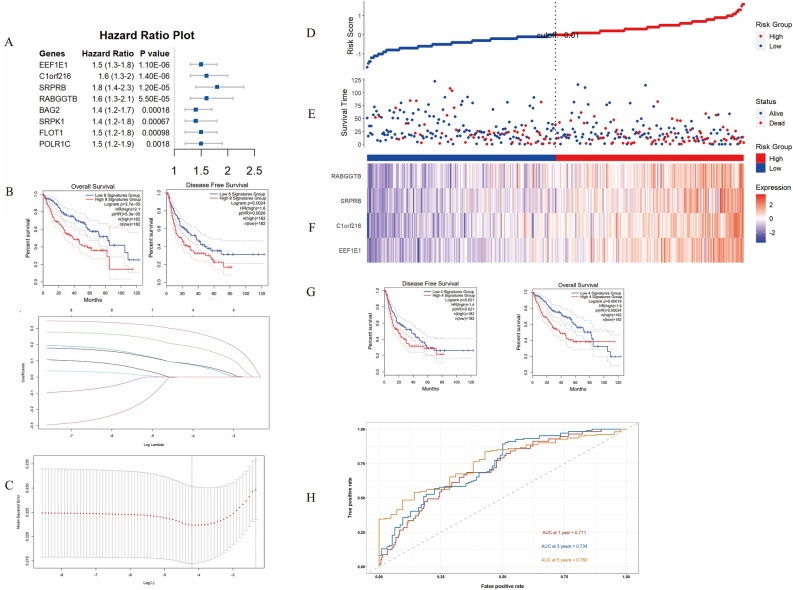
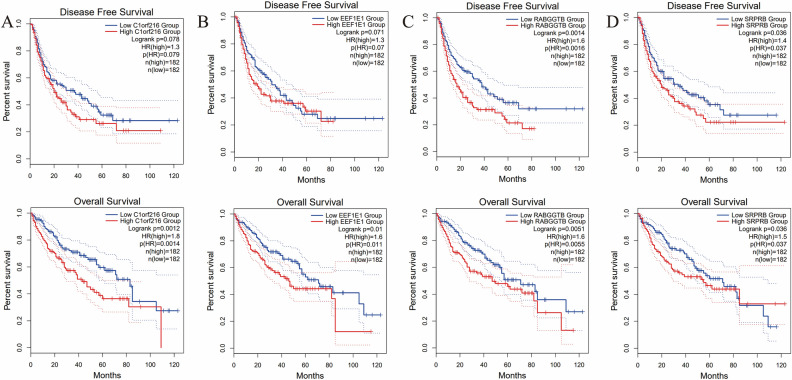
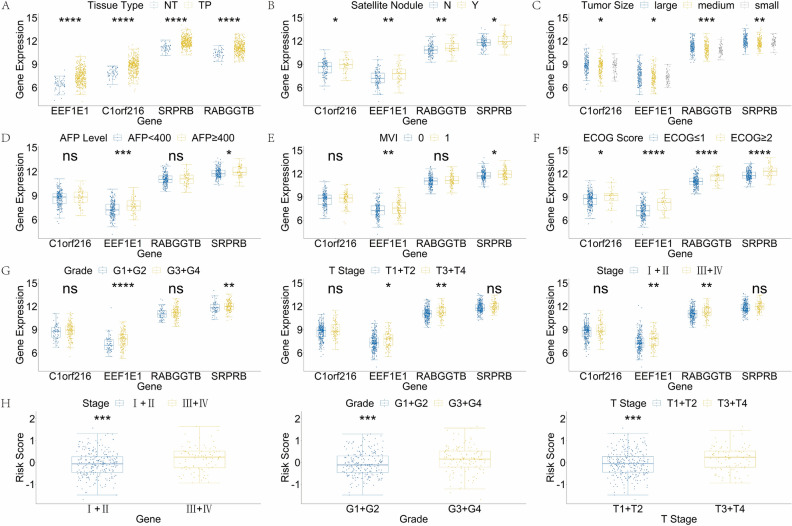
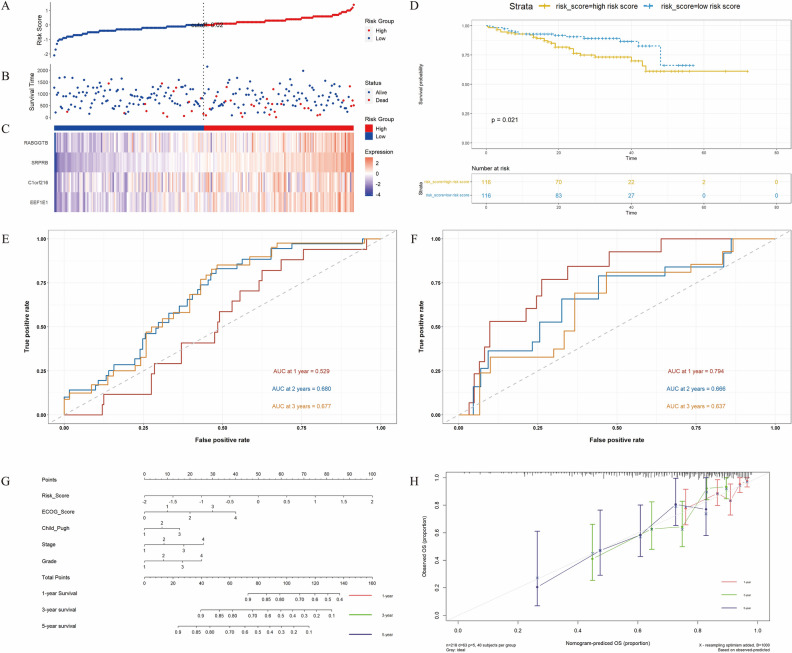
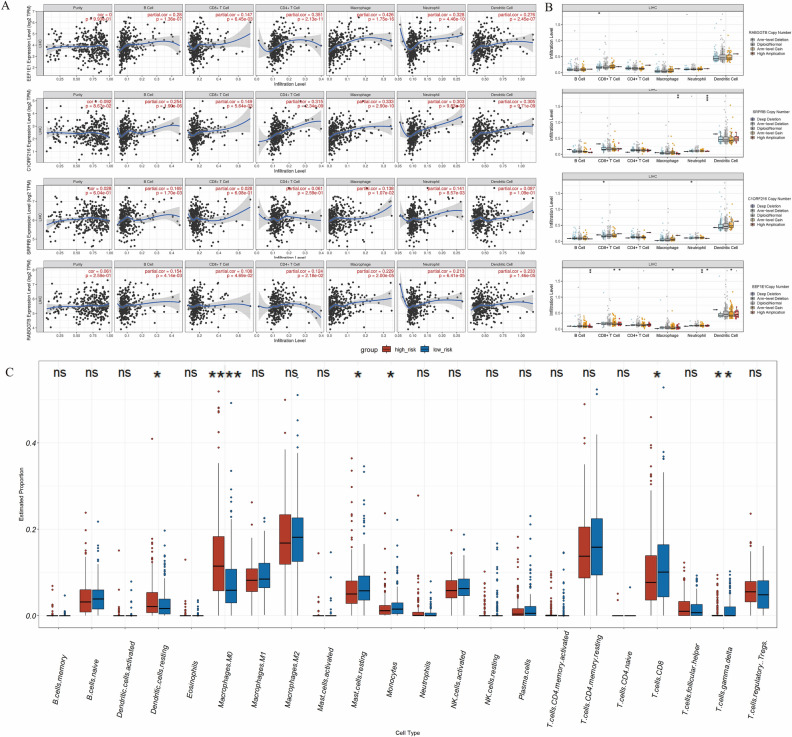
Satellite nodules is a key clinical characteristic which has prognostic value of hepatocellular carcinoma (HCC). Currently, there is no gene-level predictive model for Satellite nodules in liver cancer. For the 377 HCC cases collected from the dataset of Cancer Genome Atlas (TCGA), their original pathological data were analyzed to extract information regarding satellite nodules status as well as other relevant pathological data. Then, this study employed statistical modeling for prognostic model establishment in TCGA, and validation in International Cancer Genome Consortium (ICGC) cohorts and GSE76427. Through rigorous statistical analyses, 253 differential satellite nodules-related genes (SNRGs) were identified, and four key genes related to satellite nodules and prognosis were selected to construct a prognostic model. The high-risk group predicted by our model exhibited an unfavorable overall survival (OS) outlook and demonstrated an association with adverse worse clinical characteristics such as larger tumor size, higher alpha-fetoprotein, microvascular invasion and advanced stage. Moreover, the validation of the model's prognostic value in the ICGC and GSE76427 cohorts mirrored that of the TCGA cohort. Besides, the high-risk group also showed higher levels of resting Dendritic cells, M0 macrophages infiltration, alongside decreased levels of CD8+ T cells and γδT cells infiltration. The prognostic model based on SNRGs can reliability predict the OS of HCC and is likely to have predictive value of immunotherapy for HCC.

Keywords: Hepatocellular carcinoma; Prognostic model; Satellite nodules; Satellite nodules-related genes; Tumor-infiltrating lymphocytes.


Conflict of interest statement

The authors declare no competing interests.

Figures

Figure 1
Figure 1
The DEGs and functional analysis. (A) The heatmap and the volcano plot of DEGs between HCC tissues with satellite nodules and paracancerous normal tissues. (B) The heatmap and the volcano plot of DEGs between HCC tissues without satellite nodules and paracancerous normal tissues. (C) The upset diagram of DEGs between HCC with satellite nodules and HCC without satellite nodules. (D) Kyoto Encyclopedia of Genes and Genomes (KEGG) analysis. The length of each column represents the count of genes. (E) Gene Ontology (GO) enrichment analysis. The size of each circle represents the count of genes; the shade of color represents the p value.
Figure 2
Figure 2
Construction and evaluation prognostic model based on SNRGs in TCGA cohort. (A) 8 SNRGs significantly associated with OS and satellite nodules of patients with HCC. (B) Kaplan–Meier plot for OS and DFS in high- or low-risk group stratified by 8 SNRGs (p = 0.000037 and p = 0.0024 respectively). (C) The result of LASSO regression for 8 SNRGs. (D) The risk score of each patient with HCC. (E) The patient survival based on the risk score. (F) The heat map of the three SNRGs in the high-risk group and the low-risk group. (G) Kaplan–Meier plot for DFS and OS in high or low risk group based on prognostic model (p = 0.021 and p = 0.00024 respectively). (F) Receiver operating characteristic (ROC) curve analysis for the prognostic value of the prognostic model for 1, 3and 5 years survival. Data from TCGA (median risk score as the cut-off value). AUC: area under the curve.
Figure 3
Figure 3
The correlation between the respective expression levels of the four SNRGs and the DFS and OS. (A) The Kaplan–Meier plot between the expression level of C1orf216 and DFS and OS in patients with HCC (p = 0.078 and p = 0.0012, respectively). (B) The Kaplan–Meier plot between the expression level of EEF1E1 and DFS and OS in patients with HCC (p = 0.071 and p = 0.01, respectively). (C) The Kaplan–Meier plot between the expression level of RABGGTB and DFS and OS in patients with HCC (p = 0.0014 and p = 0.0055, respectively). (D) The Kaplan–Meier plot between the expression level of SRPRB and DFS and OS in patients with HCC (p = 0.036 and p = 0.0036, respectively).
Figure 4
Figure 4
The correlation for pathobiochemical hallmarks of HCC and 4 SNRGs. (A) The correlation between gene expression and tissue type (NT: normal tissue, TP: primary tumor). (B)The correlation between gene expression and tumor with or without satellite nodules (N: without, Y: with). (C) The correlation between gene expression and tumor size. (D) The correlation between gene expression and AFP level. (E) The correlation between gene expression and MVI status (0: without MVI, 1: with MVI). (F) The correlation between gene expression and ECOG status (≤ 1 vs. ≥ 2). (G) The correlation between gene expression and tumor grade (G1 + G2 vs. G3 + G4), T stage (T1 + T2 vs. T3 + T4) and clinical stage (I + II vs. III + IV). (H) The correlation between risk score and tumor grade (G1 + G2 vs. G3 + G4), T stage (T1 + T2 vs. T3 + T4) and clinical stage (I + II vs. III + IV). NS: not significant; *p < 0.05, **p < 0.01, ***p < 0.001, ****p < − 0.0001.
Figure 5
Figure 5
Validity of model in public datasets and optimization of model. (A) The risk score of each patient with HCC. (B) The patient survival based on the risk score. (C) The heat map of the three SNRGs in the high-risk group and the low-risk group. (D) The Kaplan–Meier plot of patients in a low- or high-risk group (P = 0.021), and the number of patients in different risk groups. (E) ROC curve analysis for the prognostic value of the prognostic model for different years. Data from ICGC (median risk score as the cut-off value). (F) ROC curve analysis for the prognostic value of the prognostic model for different years. Data from GSE76427 (median risk score as the cut-off value). (G) Nomogram model, with c-index = 0.708 (95% CI 0.645, 0.770). (H) The calibration curve of the nomogram model. Data from TCGA.
Figure 6
Figure 6
The correlation between immune infiltration and SNRGs: (A) the correlation between the expression of four SNRGs and immune infiltration. (B) the correlation between copy number of four SNRGs and immune infiltration. (C) the correlation between risk score and immune infiltration.

Similar articles

Cited by

References

    1. Ladd AD, et al. Mechanisms of drug resistance in HCC. Hepatology. 2023;79(4):926–940. doi: 10.1097/HEP.0000000000000237. - DOI - PubMed
    1. Toh MR, et al. Global epidemiology and genetics of hepatocellular carcinoma. Gastroenterology. 2023;164(5):766–782. doi: 10.1053/j.gastro.2023.01.033. - DOI - PubMed
    1. Lawrence MS, et al. Mutational heterogeneity in cancer and the search for new cancer-associated genes. Nature. 2013;499(7457):214–218. doi: 10.1038/nature12213. - DOI - PMC - PubMed
    1. Tripathy A, et al. The molecular connection of histopathological heterogeneity in hepatocellular carcinoma: A role of Wnt and Hedgehog signaling pathways. PLoS One. 2018;13(12):e0208194. doi: 10.1371/journal.pone.0208194. - DOI - PMC - PubMed
    1. McGranahan N, Swanton C. Biological and therapeutic impact of intratumor heterogeneity in cancer evolution. Cancer Cell. 2015;27(1):15–26. doi: 10.1016/j.ccell.2014.12.001. - DOI - PubMed

Publication types

Substances