. 2024 Jul 7;15(1):5699.
doi: 10.1038/s41467-024-50067-9.

Genetic diversity, determinants, and dissemination of Burkholderia pseudomallei lineages implicated in melioidosis in Northeast Thailand

Affiliations

Genetic diversity, determinants, and dissemination of Burkholderia pseudomallei lineages implicated in melioidosis in Northeast Thailand

Rathanin Seng et al. Nat Commun. .

Abstract

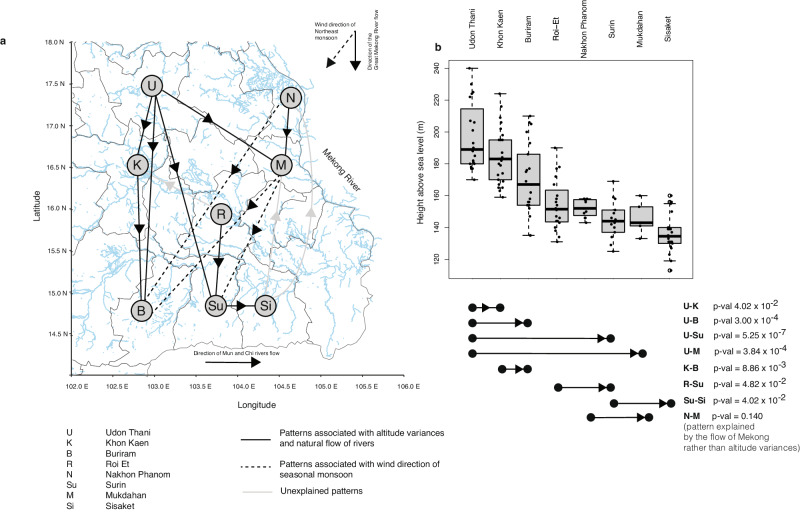
Melioidosis is an often-fatal neglected tropical disease caused by an environmental bacterium Burkholderia pseudomallei. However, our understanding of the disease-causing bacterial lineages, their dissemination, and adaptive mechanisms remains limited. To address this, we conduct a comprehensive genomic analysis of 1,391 B. pseudomallei isolates collected from nine hospitals in northeast Thailand between 2015 and 2018, and contemporaneous isolates from neighbouring countries, representing the most densely sampled collection to date. Our study identifies three dominant lineages, each with unique gene sets potentially enhancing bacterial fitness in the environment. We find that recombination drives lineage-specific gene flow. Transcriptome analyses of representative clinical isolates from each dominant lineage reveal increased expression of lineage-specific genes under environmental conditions in two out of three lineages. This underscores the potential importance of environmental persistence for these dominant lineages. The study also highlights the influence of environmental factors such as terrain slope, altitude, and river direction on the geographical dispersal of B. pseudomallei. Collectively, our findings suggest that environmental persistence may play a role in facilitating the spread of B. pseudomallei, and as a prerequisite for exposure and infection, thereby providing useful insights for informing melioidosis prevention and control strategies.


Conflict of interest statement

The authors declare no competing interests.

Figures

Fig. 1
Fig. 1. Distribution of B. pseudomallei genomes used in this study.
a Geographical representation of the countries and provinces sampled for the 1391 B. pseudomallei genomes used in this study. Pie-chart summarises the proportion of dominant lineage 1, 2, and 3 presented at each location with the chart size proportional to the number of the samples collected b An unrooted phylogenetic tree colour-coded by dominant lineages c Boxplots summarising the pairwise core genome SNP distances among isolates in this study are shown on a logarithmic scale. The distributions are depicted for the entire population, each dominant lineage and its sub-lineages. Each boxplot presents the minimum, first quartile, median, third quartile, and maximum data points. The number of pairs in each boxplot ranges from 105 to 968136, which corresponds to the smallest group combination of C (15, 2) in sub-lineage 1.4, and the pair combination of the entire population and an Australian outgroup C (1392, 2). The difference in pairwise SNP distributions between isolates clustered across different lineages within the entire population and those clustered within each defined lineage was calculated using a two-sided Mann–Whitney U test. d Histogram depicting the distribution of clinical B. pseudomallei isolates from the northeast Thailand cohort throughout 2015–2018 sampling period. For (ad), isolates are colour-coded: lineage 1 and sub-lineage 1.1–1.4 in green, lineage 2 and sub-lineage 2.1–2.4 in red, lineage 3 and sub-lineage 3.1–3.2 in purple, and other lineages in grey. In (d), the shaded blue and white areas represent the wet and dry seasons in northeast Thailand, respectively.
Fig. 2
Fig. 2. Dissemination patterns in Northeast Thailand.
a Province-to-province transmission patterns potentially influenced by northeast Thailand geographical landscape. Nodes present provinces, denoted by abbreviation and ordered by average altitude: U Udon Thani, K Khon Kaen, B Buriram, R Roi Et, N Nakhon Phanom, Su Surin, M Mukdahan, and Si Sisaket. Rivers are depicted in blue with major rivers including the Great Mekong River, the Chi River, and the Mun River and their flow direction annotated. Only transmission patterns consistently observed in at least two out of three dominant lineages are shown. b Distribution of the terrain height for each province in meters above sea level. Each dot represents the height of the district where patients lived, indicating the closest source of bacterial acquisition. Each boxplot presents the minimum, first quartile, median, third quartile, and maximum data points. Sample size for each province are as follows: Udon Thani (n = 20), Khon Kaen (n = 25), Buriram (n = 21), Roi Et (n = 20), Nakhon Phanom (n = 11), Surin (n = 14), Mukdahan (n = 5) and Sisaket (n = 22). The northwest provinces have higher altitudes, which gradually decline towards the southeast. This province-to-province pattern is confirmed by a one-sided Mann–Whitney U test, with p-values annotated on the figure. For (a) and (b) solid arrows illustrating transmission directionality possibly explained by altitude differences. Dotted arrows represent transmission directionality potentially influenced by northeast monsoon winds. Grey arrows signify patterns with unclear explanation.
Fig. 3
Fig. 3. Dominant lineage-specific genes and their gene ontology (GO terms).
a The heatmap represents lineage-specific genes (right) detected in each isolate, aligned with the phylogeny (left). Lineage-specific genes shared across multiple dominant lineages are highlighted in yellow. Lineage-specific genes from lineage 1, 2, 3 are coloured in green, red, and purple, respectively. Additionally, the colour stripes provide information on the lineage and sub-lineage membership (b) Bar plots displays the frequency of GO annotations of lineage-specific genes in each dominant lineage categorised by biological process, molecular function, and cellular compartment. The pie-charts summarise the proportion of lineage-specific genes with assigned GO terms (black).
Fig. 4
Fig. 4. Transcriptome analysis of representative strains: K96243 (lineage 1), UKMD286 (lineage 2) and UKMH10 (lineage 3).
ac Volcano plots demonstrate differential gene expression (DGE) between environmental and infection conditions. a Based on microarray data, RNA probes with significant changes were identified using two-sided t-test with multiple test corrections via limma. b, c Based on RNAseq data, significant changes in RNAs were identified using two-sided Wald test with multiple testing corrections performed by DESeq2. Vertical dotted lines represent the statistical cut-off at an absolute value of log2 fold change > 2, while horizontal dotted lines display the statistical cut-off at the adjusted p-value of 0.05 on a negative log10 scale. d Binary expression profile of lineage-1-specific genes across different conditions. Tested conditions are as follows: Alkaline & acid: alkaline solution (K9pH7) and acidic solution (K9pH4); Amino acid supplement: mid-logarithmic phase in free sulfur source (K9NaSO4ML), early stationary phase in free sulfur source (K9NaSO4ES), mid-logarithmic phase in amino acid sulfur source (K9TaurineML), and early stationary phase in amino acid sulfur source (K9TaurineES); Anaerobic condition: 1-week aerobic culture (K9Aer1 wk), 1-week anaerobic culture (K9Anaer1 wk), 2-week aerobic culture (K9Aer2 wks), and 2-week anaerobic culture (K9Anaer2 wks); Antibiotic treatment: medium without antibiotics (K9MHB), bacteriocidal antibiotic (K9Ceft), and bacteriostatic antibiotic (K9Chlamp); Desiccation and rehydration: hydrated bacterial pellet (K9DesRef), desiccated bacterial pellet (K9Des24 hrs), and rehydrated bacterial pellet (K9Revived); Divalent cation supplement: chelated medium (K91XTSBDCML), Ca2+ exposure (K9Ca2+ML), Mg2+ exposure (K9Mg2+ML), Cu2+ exposure (K9Cu2+ML), Mn2+ exposure (K9Mn2+ML), and Zn2+ exposure (K9Zn2+ML); General Growth: stationary phase in rich media (K9LBS), mid-logarithmic phase in rich media (K9LBML), early stationary phase in rich media (K9LBES), mid-logarithmic phase in minimal media (K9CDMML), early stationary phase in minimal media (K9CDMES), and bacterial lawn (K9Plate); Heavy metal: chelated medium (K91XTSBDC24 hrs), Cd2+ exposure (K9Cd2+24 hrs), Pb2+ exposure (K9Pb2+24 hrs), Ni2+ exposure (K9Ni2+24 hrs), and Al3+ exposure (K9Al3+24 hrs); Human factors supplement: saline (K91XDPBS16 hrs), insulin (K9Insulin), and normal human serum (K930NHS); In vivo infection: murine infection (K9BALBcLungs); Iron supplement: mid-logarithmic phase with Fe3+ exposure (K9Fe3+ML), and stationary phase with Fe3+ exposure (K9Fe3+24 hrs); Nutrient depletion: early exposure to usual nutrients (K9H201href), long exposure to usual nutrients (K9H2024hrsref), initial response to nutrient deprivation (K9H201 hr), and long response to nutrient deprivation (K9H2024 hrs); Osmotic stress: normal osmolarity (K9OsmRef), high salinity (K92MnaCl), and high osmolarity (K92Msorbitol); Oxidative stress: normal growth without hydrogen peroxide (K9H202ref), hydrogen peroxide (K9H2O210 mins), normal growth without sodium hypochloride (K9ChemRef), and sodium hypochloride (K9Bleach); Temperature stress: initial response to cold stress (K904C30 mins), overnight incubation under cold stress (K904C16 hrs), initial response to ambient temperature (K928C30 mins), overnight incubation under ambient temperature (K928C16 hrs), initial response to body temperature (K937C30 mins), overnight incubation under body temperature (K937C16 hrs), initial response to heat stress (K942C30 mins), and overnight incubation under heat stress (K942C16 hrs); UV irradiation: 10-min under fluorescent light (K9UV10 minsref), 1-hour under fluorescent light (K9UV1hrref), 10-min under UV irradiation (K9UV10 mins), and 1-hour under UV irradiation (K9UV1 hr). A star denotes significant differences in the gene expression profile of lineage-1-specific genes compared the remaining genes of strain K96243 (adjust p-value = 5.72 × 10−3, one-sided Fisher’s exact test with Benjamini-Hochberg correction for multiple testing).

Update of

References

    1. Limmathurotsakul, D. et al. Predicted global distribution of Burkholderia pseudomallei and burden of melioidosis. Nat. Microbiol.1, 15008 (2016). - PubMed
    1. Birnie, E. et al. Global burden of melioidosis in 2015: a systematic review and data synthesis. Lancet Infect. Dis.19, 892–902 (2019). - PMC - PubMed
    1. Mohapatra, P. R. & Mishra, B. Burden of melioidosis in India and South Asia: challenges and ways forward. Lancet Reg. Health Southeast Asia2, 100004 (2022). - PMC - PubMed
    1. Zheng, X., Xia, Q., Xia, L. & Li, W. Endemic melioidosis in Southern China: past and present. TropicalMed4, 39 (2019). - PMC - PubMed
    1. Tran, Q. T. L. et al. Child melioidosis deaths caused by Burkholderia pseudomallei—contaminated borehole water, Vietnam, 2019. Emerg. Infect. Dis.28, 1689–1693 (2022). - PMC - PubMed

LinkOut - more resources