. 2024 Jul 7;14(1):15635.
doi: 10.1038/s41598-024-66433-y.

The role and mechanism of action of miR-483-3p in mediating the effects of IGF-1 on human renal tubular epithelial cells induced by high glucose

Affiliations

The role and mechanism of action of miR-483-3p in mediating the effects of IGF-1 on human renal tubular epithelial cells induced by high glucose

Maidina Abudoureyimu et al. Sci Rep. .

Abstract

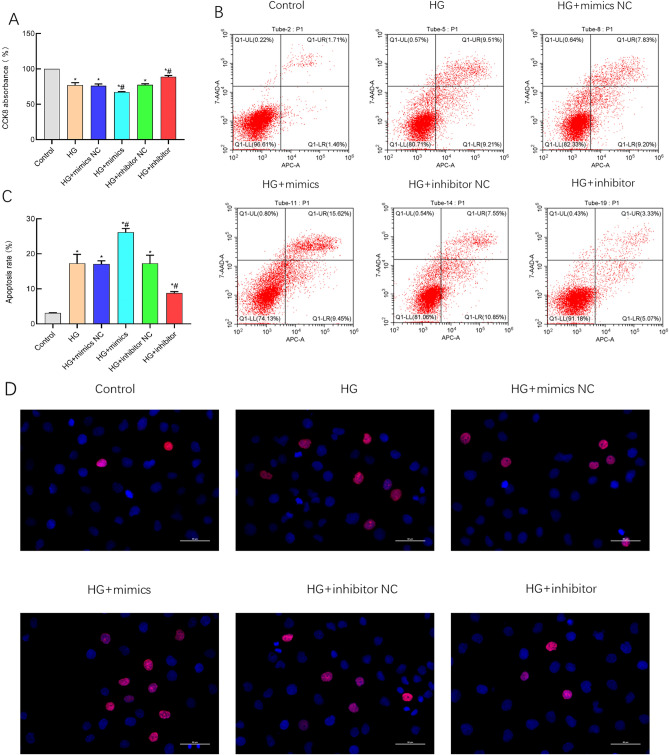
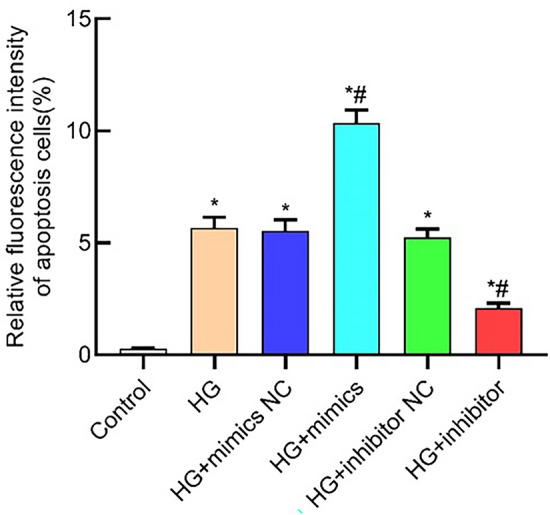
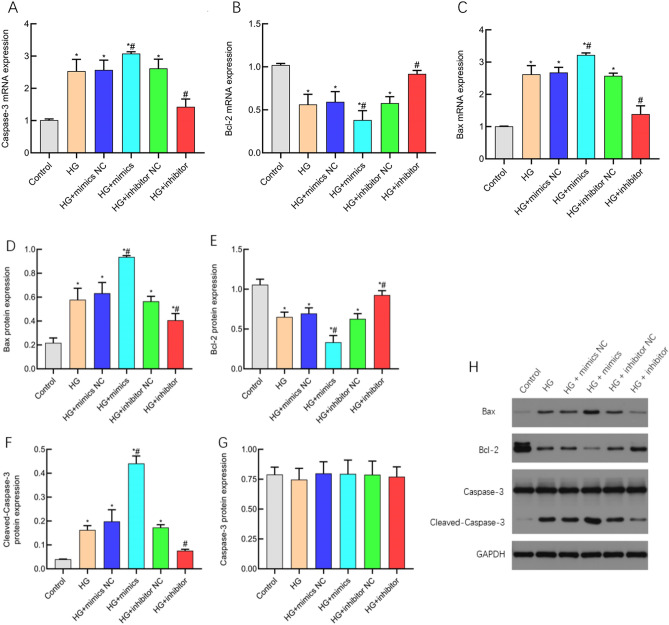
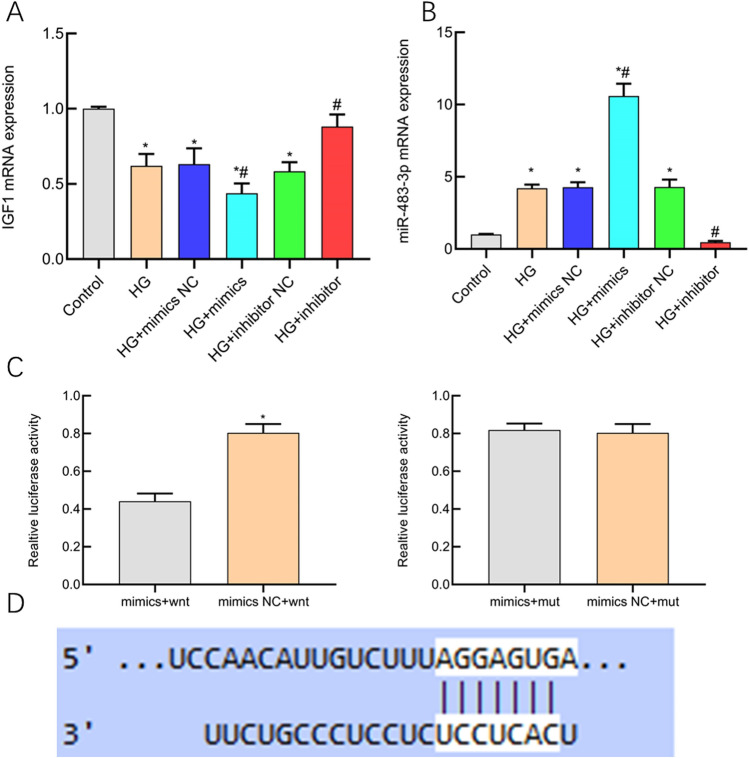
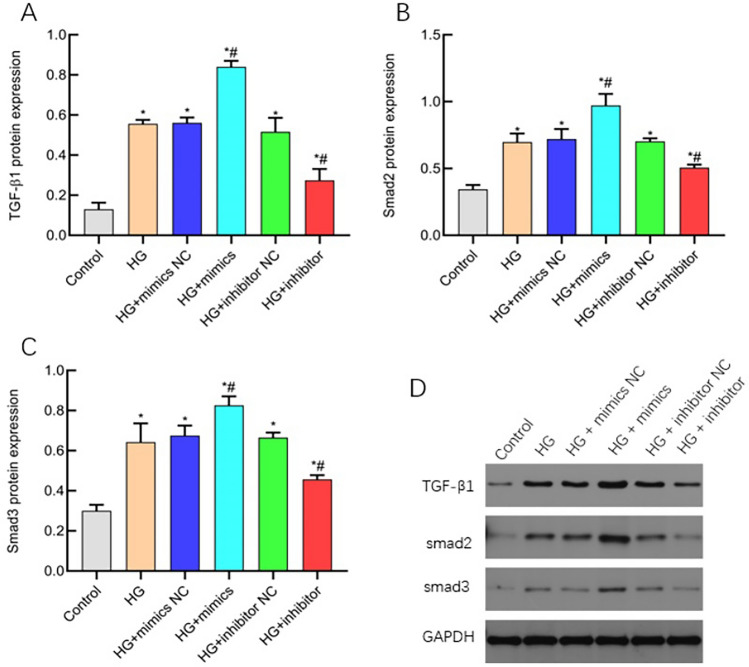
This study aimed to elucidate the influence of miR-483-3p on human renal tubular epithelial cells (HK-2) under high glucose conditions and to understand its mechanism. Human proximal tubular epithelial cells (HK-2) were exposed to 50 mmol/L glucose for 48 h to establish a renal tubular epithelial cell injury model, denoted as the high glucose group (HG group). Cells were also cultured for 48 h in a medium containing 5.5 mmol/L glucose, serving as the low glucose group. Transfection was performed in various groups: HK-2 + low glucose (control group), high glucose (50 mM) (HG group), high glucose + miR-483-3p mimics (HG + mimics group), high glucose +miR-483-3p inhibitor (HG + inhibitor group), and corresponding negative controls. Real-time quantitative polymerase chain reaction (qPCR) assessed the mRNA expression of miR-483-3p, bax, bcl-2, and caspase-3. Western blot determined the corresponding protein levels. Proliferation was assessed using the CCK-8 assay, and cell apoptosis was analyzed using the fluorescence TUNEL method. Western blot and Masson's staining were conducted to observe alterations in cell fibrosis post miR-483-3p transfection. Furthermore, a dual-luciferase assay investigated the targeting relationship between miR-483-3p and IGF-1. The CCK8 assay demonstrated that the HG + mimics group inhibited HK-2 cell proliferation, while the fluorescent TUNEL method revealed induced cell apoptosis in this group. Conversely, the HG + inhibitor group promoted cell proliferation and suppressed cell apoptosis. The HG + mimics group upregulated mRNA and protein expression of pro-apoptotic markers (bax and caspase-3), while downregulating anti-apoptotic marker (bcl-2) expression. In contrast, the HG + inhibitor group showed opposite effects. Collagen I and FN protein levels were significantly elevated in the HG + mimics group compared to controls (P < 0.05). Conversely, in the HG + inhibitor group, the protein expression of Collagen I and FN was notably reduced compared to the HG group (P < 0.05). The dual luciferase reporter assay confirmed that miR-483-3p could inhibit the luciferase activity of IGF-1's 3'-UTR region (P < 0.05). miR-483-3p exerts targeted regulation on IGF-1, promoting apoptosis and fibrosis in renal tubular epithelial cells induced by high glucose conditions.

Keywords: High glucose; IGF-1; Kidney injury; Renal tubular epithelial cells; miR-483-3p.


Conflict of interest statement

The authors declare no competing interests.

Figures

Figure 1
Figure 1
Suppression of cell proliferation and induction of apoptosis by miR-483-3p. (A) Analysis results from CCK-8 assay; (B) Results of flow cytometry apoptosis detection; (C) Flow cytometry apoptosis analysis chart; (D) Original Tunel image. *represents significant difference from the Control group, P < 0.05; #represents significant difference from the HG group, P < 0.05.
Figure 2
Figure 2
Analysis result of tunel image.
Figure 3
Figure 3
miR-483-3p induces the expression of pro-apoptotic factors, suppresses the expression of anti-apoptotic factors, and promotes cellular apoptosis. The horizontal axis represents cellular groups, and the vertical axis represents molecular expression levels. (A) Analysis of caspase-3 mRNA; (B) Analysis of bcl-2 mRNA; (C) Analysis of bax mRNA; (D) Analysis of bax protein; (E) Analysis of bcl-2 protein; (F) Analysis of cleaved-caspase-3 protein; (G) Analysis of caspase-3 protein; (H) Original western bolt image. *represents significant difference from the control group, P < 0.05; #represents significant difference from the HG group, P < 0.05.
Figure 4
Figure 4
miR-483-3p induced fibrosis in HK-2 Cells. X-axis represents cell groups; Y-axis represents molecular expression levels. (A) Collagen I protein analysis chart; (B) E-cadherin protein analysis chart; (C) Original western blot image; (D) Original Masson’s staining image. *represents significant difference from the control group, P < 0.05; #represents significant difference from the HG group, P < 0.05.
Figure 5
Figure 5
The study employed dual-luciferase reporter gene assays and real-time quantitative PCR to investigate the regulatory correlation between miR-483-3p and IGF1. The findings revealed that the miR-483-3p level in the HG + mimics group was significantly higher than in the control group and the HG group (P < 0.05), while IGF1 was significantly lower than in the control group and the HG group (P < 0.05). In the HG + inhibitor group, the miR-483-3p level was significantly lower than in the HG group (P < 0.05), and IGF1 was significantly higher than in the HG group (P < 0.05) (A,B). The dual-luciferase reporter gene results confirmed a negative regulatory relationship between miR-483-3p and IGF1 (P < 0.05) (C,D). These data suggest that miR-483-3p and IGF1 exhibit a targeted negative regulatory relationship.
Figure 6
Figure 6
miR-483-3p plays a biological role in regulating TGF-β/smad signaling pathway. The horizontal coordinate is cell grouping, and the vertical coordinate is molecular expression. (A) TGF-β1 protein analysis; (B) Protein analysis of smad2; (C) smad3 protein analysis diagram; (D) Western blot of the original glue running. *indicates the difference between the Control group and the control group, P < 0.05; #indicates the difference between HG group and Hg group, P < 0.05.

References

    1. Rossing P, Persson F, Frimodt-Møller M. Prognosis and treatment of diabetic nephropathy: Recent advances and perspectives. Nephrol. Ther. 2018;14(1):S31–s37. doi: 10.1016/j.nephro.2018.02.007. - DOI - PubMed
    1. Satirapoj B, Pooluea P, Nata N, Supasyndh O. Urinary biomarkers of tubular injury to predict renal progression and end stage renal disease in type 2 diabetes mellitus with advanced nephropathy: A prospective cohort study. J. Diabetes Complicat. 2019;33:675–681. doi: 10.1016/j.jdiacomp.2019.05.013. - DOI - PubMed
    1. He M, et al. miR-483 targeting of CTGF suppresses endothelial-to-mesenchymal transition: Therapeutic implications in Kawasaki disease. Circ. Res. 2017;120:354–365. doi: 10.1161/circresaha.116.310233. - DOI - PMC - PubMed
    1. Zhang J, et al. MicroRNA-483 amelioration of experimental pulmonary hypertension. EMBO Mol. Med. 2020;12:e11303. doi: 10.15252/emmm.201911303. - DOI - PMC - PubMed
    1. Kuschnerus K, et al. Increased expression of miR-483-3p impairs the vascular response to injury in type 2 diabetes. Diabetes. 2019;68:349–360. doi: 10.2337/db18-0084. - DOI - PubMed

MeSH terms

LinkOut - more resources