. 2024 Jul 7;10(1):314.
doi: 10.1038/s41420-024-02087-z.

Inhibition of PKC-δ retards kidney fibrosis via inhibiting cGAS-STING signaling pathway in mice

Affiliations

Inhibition of PKC-δ retards kidney fibrosis via inhibiting cGAS-STING signaling pathway in mice

Dongyun Wang et al. Cell Death Discov. .

Abstract

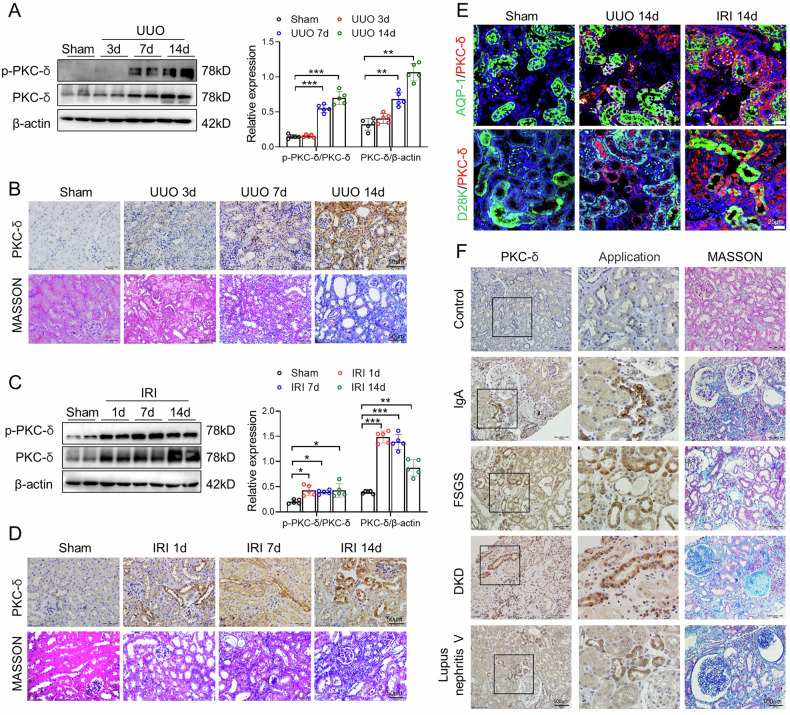
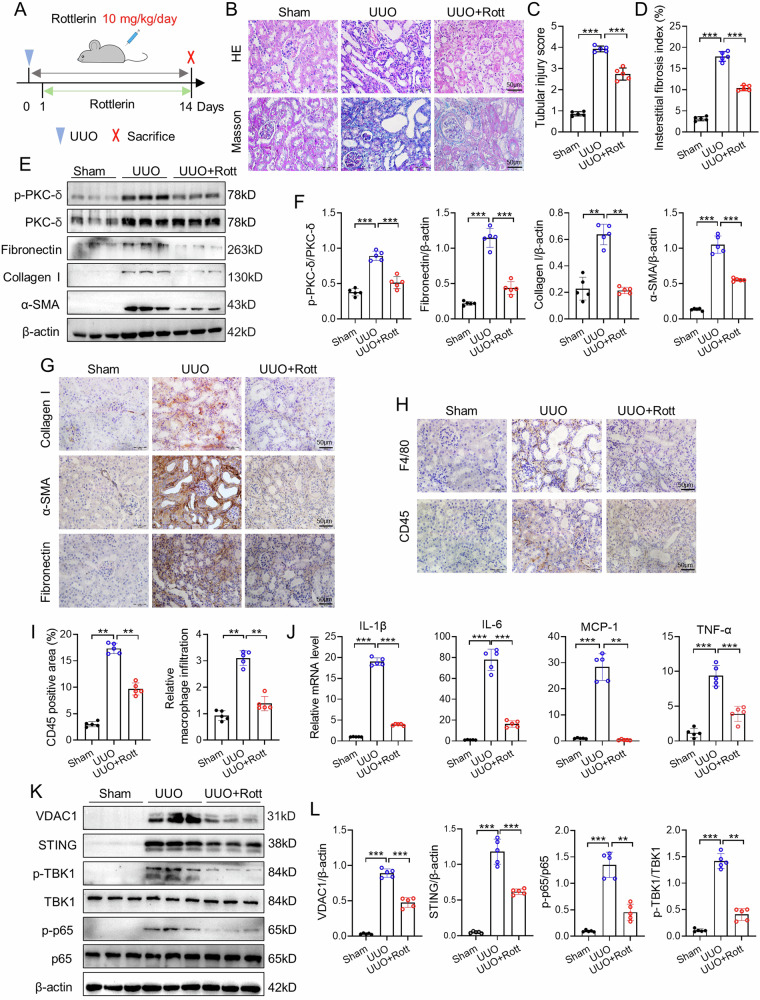
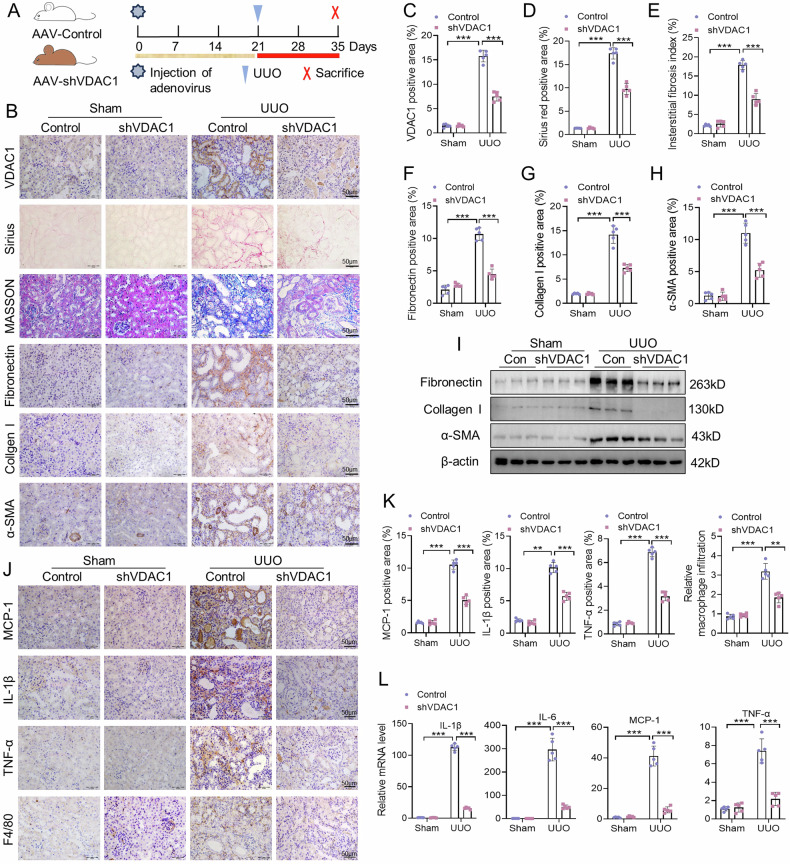
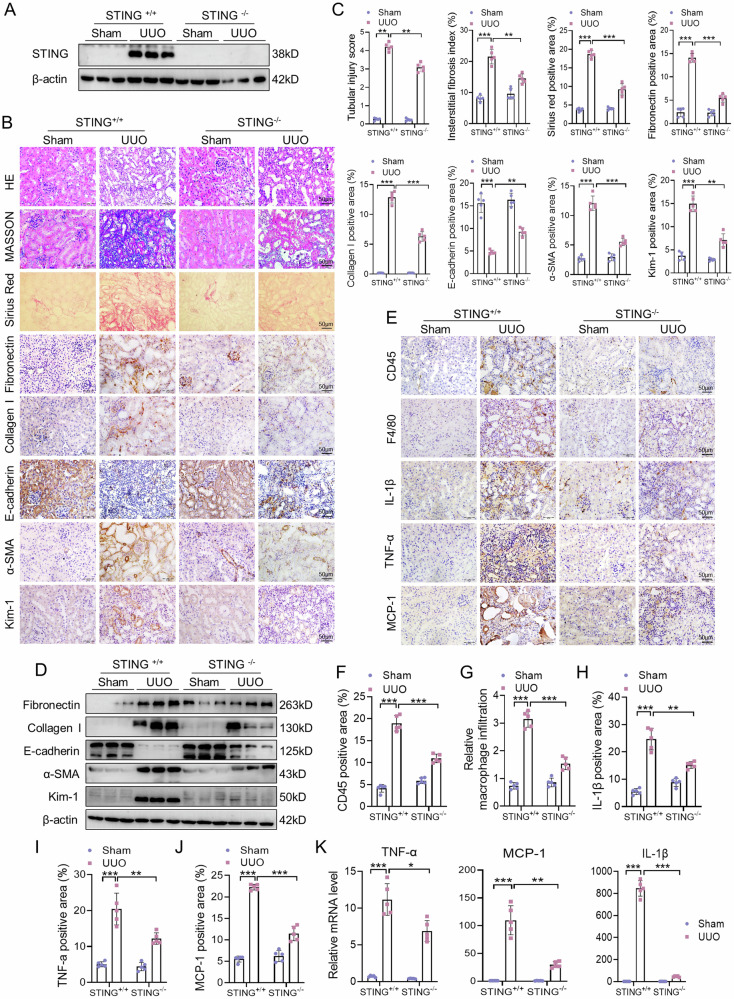
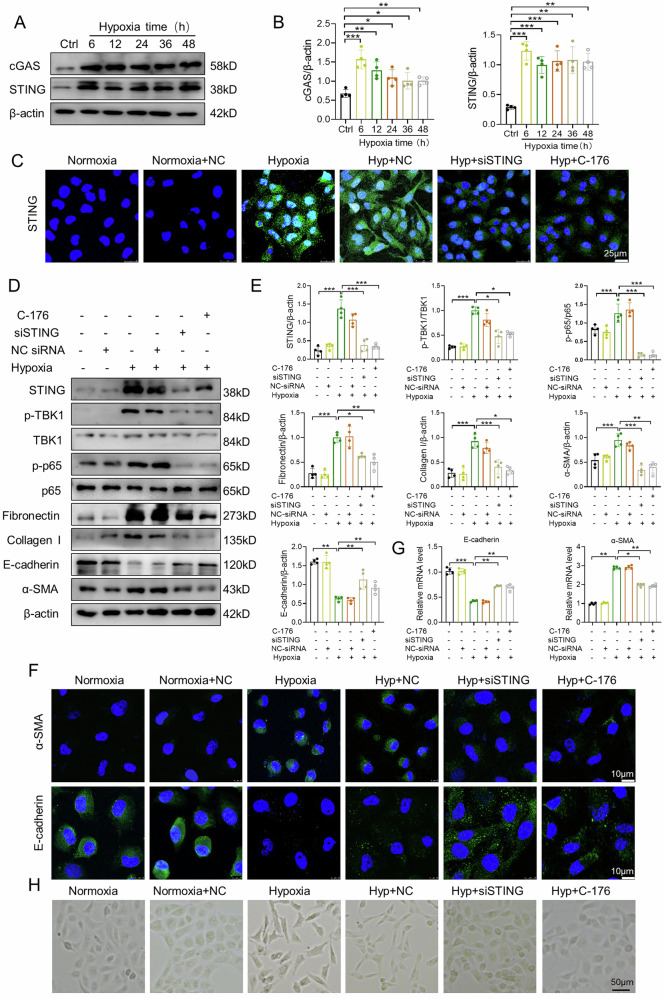
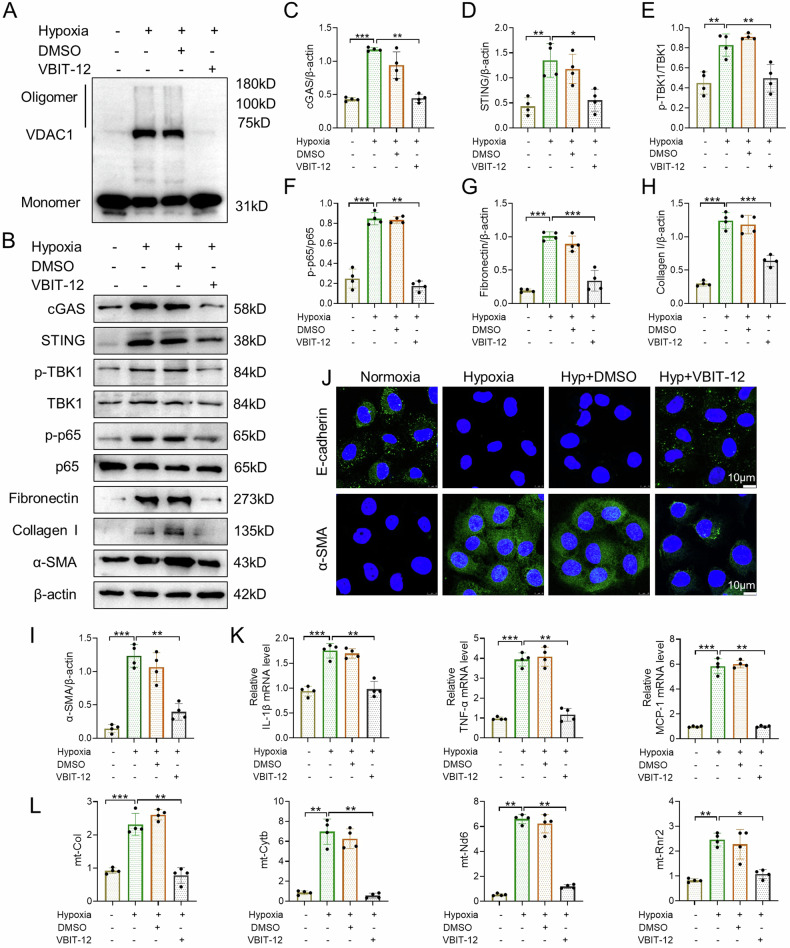
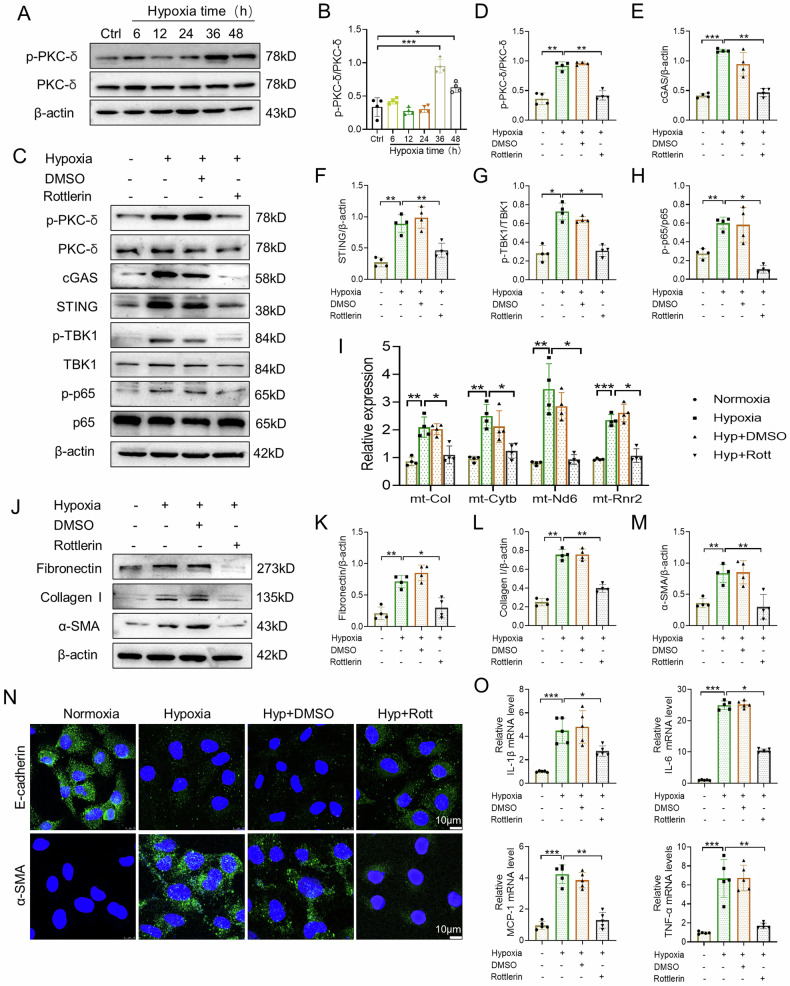
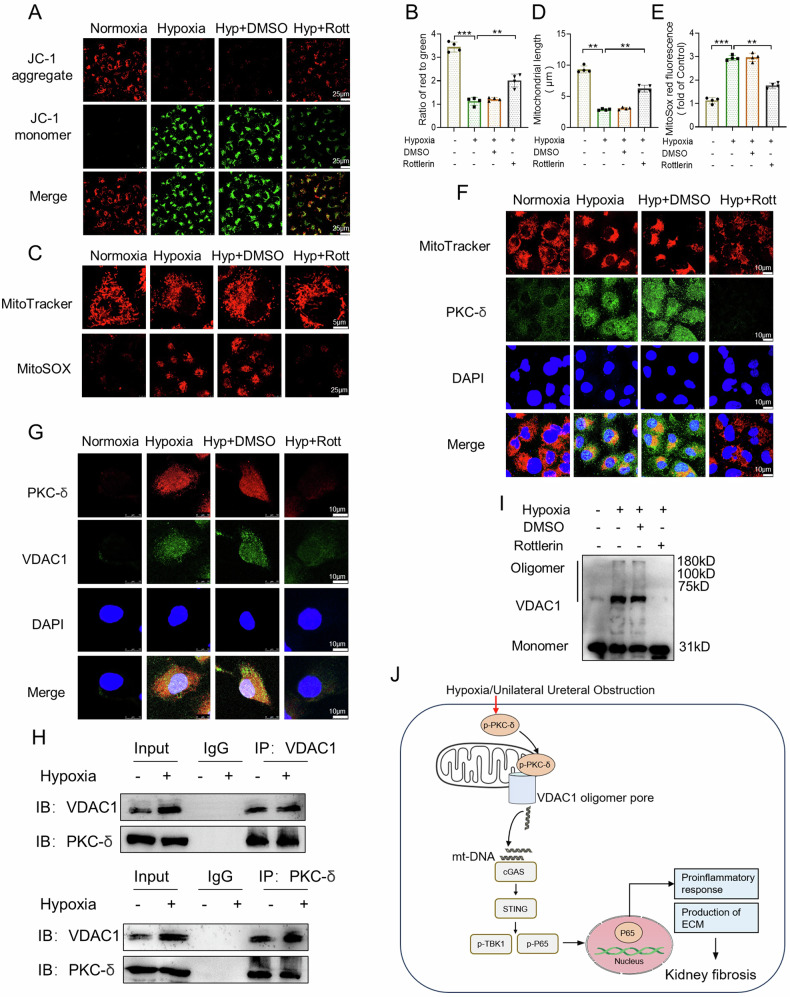
Kidney fibrosis is considered to be the ultimate aggregation pathway of chronic kidney disease (CKD), but its underlying mechanism remains elusive. Protein kinase C-delta (PKC-δ) plays critical roles in the control of growth, differentiation, and apoptosis. In this study, we found that PKC-δ was highly upregulated in human biopsy samples and mouse kidneys with fibrosis. Rottlerin, a PKC-δ inhibitor, alleviated unilateral ureteral ligation (UUO)-induced kidney fibrosis, inflammation, VDAC1 expression, and cGAS-STING signaling pathway activation. Adeno-associated virus 9 (AAV9)-mediated VDAC1 silencing or VBIT-12, a VDAC1 inhibitor, attenuated renal injury, inflammation, and activation of cGAS-STING signaling pathway in UUO mouse model. Genetic and pharmacologic inhibition of STING relieved renal fibrosis and inflammation in UUO mice. In vitro, hypoxia resulted in PKC-δ phosphorylation, VDAC1 oligomerization, and activation of cGAS-STING signaling pathway in HK-2 cells. Inhibition of PKC-δ, VDAC1 or STING alleviated hypoxia-induced fibrotic and inflammatory responses in HK-2 cells, respectively. Mechanistically, PKC-δ activation induced mitochondrial membrane VDAC1 oligomerization via direct binding VDAC1, followed by the mitochondrial DNA (mtDNA) release into the cytoplasm, and subsequent activated cGAS-STING signaling pathway, which contributed to the inflammation leading to fibrosis. In conclusion, this study has indicated for the first time that PKC-δ is an important regulator in kidney fibrosis by promoting cGAS-STING signaling pathway which mediated by VDAC1. PKC-δ may be useful for treating renal fibrosis and subsequent CKD.


Conflict of interest statement

The authors declare no competing interests.

Figures

Fig. 1
Fig. 1. PKC-δ expression is upregulated in fibrotic kidneys.
A Representative PKC-δ and p-PKC-δ western blot images and quantitation in kidneys at 3, 7 and 14 days after UUO (n = 5). B Representative images of immunochemistry staining of PKC-δ and Masson staining in kidneys of sham and UUO model. Bar = 50 μm. C Representative PKC-δ and p-PKC-δ western blot images and quantitation in kidneys at day 1, 7 and 14 after ischemia/reperfusion injury (IRI) (n = 5). D Representative images of immunochemistry staining of PKC-δ and Masson staining in sham and I/R-treated mouse kidneys. Bar = 50 μm. E Representative images of co-expression of PKC-δ and AQP-1, and co-expression of PKC-δ and calbindin-D28k in kidneys of Sham, UUO and IRI mice. Bar = 25 μm. F Representative images of immunochemistry staining of PKC-δ and Masson staining in Control, IgA, FSGS, DKD and Lupus nephritis V human kidney specimens. Bar = 100 μm. *P < 0.05, **P < 0.01, ***P < 0.001.
Fig. 2
Fig. 2. Inhibition of PKC-δ activation ameliorates kidney fibrosis, inflammation, VDAC1 expression and cGAS-STING pathway in UUO mice.
The mice were randomly separated into the Sham, UUO and UUO+Rottlerin groups. A Schematic diagram of the experimental design: wild-type C57BL/6 mice were performed UUO surgery and treated with PKC-δ inhibitor (Rottlerin) for 13 days. The gray left and right double arrows indicate 14 days after UUO surgery, the green arrowheads indicate the injections of Rottlerin (10 mg/kg body weight). BD Representative images of H&E staining and Masson staining in kidneys of the three groups, and corresponding quantitative analyses (n = 5). Bar = 50 μm. E, F Representative PKC-δ, p-PKC-δ, collagen I, fibronectin and α-SMA western blot images and quantitation in kidneys (n = 5). G, H Representative images of IHC staining of collagen I, α-SMA, fibronectin, F4/80 and CD45 in kidneys of the three groups (n = 5). Bar = 50 μm. I Quantitative data showing IHC staining of F4/80 and CD45 (n = 5). J Relative mRNA levels of IL-6, IL-1β, TNF-α, and MCP-1 in kidneys of the three groups (n = 5). K, L Western blot and quantitative data showing the protein levels of VDAC1, STING, p-TBK1, TBK1, p-p65 and p65 in kidneys of the three groups (n = 5). Data are presented as mean ± SEM. **P < 0.01, ***P < 0.001.
Fig. 3
Fig. 3. Inhibition of VDAC1 attenuates UUO-induced renal fibrosis, inflammation and cGAS-STING pathway activation.
The mice were randomly separated into the Sham+AAV-Control, UUO + AAV-Control, Sham+AAV-shVDAC1, UUO + AAV-shVDAC1 groups. A Experimental design: Wild-type C57BL/6 mice were injected with 150 μL of 1.3*1012 vg/ml infective units of AAV-control or AAV-shVDAC1 via tail vein before UUO surgery. BH Representative images of Sirius red, Masson staining, and IHC staining of VDAC1, fibronectin, collagen I, α-SMA and quantitation in kidneys injected with AAV-Control or AAV-shVDAC1 (n = 5). Bar = 50 μm. I Representative western blot images of collagen I, fibronectin and α-SMA in kidneys of the four groups. J, K Representative images of IHC staining of MCP-1, TNF-α, IL-1β and F4/80 and quantitation in kidneys (n = 5). Bar = 50 μm. L Relative mRNA levels of IL-6, IL-1β, TNF-α, and MCP-1 in kidneys (n = 5). Data are presented as mean ± SEM. **P < 0.01, ***P < 0.001.
Fig. 4
Fig. 4. STING deficiency alleviates UUO-induced fibrosis and inflammation in mice.
STING−/− mice and their littermates (STING+/+) mice were randomly separated into the STING+/++Sham, STING+/+ + UUO, STING−/−+Sham and STING−/− + UUO groups. A Representative western blot images of STING in the kidneys of STING+/+ and STING−/− mice after UUO. B, C Representative images of HE, Masson, Sirius red, and IHC staining of fibronectin, collagen I, E-cadherin, α-SMA and Kim-1 and quantitative analysis in kidneys (n = 5). Bar = 50 μm. D Representative western blot images of fibronectin, collagen I, E-cadherin, α-SMA and Kim-1 in kidneys of the four groups. EJ Representative images of IHC staining of MCP-1, TNF-α, IL-1β, CD45 and F4/80 and quantitative analysis in kidneys (n = 5). Bar = 50 μm. K Relative mRNA levels of IL-6, TNF-α, and MCP-1 in kidneys (n = 5). Data are presented as mean ± SEM. *P < 0.05, **P < 0.01, ***P < 0.001.
Fig. 5
Fig. 5. Inhibition of STING inhibits hypoxia-induced fibrotic and inflammatory responses in HK-2 cells.
A, B HK-2 cells were cultured with hypoxia at various time points. Representative western blot images and quantification of cGAS and STING in HK-2 cells (n = 4). C HK-2 cells exposed to normoxia or hypoxia were transfected with negative control (NC) siRNA or STING siRNA, or treated with C-176. Representative confocal microscopic images of STING in HK-2 cells. Bar = 25 μm. D, E Representative western blot images and quantification of STING, p-TBK1, TBK1, p-p65, p65, fibronectin, collagen I, E-cadherin and α-SMA in HK-2 cells (n = 4). F Representative confocal microscopic images of E-cadherin and α-SMA in HK-2 cells. Bar = 10 μm. G Relative mRNA levels of IL-1β, MCP-1 and TNF-α in HK-2 cells (n = 4). H Morphological changes in HK-2 cells were analyzed under an inverted microscope. Bar = 50 μm. NC: negative control, Hyp: hypoxia. Data are presented as mean ± SEM. *P < 0.05, **P < 0.01, ***P < 0.001.
Fig. 6
Fig. 6. VDAC1 mediates hypoxia-induced STING signaling activation, and fibrotic and inflammatory responses in vitro.
A Representative western blot image of VDAC1 oligomerization in HK-2 cells. BI Representative western blot images and quantification of cGAS, STING, p-TBK1, TBK1, p-p65, p65, fibronectin, collagen I, and α-SMA in HK-2 cells (n = 4). J Representative confocal microscopic images of E-cadherin and α-SMA in HK-2 cells. Bar = 10 μm. K Relative mRNA levels of IL-1β, TNF-α, and MCP-1 in HK-2 cells (n = 4). L qPCR showed the cytosolic translocation of mtDNA (mt-Col, mt-Cytb, mt-Nd6, mt-Rnr2) in HK-2 cells (n = 4). Hyp: hypoxia. Data are presented as mean ± SEM. *P < 0.05, **P < 0.01, ***P < 0.001.
Fig. 7
Fig. 7. Inhibition of PKC-δ attenuates hypoxia-induced STING signaling activation, and fibrotic and inflammatory responses in vitro.
A, B HK-2 cells were cultured with hypoxia in various time points. Representative western blot images of p-PKC-δ and PKC-δ, and quantification in cell lysate (n = 4). CH Representative western blot images and quantification of p-PKC-δ, PKC-δ, cGAS, STING, p-TBK1, TBK1, p-p65, and p65 in HK-2 cells (n = 4). I RT-PCR showing the effects of Rottlerin on the cytosolic translocation of mtDNA (mt-Col, mt-Cytb, mt-Nd6, mt-Rnr2) in HK-2 cells (n = 4). JM Representative western blot images and quantification of fibronectin, collagen I, and α-SMA in HK-2 cells (n = 4). N Representative confocal microscopic images of E-cadherin and α-SMA in HK-2 cells. Bar = 10 μm. O Relative mRNA levels of IL-1β, IL-6, TNF-α, and MCP-1 in HK-2 cells (n = 5). Ctrl: control; Hyp: hypoxia; Rott: Rottlerin. Data are presented as mean ± SEM. *P < 0.05, **P < 0.01, ***P < 0.001.
Fig. 8
Fig. 8. PKC-δ binds to VDAC1 and promotes its oligomerization to increase mitochondrial impairment in HK-2 cells exposed to hypoxia.
A, B Representative images and quantification of JC-1 staining showing the effect of Rottlerin on mitochondrial membrane potential (MMP) in HK-2 cells exposed to hypoxia (n = 4). Bar = 25 μm. CE Representative images and quantification of MitoTracker and MitoSOX showing the effects of Rottlerin on the mitochondria fragmentation and mtROS generation in HK-2 cells exposed to hypoxia (n = 4). Bar = 5 μm (MitoTracker) and Bar = 25 μm (MitoSOX). F Representative images of MitoTracker and PKC-δ costaining in HK-2 cells. Bar = 10 μm. G Representative images showing the effect of Rottlerin on colocalization of PKC-δ and VDAC1 in HK-2 cells exposed to hypoxia. Bar = 10 μm. H Co-immunoprecipitation was used to detect the interaction of PKC-δ and VDAC1. I Representative western blot image of VDAC1 oligomerization in HK-2 cells. J Schematic model: PKC-δ/VDAC1/cGAS-STING-mediated inflammation and fibrosis in the development of obstructive nephropathy. Hyp: hypoxia; Rott: Rottlerin. Data are presented as mean ± SEM. **P < 0.01, ***P < 0.001.

Similar articles

Cited by

References

    1. Djudjaj S, Boor P. Cellular and molecular mechanisms of kidney fibrosis. Mol Aspects Med. 2019;65:16–36. doi: 10.1016/j.mam.2018.06.002. - DOI - PubMed
    1. Edeling M, Ragi G, Huang S, Pavenstädt H, Susztak K. Developmental signalling pathways in renal fibrosis: the roles of Notch, Wnt and Hedgehog. Nat Rev Nephrol. 2016;12:426–39. doi: 10.1038/nrneph.2016.54. - DOI - PMC - PubMed
    1. Meng XM, Nikolic-Paterson DJ, Lan HY. TGF-β: the master regulator of fibrosis. Nat Rev Nephrol. 2016;12:325–38. doi: 10.1038/nrneph.2016.48. - DOI - PubMed
    1. Tang PM, Nikolic-Paterson DJ, Lan HY. Macrophages: versatile players in renal inflammation and fibrosis. Nat Rev Nephrol. 2019;15:144–58. doi: 10.1038/s41581-019-0110-2. - DOI - PubMed
    1. Rosse C, Linch M, Kermorgant S, Cameron AJ, Boeckeler K, Parker PJ. PKC and the control of localized signal dynamics. Nat Rev Mol Cell Biol. 2010;11:103–12. doi: 10.1038/nrm2847. - DOI - PubMed

LinkOut - more resources