. 2024 Jul 7;15(1):5693.
doi: 10.1038/s41467-024-49811-y.

Epigenetic alterations affecting hematopoietic regulatory networks as drivers of mixed myeloid/lymphoid leukemia

Affiliations

Epigenetic alterations affecting hematopoietic regulatory networks as drivers of mixed myeloid/lymphoid leukemia

Roger Mulet-Lazaro et al. Nat Commun. .

Abstract

Leukemias with ambiguous lineage comprise several loosely defined entities, often without a clear mechanistic basis. Here, we extensively profile the epigenome and transcriptome of a subgroup of such leukemias with CpG Island Methylator Phenotype. These leukemias exhibit comparable hybrid myeloid/lymphoid epigenetic landscapes, yet heterogeneous genetic alterations, suggesting they are defined by their shared epigenetic profile rather than common genetic lesions. Gene expression enrichment reveals similarity with early T-cell precursor acute lymphoblastic leukemia and a lymphoid progenitor cell of origin. In line with this, integration of differential DNA methylation and gene expression shows widespread silencing of myeloid transcription factors. Moreover, binding sites for hematopoietic transcription factors, including CEBPA, SPI1 and LEF1, are uniquely inaccessible in these leukemias. Hypermethylation also results in loss of CTCF binding, accompanied by changes in chromatin interactions involving key transcription factors. In conclusion, epigenetic dysregulation, and not genetic lesions, explains the mixed phenotype of this group of leukemias with ambiguous lineage. The data collected here constitute a useful and comprehensive epigenomic reference for subsequent studies of acute myeloid leukemias, T-cell acute lymphoblastic leukemias and mixed-phenotype leukemias.


Conflict of interest statement

The authors declare no competing interests.

Figures

Fig. 1
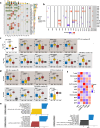
Fig. 1. Epigenetic and transcriptional landscape of CIMP leukemias compared to other leukemias and CD34+ cells.
a Heatmap of the 3000 most variable MCIP-seq regions across all samples (n = 63), displaying their Z-scores and clustered by Euclidean distance. b Diagram depicting different elements of gene regulation and the corresponding data sequenced in this study: MCIP-seq for DNA methylation, H3K27ac ChIP-seq for enhancer activity, ATAC-seq for chromatin accessibility, and RNA-seq for gene expression. c Dimensionality reduction with Uniform Manifold Approximation and Projection (UMAP) of epigenetic and transcriptional data in AML, CIMP, T-ALL and CD34+ HSPCs from healthy donors. From left to right: methylation (MCIP-seq, n = 80), gene expression (RNA-seq, n = 357), histone H3K27 acetylation (H3K27ac, n = 83) measured by ChIP-seq, and open chromatin (ATAC-seq, n = 81). Note that individuals did not completely overlap across all datasets; notably, T-ALL patients in the MCIP-seq cohort were not present in any other experiment (see Supplementary Data 1 for details).
Fig. 2
Fig. 2. The mutational landscape and gene expression signature of CIMP leukemias suggest similarity with ETP-ALL and a very early lymphoid progenitor as the cell of origin.
a Oncoprint displaying single nucleotide variants (SNVs), small inserts and deletions (indels) or copy number alterations (CNAs) affecting genes mutated in at least 2% of the cohort (n = 14). Columns correspond to patients and rows correspond to genes, ranked by mutational frequency. Variant calling was performed with an ensemble of tools on whole exome sequencing (WES) data. Different variants are indicated in different colors as shown in the plot legend. CNG = copy number gains; CNL = copy number losses. b Heatmap displaying large CNAs in CIMP cases, detected using CNVkit on WES data (n = 14). Red indicates a CNG and blue indicates a CNL. c Expression of myeloid markers commonly used for leukemia classification in CIMP (n = 13), AML (n = 211), T-ALL (n = 100) and healthy controls (n = 9). Markers used to define T/M MPAL or ETP-ALL are indicated. The lower and upper edges of the boxplots represent the first and third quartiles, respectively, the horizontal line inside the box indicates the median. The whiskers extend to the most extreme values within the range comprised between the median and 1.5 times the interquartile range. The circles represent outliers outside this range. The horizontal black lines between boxes represent pairwise comparisons between CIMP and other leukemias. Statistical significance was determined by a two-sided Wald test in the DESeq2 package and corrected for multiple testing with the Benjamini–Hochberg procedure. d Same as c, but showing lymphoid markers instead. e Bar plot showing the top results from gene set enrichment analysis (GSEA) conducted on a custom version of the MSigDB C2 collection. The analysis was conducted on differentially expressed genes in CIMP relative to AML (top), T-ALL (middle) and CD34+ HSPCs (bottom). f Heatmap displaying CIBERSORTx scores for various hematopoietic cell types, using a signature matrix derived from publicly available single-cell RNA-seq. The 25%-trimmed mean of the scores was calculated for each leukemia subgroup (or CD34+ cells), followed by row-wise Z-score normalization. Scores were calculated for every sample and aggregated by disease groups: CIMP (n = 13), AML (n = 189), CEBPA double mutant (DM) AML (n = 22), T-ALL (n = 100). The CEBPA DM subgroup was analyzed separately owing to the similarities with CIMP leukemias. CLP common lymphoid progenitor, CMP common myeloid progenitor, GMP granulocyte-monocyte progenitor, HSC hematopoietic stem cell, MEP megakaryocyte-erythrocyte progenitor, MLP multi-lymphoid progenitor, MPP multipotent progenitor.
Fig. 3
Fig. 3. Functional assessment of methylation differences between CIMP and other leukemias.
All statistical analyses presented here have been performed using MCIP-seq data from CIMP (n = 13), AML (n = 50), T-ALL (n = 14), and healthy CD34+ cells (n = 3), unless otherwise specified. a Box plot showing methylation levels at different genomic features. The lower and upper edges of the boxplots represent the first and third quartiles, respectively; the horizontal line inside the box indicates the median. The whiskers extend to the most extreme values within the range comprised between the median and 1.5 times the interquartile range. The lines between boxes indicate the effect size as Cohen’s d, defined as the number of standard deviation units between groups (all comparisons were significant in a two-tailed Welch’s t test). Typically, d values below 0.2 are considered small, and above 0.8 are considered large. b Average methylation levels of different leukemias and healthy cells at putative gene promoters, defined as 4-kb regions surrounding the center of H3K4me3 ChIP-seq peaks in CD34+ HSPCs. Each line depicts a smoothed average (LOESS function) for a group of patients, with the shaded band indicating the 95% confidence interval. c Tornado plots depicting methylation (MCIP-seq) at putative HSPC promoters (H3K4me1 peaks), sorted by chromatin accessibility in HSPCs (DNase). The color code distinguishes different types of leukemia and HSPCs, and the intensity reflects the degree of methylation. The HSPC tracks in purple were downloaded from ENCODE and show chromatin accessibility (DNase) as well as histone marks for enhancers (H3K4me1), promoters (H3K4me3), activation (H3K27ac) and repression (H3K27me3). GC density was downloaded from the UCSC browser. d Volcano plot of differentially methylated regions (DMRs) annotated with the closest genes in the linear genome. The statistical significance of the comparisons between these groups was determined by the Wald test (two-sided) in the DESeq2 package and corrected for multiple testing with the Benjamini–Hochberg procedure. Regions with false discovery rate (FDR) < 0.05 and log2 fold change >2 are highlighted; the numbers at the top indicate the number of differentially expressed genes for each comparison. e Summary plot of the top 5 most significant results of pre-ranked GSEA conducted on genes in the vicinity of DMRs between CIMP and AML. The C2 (top) and C5 (bottom) MSigDB collections were used in the analysis. f Genomic tracks of MCIP-seq data for a few selected samples of each leukemia (CIMP, T-ALL, AML) at promoters of hematopoietic genes with significant changes in methylation.
Fig. 4
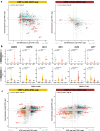
Fig. 4. Integration of methylation and gene expression data reveals silencing of hematopoietic-related transcription factors.
a Starbust plot depicting changes in gene expression (RNA-seq, Y axis) and methylation (MCIP-seq, X axis) between CIMP and AML (left) and T-ALL (right). The statistical significance of the comparisons between these groups was determined by the Wald test (two-sided) in the DESeq2 package and corrected for multiple testing with the Benjamini–Hochberg procedure. The values are the log10 of the false discovery rate (FDR) with the sign of the fold change. Genes with FDR < 0.05 and log2 fold change >2 for both data types are colored (turquoise if hypermethylated, brown if hypomethylated). Those with non-significant changes are binned into gray hexagons whose opacity is proportional to the number of genes therein. Genes encoding for transcription factors are shown in solid color, among which those involved in hematopoiesis are highlighted in red (GO term: 0030097) and labeled. The rest of the genes are semitransparent. The Pearson correlation coefficient (r) and its related p value (two-sided) for the relationship between methylation and expression are shown at the top left. Sample sizes for MCIP-seq and RNA-seq were, respectively: 13/13 (CIMP), 50/211 (AML), 14/100 (T-ALL). b Jitter plots showing methylation (top) and expression (bottom) of a few selected genes in CIMP, other leukemias, and HSPCs. The central red dot indicates the mean and the vertical red lines correspond to the standard deviation. The horizontal black lines represent pairwise comparisons between CIMP and other leukemias, obtained with the same statistical methodology and sample sizes described in a. c Starbust plot depicting changes in gene expression (RNA-seq, Y axis) and chromatin accessibility at enhancers (ATAC-seq, X axis) between CIMP and AML (left) and T-ALL (right). The statistical methodology and the color code are the same as in a, but for chromatin accessibility instead of DNA methylation. Note that a single gene may be targeted by multiple enhancers, each of which is labeled based on the distance with respect to the TSS. Sample sizes for ATAC-seq and RNA-seq data were, respectively: 9/13 (CIMP), 51/211 (AML), and 19/100 (T-ALL).
Fig. 5
Fig. 5. Disturbance of hematopoietic regulatory networks in CIMP leukemias suspends both hematopoiesis and lymphopoiesis.
a Bar plot depicting enrichment for experimentally confirmed TF binding sites from the CODEX database at differentially methylated regions between CIMP and AML (left) or between CIMP and T-ALL (right), as derived from EPIC array data (CIMP: n = 5, AML: n = 272, T-ALL: n = 119). Enrichment was calculated with a one-sided Fisher´s exact test using the LOLA R package. The length of the bars corresponds to the odds ratio and their color to the −log10(p value); only a maximum of 25 results with a −log(p value) above 50 are shown. TFs involved in hematopoiesis hematopoiesis (GO term: 0030097) are highlighted in red. b Volcano plots displaying comparisons in motif activity between CIMP and AML (left), CIMP and T-ALL (middle) or AML and T-ALL (right), as derived from ATAC-seq data (CIMP: n = 9, AML: n = 51, T-ALL: n = 19). Motifs with a p value < 0.01 (Wilcoxon signed-rank test, two-sided) and |differential deviation|> 0.01 are colored. c Heatmap depicting TFBS accessibility and TPM-normalized gene expression in those patients where both RNA-seq and ATAC-seq were available (n = 79). Only the top 50 most variable motifs were selected, aggregated as 35 TFs after excluding alternative motifs for the same protein. d Correlation between motif activity as estimated by chromVAR and TPM-normalized gene expression in every individual where both RNA-seq and ATAC-seq data were available (n = 79). Sample sizes for each leukemia are described in b. The Pearson correlation coefficient (r) and its related p value (two-sided) for the relationship between TFBS accessibility and gene expression are shown at the top. A positive correlation suggests that the TF is a bona fide driver of chromatin accessibility at its predicted binding sites; a negative correlation may indicate either repression or a competitive effect. The scatter plots in this figure show some of the most relevant TFs with positive correlation in myeloid and lymphoid leukemias. The full dataset is available at Supplementary Data 34. e Starbust plot depicting changes in TFBS accessibility inferred by chromVar (X axis) and gene expression (Y axis) between CIMP and AML (left) and T-ALL (right). Sample sizes for CIMP, AML, and T-ALL were 9, 51, and 19, respectively.
Fig. 6
Fig. 6. Hypermethylation in CIMP leukemias leads to loss of CTCF binding.
Statistical analyses of CTCF ChIP-seq data shown here were conducted with the following sample sizes (n): CIMP = 9, AML = 10, T-ALL = 19. a Average CTCF binding in 1-kb regions surrounding the center of CTCF ChIP-seq peaks on a consensus master list. Each line depicts a smoothed average (LOESS function) for a group of patients, with the shaded band indicating the 95% confidence interval. b Tornado plots depicting methylation levels and CTCF binding at the 25,000 most variable CTCF peaks found in at least 4 patients of the entire cohort. Four representative samples of each leukemia type (CIMP, AML, and T-ALL) are presented. The plot above shows the average signal around the center of the peaks for each patient. An inverse correlation between methylation and CTCF binding can be observed. c Bar plot of differentially methylated regions (DMR) in supervised comparisons of MCIP-seq peaks between CIMP and AML (left) or T-ALL (right). A threshold of FDR < 0.05 and |log2 FC|>1 was used to determine significant DMRs. NS not significant. d Hexagonal heatmap showing the inverse correlation between differences in promoter methylation (X axis) and differences in CTCF binding (Y axis) in CIMP compared to AML (left panel) and T-ALL (right panel). Data are binned, with the color scale indicating how many promoters are contained in each bin. The values correspond to the log2 of the fold change between conditions, calculated by DESeq2. A regression line is depicted in black, with a shaded gray band indicating the 95% confidence interval. The Pearson correlation coefficient (r) and its related p value (two-sided) for the relationship between DNA methylation and CTCF binding are shown at the top left. e Box plot displaying methylation changes in relation to differences in CTCF binding between CIMP and AML (left) or T-ALL (right). The lower and upper edges of the boxplots represent the first and third quartiles, respectively; the horizontal line inside the box indicates the median. The whiskers extend to the most extreme values within the range comprised between the median and 1.5 times the interquartile range. The horizontal black lines on top represent pairwise comparisons between groups, with a p value derived from a two-sided Wilcoxon test. No multiple correction adjustment was used. The number of CTCF peaks in each category (loss, no change, or gain) is shown in c.
Fig. 7
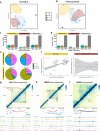
Fig. 7. Chromatin interaction landscape of CIMP and other leukemias.
Differential analyses of Hi-C data in dg were performed with DESeq2 between CIMP (n = 8) and either AML (n = 5) or T-ALL (n = 4). a PCA plot of TAD inclusion ratios (IR) calculated by HOMER in Hi-C data from CIMP (n = 8), AML (n = 5), T-ALL (n = 4) and CD34+ cells (n = 3). b PCA plot of loop density scores calculated by HOMER in Hi-C data. c Bar plot showing TADs with differential IRs between different leukemias as calculated by DESeq2. Only TADs with a log2 fold change larger than 0 and FDR < 0.05 have been considered. d Same as c, but for loop density scores. e Distribution of gains or losses in CTCF binding in variable TADs (top) or differential interaction (bottom) when comparing CIMP vs AML. Lost DIs are enriched for sites with decreased CTCF binding. f Correlation between changes in interaction strength and expression levels of the genes contacted by those loops in CIMP vs AML (left) and CIMP vs T-ALL (right). A regression line is shown in blue, with a shaded gray band indicating the 95% confidence interval. The Pearson correlation coefficient (r) and its related p value (two-sided) for the relationship between DNA methylation and CTCF binding are shown at the top left. g Merged Hi-C contact map of the KLF4 locus, comparing interactions between the CIMP (uppermost triangle, n = 5) and AML groups (bottom triangle, n = 5). ΔTADs are marked with a triangle in each half, and DIs are indicated with circles. Underneath, loops detected in this region are shown in black if they are invariable across conditions and in red or blue if they are gained or lost in CIMP relative to AML, respectively. The tracks below display MCIP-seq, CTCF ChIP-seq, and H3K27ac ChIP-seq from CIMP (n = 4) and AML (n = 4). Peaks gained in CIMP are highlighted in turquoise, whereas lost peaks are highlighted in light brown. The last track shows p300 binding measured by ChIP-seq in the K562 cell line. h Same as g, but the CEBPD locus is shown instead. i. Same as g, but the GATA3 locus is shown.

Similar articles

Cited by

References

    1. Shih AH, Abdel-Wahab O, Patel JP, Levine RL. The role of mutations in epigenetic regulators in myeloid malignancies. Nat. Rev. Cancer. 2012;12:599–612. doi: 10.1038/nrc3343. - DOI - PubMed
    1. Liu Y, et al. The genomic landscape of pediatric and young adult T-lineage acute lymphoblastic leukemia. Nat. Genet. 2017;49:1211–1218. doi: 10.1038/ng.3909. - DOI - PMC - PubMed
    1. Gröschel S, et al. A single oncogenic enhancer rearrangement causes concomitant EVI1 and GATA2 deregulation in leukemia. Cell. 2014;157:369–381. doi: 10.1016/j.cell.2014.02.019. - DOI - PubMed
    1. Ottema S, et al. Atypical 3q26/MECOM rearrangements genocopy inv(3)/t(3;3) in acute myeloid leukemia. Blood. 2020;136:224–234. doi: 10.1182/blood.2019003701. - DOI - PubMed
    1. Mansour MR, et al. An oncogenic super-enhancer formed through somatic mutation of a noncoding intergenic element. Science. 2014;346:1373–1377. doi: 10.1126/science.1259037. - DOI - PMC - PubMed

MeSH terms

LinkOut - more resources