Comparative Study
. 2024 Jul 7;24(1):809.
doi: 10.1186/s12885-024-12595-x.

Comparative immune profiling of pancreatic ductal adenocarcinoma progression among South African patients

Affiliations
Comparative Study

Comparative immune profiling of pancreatic ductal adenocarcinoma progression among South African patients

Nnenna Elebo et al. BMC Cancer. .

Abstract

Background: Pancreatic Ductal Adenocarcinoma (PDAC) is an aggressive cancer characterized by an immunosuppressive microenvironment. Patients from specific ethnicities and population groups have poorer prognoses than others. Therefore, a better understanding of the immune landscape in such groups is necessary for disease elucidation, predicting patient outcomes and therapeutic targeting. This study investigated the expression of circulating key immune cell markers in South African PDAC patients of African ancestry.

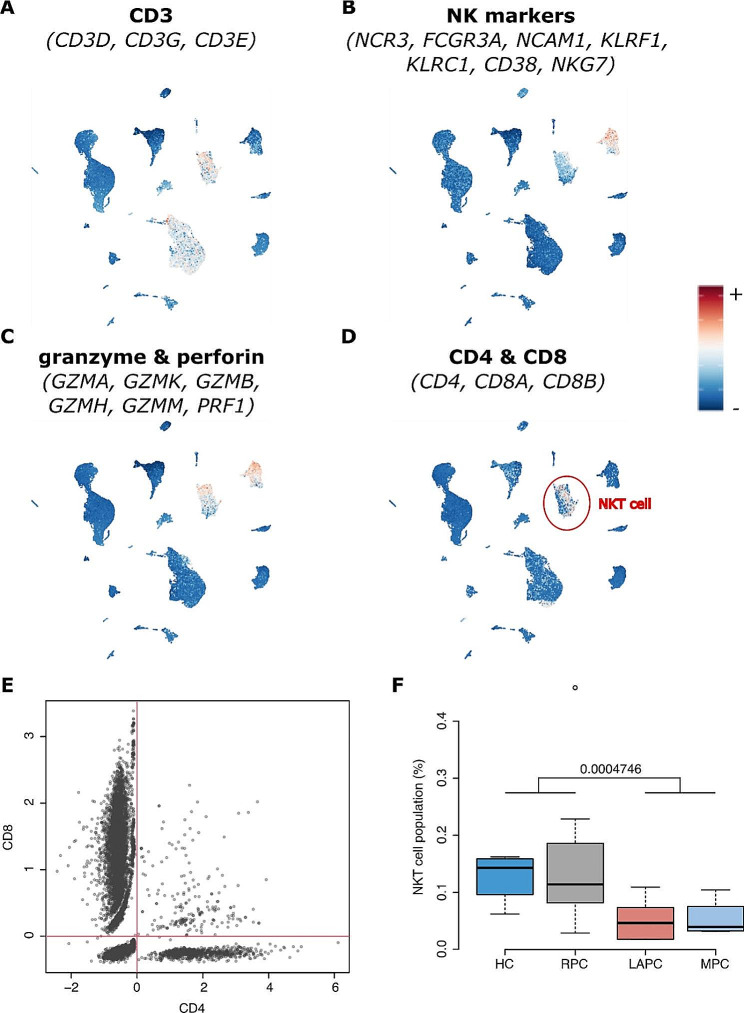
Methods: Blood samples were obtained from a total of 6 healthy volunteers (HC), 6 Chronic Pancreatitis (CP) and 34 PDAC patients consisting of 22 resectable (RPC), 8 locally advanced (LAPC) and 4 metastatic (MPC). Real-time Quantitative Polymerase Chain reactions (RT-qPCR), Metabolomics, Enzyme-Linked Immunosorbent Assay (ELISA), Reactive Oxygen Species (ROS), and Immunophenotyping assays were conducted. Statistical analysis was conducted in R (v 4.3.2). Additional analysis of single-cell RNA data from 20 patients (16 PDAC and 4 controls) was conducted to interrogate the distribution of T-cell and Natural Killer cell populations.

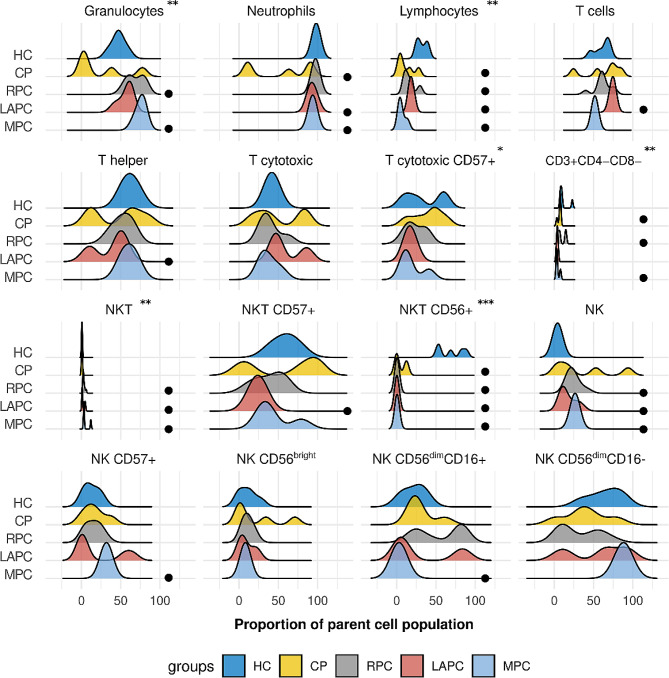
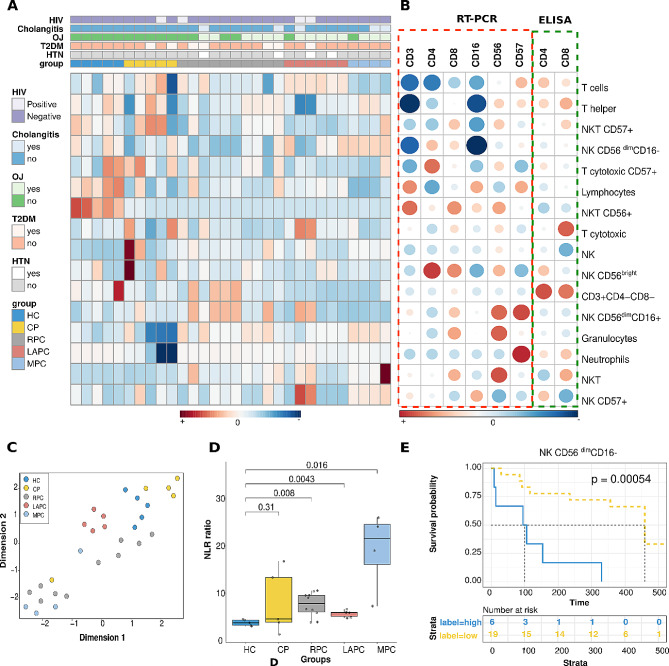
Results: Granulocyte and neutrophil levels were significantly elevated while lymphocytes decreased with PDAC severity. The total percentages of CD3 T-cell subpopulations (helper and double negative T-cells) decreased when compared to HC. Although both NK (p = 0.014) and NKT (p < 0.001) cell levels increased as the disease progressed, their subsets: NK CD56dimCD16- (p = 0.024) and NKTs CD56+ (p = 0.008) cell levels reduced significantly. Of note is the negative association of NK CD56dimCD16- (p < 0.001) cell levels with survival time. The gene expression analyses showed no statistically significant correlation when comparing the PDAC groups with the controls. The inflammatory status of PDAC was assessed by ROS levels of serum which were elevated in CP (p = 0.025), (RPC (p = 0.003) and LAPC (p = 0.008)) while no significant change was observed in MPC, compared to the HC group. ROS was shown to be positively correlated with GlycA (R = 0.45, p = 0.0096). Single-cell analyses showed a significant difference in the ratio of NKT cells per total cell counts in LAPC (p < 0.001) and MPC (p < 0.001) groups compared with HC, confirming observations in our sample group.

Conclusion: The expression of these immune cell markers observed in this pilot study provides insight into their potential roles in tumour progression in the patient group and suggests their potential utility in the development of immunotherapeutic strategies.

Keywords: CD4; CD8; Immune cells; Immunosuppression; PDAC; Pancreatic ductal adenocarcinoma.


Conflict of interest statement

The authors declare no competing interests.

Figures

Fig. 1
Fig. 1
Distribution of effector immune cell populations in PDAC: Granulocytes and neutrophils were distributed to the right indicating elevated levels while lymphocytes shifted to the left signifying decreased levels in PDAC groups. The total parent proportion of CD3 T-cells with increased severity. Subpopulations of CD3 T-cells, T helper and T cytotoxic were also distributed to the left indicating reduction as the disease progressed. However, CD3 subset, cytotoxic T-cell decreased in RPC and MPC but increased in LAPC while it’s subset cytotoxic CD57+ T-cell decreased with increased severity and this could be due to it’s enhanced cytotoxicity. There is a shift to the right for NKs and NKTs which signifies elevated levels with increased severity of PDAC. This was not the same for NKT subsets (NKTsCD57+ and NKTsCD56+) and NK subsets (NKCD56brightCD16 NKCD56dimCD16 and NKCD56dimCD16+) which were dysregulated within the PDAC groups. It should be noted that CP control group has an entirely different distribution from both the PDAC and HC groups for all the immune markers. HC; Healthy controls, CP: Chronic Pancreatitis, RPC: Resectable Pancreatic Ductal Adenocarcinoma, LAPC; Locally Advanced Pancreatic Ductal Adenocarcinoma, MPC; Metastatic Pancreatic Ductal Adenocarcinoma *p < 0.05, **p < 0.01, ***p < 0.001. Black circle represent significantly different from HC.
Fig. 2
Fig. 2
Characterisation of effector immune cell markers in PDAC. (A) Heatmap showing the comparison of immune cell profiles across the PDAC groups and their correlation with their comorbidities. NK cells, NK CD56bright,NKT cells and NKTs CD56+ were observed to have the highest intensities which indicates a strong association with the comorbidities. Granulocytes, neutrophils and T-cells had the weakest intensities which implies no link to the maladies. (B) Correlation matrix of Spearman’s rank correlation coefficients between the immune cell populations from Immunophenotyping, RT-qPCR, and Elisa analyses. Dark blue colours indicate strong relationships while dark red signifies weak correlations. (C) Unsupervised clustering of the Immunophenotyping data using KODAMA showed that the controls HC and CP were distinctively separated from the PDAC groups. D) Comparison of the Neutrophil/Lymphocyte ratio (NLR) between the control and PDAC groups. The NLR was significantly altered across the PDAC groups when compared to the HC group. (E) Kaplan Meier plot showing that significant correlation between NK CD56dimCD16 cells and patient survival. Patients with lower levels of NK CD56dimCD16 cells survived longer. HC; Healthy controls, CP: Chronic Pancreatitis, RPC: Resectable Pancreatic Ductal Adenocarcinoma, LAPC; Locally Advanced Pancreatic Ductal Adenocarcinoma, MPC; Metastatic Pancreatic Ductal Adenocarcinoma
Fig. 3
Fig. 3
Interplay between immune cell expression, metabolite levels and inflammation in PDAC. (A) Correlation matrix between metabolic profile (in columns) and immune profile (in rows) measured by immunophenotyping, RT-qPCR and ELISA. Pearson correlation coefficient was used to measure the linear correlation (red represents positive correlations and blue represents negative correlations (B) Boxplot showing the comparison in DEPPD levels representing ROS activity between the PDAC groups (RPC, LAPC, and MPC) and control groups (HC and CP). A significant change was observed when the RPC and LAPC groups of PDAC were compared with HC groups. (C) Correlation of ROS and inflammatory marker GlycA. ROS is significantly positively associated with GlycA which is an NMR inflammatory marker. (D) Correlation of ROS with 2-hydroxybutyrate. 2-hydroxybutyrate is a metabolite strongly linked to oxidative stress via the impairment of β-cells. Although not significant, there was a negative correlation with ROS. HC; Healthy controls, CP: Chronic Pancreatitis, RPC: Resectable Pancreatic Ductal Adenocarcinoma, LAPC; Locally Advanced Pancreatic Ductal Adenocarcinoma, MPC; Metastatic Pancreatic Ductal Adenocarcinoma
Fig. 4
Fig. 4
Single-cell analysis of PMBC samples from PDAC patients and HC. Different panels of genes were used to identify (A) CD3 expression, (B) NK phenotype, (C) cytotoxicity activity of granzyme and perforin, (D) CD4 + and CD8 + phenotype. E) A scatter plot showing the distribution of CD4 and CD8 marker genes in the preidentified NKT cells. F) A box plot showing differences NKT cell per total cell counts in PDAC groups (i.e., RPC, LAPC and MPC) and HC. HC; Healthy controls, CP: Chronic Pancreatitis, RPC: Resectable Pancreatic Ductal Adenocarcinoma, LAPC; Locally Advanced Pancreatic Ductal Adenocarcinoma, MPC; Metastatic Pancreatic Ductal Adenocarcinoma

References

    1. Siegel RL, Miller KD, Wagle NS, Jemal A. Cancer statistics, 2023. Cancer J Clin. 2023;73(1):17–48. doi: 10.3322/caac.21763. - DOI - PubMed
    1. Rahib L, Smith BD, Aizenberg R, Rosenzweig AB, Fleshman JM, Matrisian LM. Projecting Cancer incidence and deaths to 2030: the unexpected burden of thyroid, liver, and pancreas cancers in the United States. Cancer Res. 2014;74(11):2913. doi: 10.1158/0008-5472.CAN-14-0155. - DOI - PubMed
    1. Wei K, Hackert T. Surgical Treatment of Pancreatic Ductal Adenocarcinoma. Cancers. 2021;13(8). - PMC - PubMed
    1. Hingorani SR. Epithelial and stromal co-evolution and complicity in pancreatic cancer. Nat Rev Cancer. 2023;23(2):57–77. doi: 10.1038/s41568-022-00530-w. - DOI - PMC - PubMed
    1. Elebo N, Fru P, Omoshoro-Jones J, Patrick Candy G, Nweke EE. Role of different immune cells and metabolic pathways in modulating the immune response in pancreatic cancer (review) Mol Med Rep. 2020;22(6):4981–91. doi: 10.3892/mmr.2020.11622. - DOI - PMC - PubMed

Publication types

MeSH terms