. 2024 Jul 8;24(1):643.
doi: 10.1186/s12870-024-05360-6.

A gibberellin-assisted study of the transcriptional and hormonal changes occurring at floral transition in peach buds (Prunus persica L. Batsch)

Affiliations

A gibberellin-assisted study of the transcriptional and hormonal changes occurring at floral transition in peach buds (Prunus persica L. Batsch)

Francesco Girardi et al. BMC Plant Biol. .

Abstract

Background: Flower load in peach is an important determinant of final fruit quality and is subjected to cost-effective agronomical practices, such as the thinning, to finely balance the sink-source relationships within the tree and drive the optimal amount of assimilates to the fruits. Floral transition in peach buds occurs as a result of the integration of specific environmental signals, such as light and temperature, into the endogenous pathways that induce the meristem to pass from vegetative to reproductive growth. The cross talk and integration of the different players, such as the genes and the hormones, are still partially unknown. In the present research, transcriptomics and hormone profiling were applied on bud samples at different developmental stages. A gibberellin treatment was used as a tool to identify the different phases of floral transition and characterize the bud sensitivity to gibberellins in terms of inhibition of floral transition.

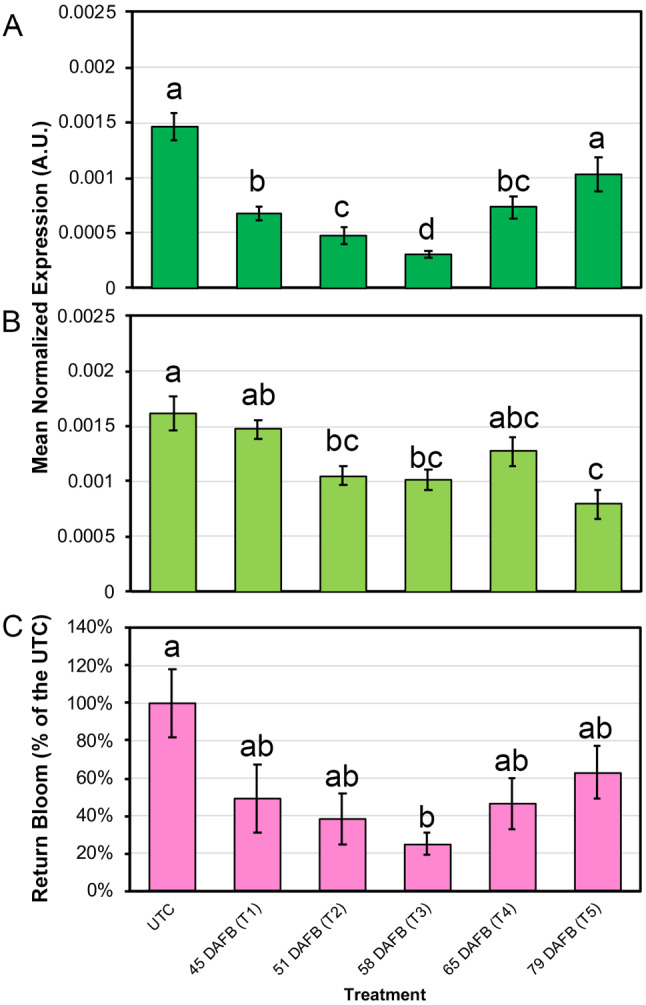
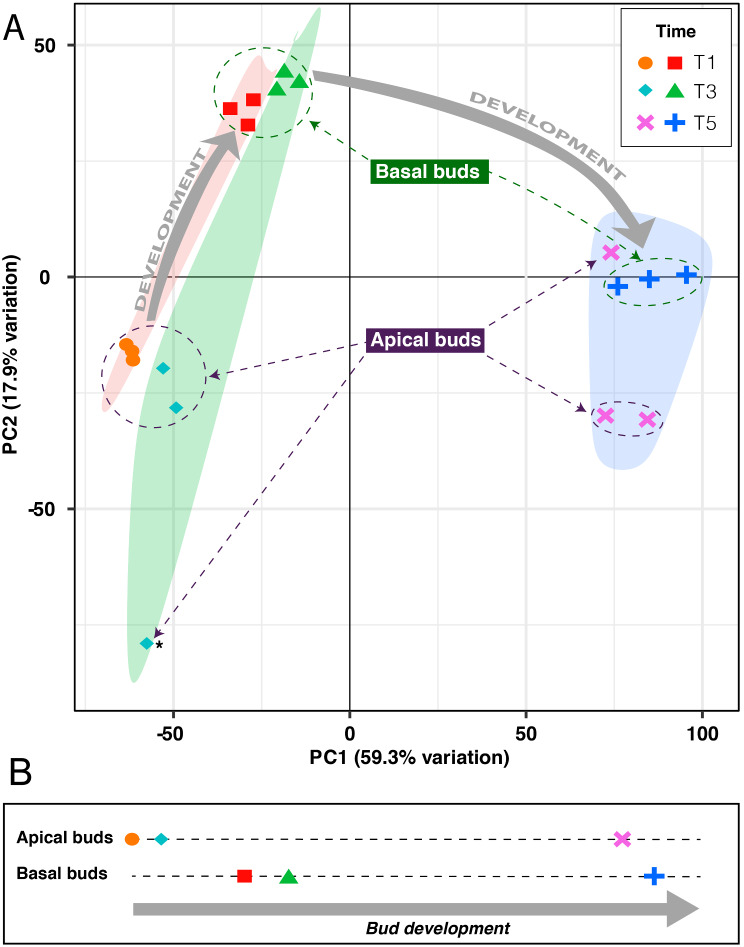
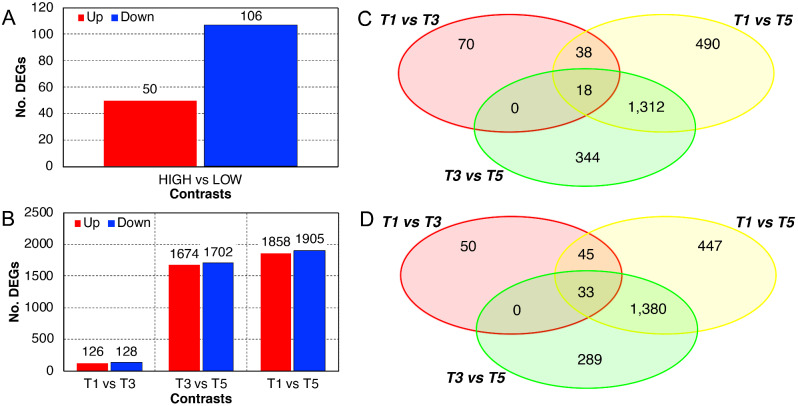
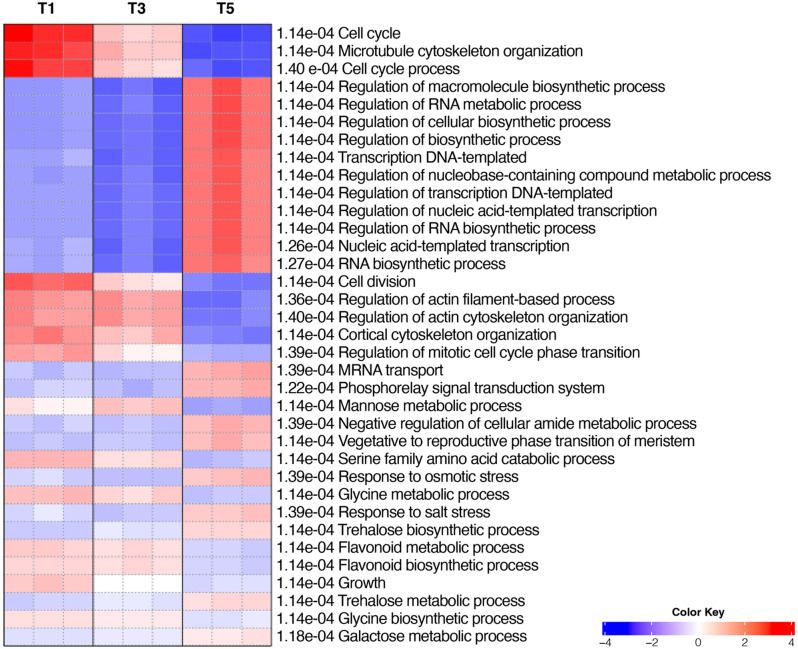
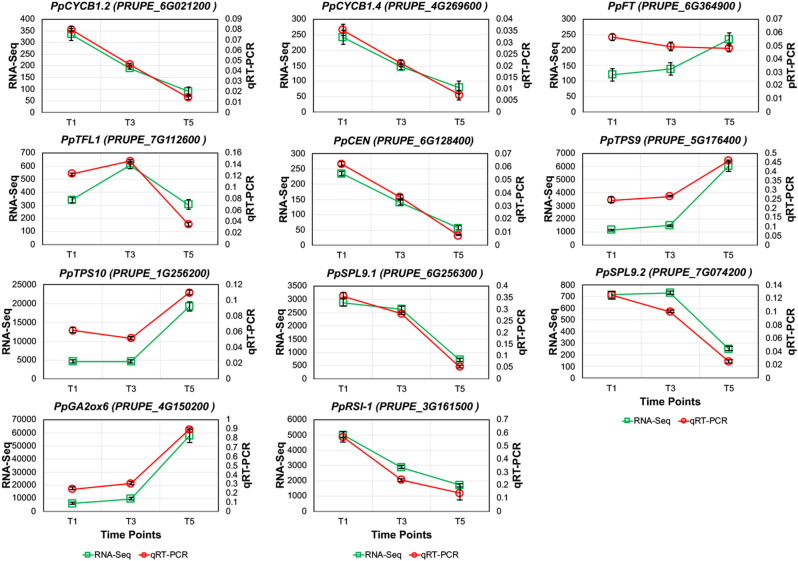
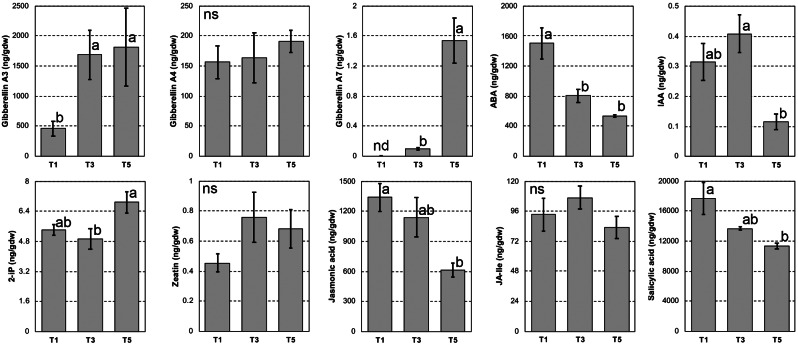
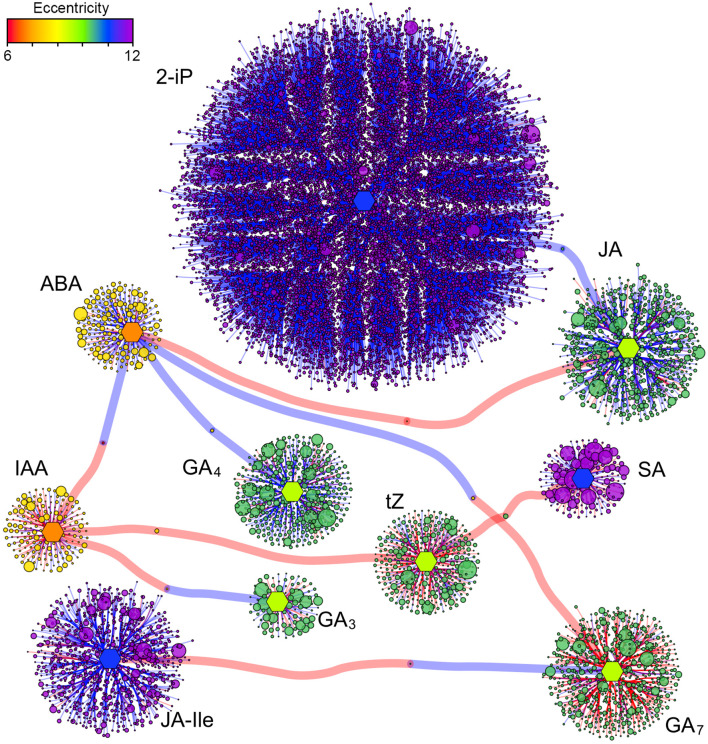
Results: Treatments with gibberellins showed different efficacies and pointed out a timeframe of maximum inhibition of floral transition in peach buds. Contextually, APETALA1 gene expression was shown to be a reliable marker of gibberellin efficacy in controlling this process. RNA-Seq transcriptomic analyses allowed to identify specific genes dealing with ROS, cell cycle, T6P, floral induction control and other processes, which are correlated with the bud sensitivity to gibberellins and possibly involved in bud development during its transition to the reproductive stage. Transcriptomic data integrated with the quantification of the main bioactive hormones in the bud allowed to identify the main hormonal regulators of floral transition in peach, with a pivotal role played by endogenous gibberellins and cytokinins.

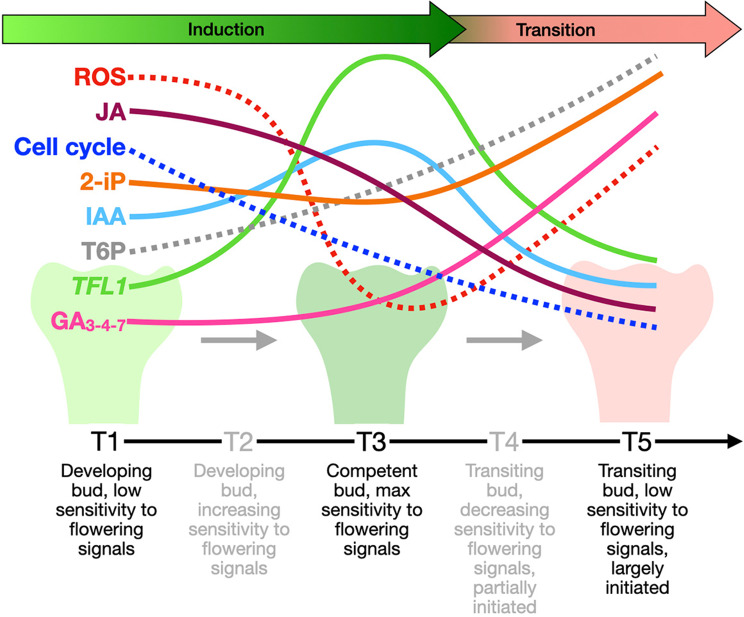
Conclusions: The peach bud undergoes different levels of receptivity to gibberellin inhibition. The stage with maximum responsiveness corresponded to a transcriptional and hormonal crossroad, involving both flowering inhibitors and inductors. Endogenous gibberellin levels increased only at the latest developmental stage, when floral transition was already partially achieved, and the bud was less sensitive to exogenous treatments. A physiological model summarizes the main findings and suggests new research ideas to improve our knowledge about floral transition in peach.

Keywords: Floral transition; Gene expression; Gibberellins; Peach buds; Thinning.


Conflict of interest statement

Alessandro Botton financial support was provided by Fine Agrochemicals Limited. If there are other authors, they declare that they have no known competing financial interests or personal relationships that could have appeared to influence the work reported in this paper.

Figures

Fig. 1
Fig. 1
APETALA1 expression in buds and return bloom measurements. qPCR expression of APETALA1 in basal (A) and apical (B) buds collected from untreated peach trees (UTC) and from trees treated with GA7 at 45, 51, 58, 65, and 79 Days After Full Bloom (DAFB). Letters indicate statistically significant differences (P < 0.05; n = 6) and bars show standard error. A.U., Arbitrary Units. (C) Return bloom reported as a percentage of the UTC. Letters indicate statistically significant differences (P < 0.05; n = 5) and bars show standard deviation
Fig. 2
Fig. 2
PCA of RNA-Seq data and developmental timing of apical and basal buds. (A) T1, T3 and T5 samples are shown in the PCA with red, green and blue shadings, respectively. The variation explained by the first two PCs is shown in the axes. The asterisk marks an outlier of apical buds, while the grey arrows indicate a likely developmental line followed by the buds’ transcriptomes. (B) Positions of the different sampling timepoints of both apical and basal buds with respect to development according to the first PC
Fig. 3
Fig. 3
Differentially Expressed Genes (DEGs) and Venn diagrams. Bar charts show the number of DEGs in the contrast between samples according to the efficacy of the treatment (A) or the timepoints (B). Up- and down-regulated genes are shown in red and blue, respectively. Venn diagrams show up- (C) and down-regulated (D) genes in the different contrasts
Fig. 4
Fig. 4
PGSEA analysis heatmap with all samples. The FDR value is shown for each GO biological process terms representing the enriched pathways. A color scale indicates the degree of up- and down-regulation of the whole pathway
Fig. 5
Fig. 5
qPCR validation of RNA-Seq in basal buds. Expression values of eleven genes are reported for both the qPCR (red lines; as arbitrary units of mean normalized expression) and RNA-Seq (green lines; as RPKM, reads per kilobase of transcript per million reads mapped). Gene name and ID are indicated at the top of each chart. Bars, where visible, indicate standard error
Fig. 6
Fig. 6
Hormone levels measured at T1, T3 and T5. The names of the hormones are shown on the left side of each chart. Letters indicate statistically significant differences (P < 0.05; n = 5) and bars show standard error
Fig. 7
Fig. 7
Correlative network of hormones and genes. Direct and inverse correlations higher than 0.90 are shown with red and blue edges, respectively. Hormones are represented as hexagonal nodes of identical size. Genes are shown with circular nodes, whose size reflects the mean expression level and color is based upon the level of eccentricity, as shown by the top-left scale. The layout of the network is based on the force-directed algorithm by Fruchterman and Reingold (1991). 2-iP, 2-isopentenyladenine; ABA, abscisic acid; GA3/4/7, gibberellin A3, A4 and A7; IAA, indoleacetic acid; JA, jasmonic acid; JA-Ile, jasmonoyl-isoleucine; SA, salicylic acid; tZ, trans-zeatin
Fig. 8
Fig. 8
Physiological working model of peach bud development covering the floral initiation stages. The stages of bud development are described below each timepoint. Continuous lines indicate biological entities that were actually quantified, while dashed lines refer to compounds or processes whose levels or rates were inferred from gene expression data. ROS, reactive oxygen species; JA, jasmonic acid; 2-iP. 2-isopentenyladenine; IAA, indoleacetic acid; T6P, trehalose-6-phosphate; TFL1, TERMINAL FLOWER 1; GA3 − 4−7, gibberellin A3, A4 and A7

References

    1. Luna V, Reinoso H, Lorenzo E, Bottini R, Abdala G. Dormancy in peach (Prunus persica L.) flower buds - II. Comparative morphology and phenology in floral and vegetative buds, and the effect of chilling and gibberellin A3. Trees. 1991;5:244–6. doi: 10.1007/BF00227532. - DOI
    1. Kinet JM, Lejeune P, Bernier G. Shoot-root interactions during floral transition: a possible role for cytokinins. Environ Exp Bot. 1993;33:459–69. doi: 10.1016/0098-8472(93)90019-C. - DOI
    1. Blázquez MA, Ahn JH, Weigel D. A thermosensory pathway controlling flowering time in Arabidopsis thaliana. Nat Genet. 2003;33:168–71. doi: 10.1038/ng1085. - DOI - PubMed
    1. Balasubramanian S, Sureshkumar S, Lempe J, Weigel D. Potent induction of Arabidopsis thaliana Flowering by elevated growth temperature. PLoS Genet. 2006;2:e106. doi: 10.1371/journal.pgen.0020106. - DOI - PMC - PubMed
    1. Goeckeritz C, Hollender CA. There is more to flowering than those DAM genes: the biology behind bloom in rosaceous fruit trees. Curr Opin Plant Biol. 2021 doi: 10.1016/j.pbi.2020.101995. - DOI - PubMed

MeSH terms