. 2024 Sep;11(34):e2404275.
doi: 10.1002/advs.202404275. Epub 2024 Jul 8.

Hypoxia-Preconditioned BMSC-Derived Exosomes Induce Mitophagy via the BNIP3-ANAX2 Axis to Alleviate Intervertebral Disc Degeneration

Affiliations

Hypoxia-Preconditioned BMSC-Derived Exosomes Induce Mitophagy via the BNIP3-ANAX2 Axis to Alleviate Intervertebral Disc Degeneration

Yuxin Jin et al. Adv Sci (Weinh). 2024 Sep.

Abstract

Intervertebral disc degeneration (IVDD) is a chronic degenerative disease involving the aging and loss of proliferative capacity of nucleus pulposus cells (NPCs), processes heavily dependent on mitochondrial dynamics and autophagic flux. This study finds that the absence of BCL2/adenovirus E1B 19 kDa interacting protein 3 (BNIP3) is associated with senescence-related NPC degeneration, disrupting mitochondrial quality control. Bone marrow mesenchymal stem cells (BMSCs) have multidirectional differentiation potential and produce extracellular vesicles containing cellular activators. Therefore, in this study, BMSCs are induced under hypoxic stimulation to deliver BNIP3-rich extracellular vesicles to NPCs, thereby alleviating aging-associated mitochondrial autophagic flux, promoting damaged mitochondrial clearance, and restoring mitochondrial quality control. Mechanistically, BNIP3 is shown to interact with the membrane-bound protein annexin A2 (ANXA2), enabling the liberation of the transcription factor EB (TFEB) from the ANXA2-TFEB complex, promoting TFEB nuclear translocation, and regulating autophagy and lysosomal gene activation. Furthermore, a rat model of IVDD is established and verified the in vivo efficacy of the exosomes in repairing disc injuries, delaying NPC aging, and promoting extracellular matrix (ECM) synthesis. In summary, hypoxia-induced BMSC exosomes deliver BNIP3-rich vesicles to alleviate disc degeneration by activating the mitochondrial BNIP3/ANXA2/TFEB axis, providing a new target for IVDD treatment.

Keywords: Intervertebral disc degeneration; bone marrow mesenchymal stem cells; exosomes; hypoxia‐preconditioned mesenchymal stem cells; matrix reconstruction; mitophagy.


Conflict of interest statement

The authors declare no conflict of interest.

Figures

Scheme 1
Scheme 1
Revealing the exosome therapy strategy of hypoxia preconditioning and its specific molecular mechanisms in IVDD.
Figure 1
Figure 1
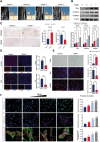
Mitochondrial damage and BNIP3 downregulation in senescent degenerating nucleus pulposus tissues. A) T2‐weighted magnetic resonance imaging (MRI) was utilized to procure human nucleus pulposus tissues exhibiting varying degrees of degeneration, as per the Pfirrmann grading system. B) Senescence‐associated proteins (tumor protein 53 [TP53], cyclin‐dependent kinase inhibitor 1A [CDKN1A], and cyclin‐dependent kinase inhibitor 2A [CDKN2A]) in degenerated tissues were quantitatively evaluated via western blotting. n = 3, *p < 0.05; **p < 0.01; ***p < 0.001; ****p < 0.0001; ns, not significant. C) Immunohistochemical staining was performed to examine the expression of CDKN2A and BNIP3 in different degenerating tissues. n = 3, scale bar: 500 µm. *p < 0.05. D) Tissue fluorescence assessment of BNIP3 expression in degenerating human and rat nucleus pulposus tissue. Human tissue: n = 3, scale bar: 100 µm. Rat tissue: n = 3, scale bar: 200 µm. **p < 0.01; ***p < 0.001. E) Nucleus pulposus cells were stimulated with tert‐butyl peroxide (TBHP), and differences between the TBHP‐treated and control groups were assessed by β‐galactosidase, EdU, and immunofluorescence staining. β‐gal and EdU: n = 3, scale bar: 100 µm. Immunofluorescence staining for BNIP3; scale bar: 50 µm. **p < 0.01; ***p < 0.001. F) Mitochondrial function in isolated human nucleus pulposus cells was evaluated by 2′−7′ dichlorofluorescein (DCFH‐DA), MitoSox, and MitoTracker assays following exposure to TBHP at concentrations of 10, 20, 30, and 40 µmol/mL. DCFH‐DA: n = 3, scale bar: 100 µm. MitoSox: n = 3, scale bar: 100 µm. MitoTracker: n = 3, scale bar: 20 µm. *p < 0.05; **p < 0.01; ***p < 0.001; ****p < 0.0001; ns, not significant. Data are expressed as mean ± standard deviation.
Figure 2
Figure 2
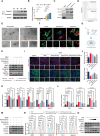
Characteristics and functional analysis of exosomes in human bone marrow‐derived mesenchymal stem cells (HBMSCs) subjected to hypoxic conditions. A) Hypoxia‐inducible factor 1 (HIF‐1) expression in HBMSCs was detected by western blotting after subjecting them to hypoxia for 4, 8, 12, or 24 h. B) The quantitative analysis of western blotting: n = 3, ****p < 0.0001; ns, not significant. C) Surface marker proteins (tumor susceptibility 101 [TSG101], heat shock protein 70 [HSP70], CD63 and endoplasmic reticulum protein [Calnexin]) of exosomes in hypoxia‐treated cells (hypoxia‐exo) and those of the normoxia‐treated group (normoxia‐exo) were quantified using western blotting. D) Nanoparticle tracking analysis revealed that both hypoxia‐exo and normoxia‐exo had a size distribution ranging from 40–150 nm. E) Differences in exosome morphology were observed under transmission electron microscopy. Scale bar: 5 µm. F) Exosomes were labeled with PKH26 and co‐incubated with nucleus pulposus cells for 24 h. Laser confocal microscopy demonstrated that hypoxia‐exo had stronger endocytosis efficiency than did normoxia‐exo. Scale bar: 20 µm. G) A schematic diagram was created to illustrate the co‐incubation process. H) Western blot analysis of catabolism‐ (matrix metallopeptidase 3 [MMP3], matrix metallopeptidase 13 [MMP13], and ADAM metallopeptidase with thrombospondin type 1 motif 5 [ADAMTS5]) and anabolism‐related markers (collagen II [COL‐II] and aggrecan) after different treatments. I) Immunofluorescence staining of biomarkers related to matrix catabolism (MMP13; red) and anabolism (COL‐II; green). Scale bar: 100 µm. J) Quantitative analysis of MMP13 and COL‐II fluorescence intensity. n = 3, **p < 0.01; ***p < 0.001; ****p < 0.0001; ns, not significant. K) Quantitative analysis of MMP3, MMP13, ADAMTS5, COL‐II, and aggrecan expression. n = 3, *p < 0.05; **p < 0.01; ***p < 0.001; ****p < 0.0001; ns, not significant. L) Quantitative analysis of the senescence‐related markers tumor protein 53 (TP53)/p53, cyclin dependent kinase inhibitor 1A (CDKN1A)/p21, and cyclin dependent kinase inhibitor 2A (CDKN2A)/p16 expression. n = 3, **p < 0.01, ****p < 0.0001. M) Western blot analysis of senescence‐related markers (TP53/p53, CDKN1A/p21, and CDKN2A/p16). N) Quantitative analysis of exosome function after proteinase K pretreatment. n = 3, *p < 0.05; **p < 0.01; ***p < 0.001; ****p < 0.0001; ns, not significant. O) Western blot analysis of exosome function after proteinase K pretreatment. Data are expressed as mean ± standard deviation. BMSC, bone mesenchymal stem cell.
Figure 3
Figure 3
Imaging assessment and histologic evaluation after exosomal treatment in vivo. A) Postoperative X‐ray assessment of rats with intervertebral disc degeneration (IVDD) at 4 and 8 w (n = 4). B) Postoperative magnetic resonance imaging (MRI) assessment of rats at 4 and 8 w (n = 4). C) Quantitative analysis of rat disc height index scores and Pfirrmann grades. *p < 0.05; **p < 0.01; ***p < 0.001; ****p < 0.0001; ns, not significant. D) Hematoxylin and eosin (HE) staining images of rat caudal spines 4 and 8 w after surgery (n = 4). Scale bar: 1 mm. E) Safranin‐O/Fast Green (SF) staining images 4 and 8 w after surgery (n = 4). Scale bar: 1 mm. F) Immunohistochemistry of matrix metallopeptidase 13 (MMP13) and collagen II (COL‐II) 4 and 8 w after surgery (n = 4). Scale bar: 500 µm. G) Quantitative analysis of the data was plotted as heat maps based on the morphology of the nucleus pulposus, cellularity of the nucleus pulposus, border between the anulus fibrosus and nucleus pulposus, morphology of the anulus fibrosus, and cellularity of the anulus fibrosus. Data are expressed as mean ± standard deviation.
Figure 4
Figure 4
Hypoxic exosomes protect nucleus pulposus cells (NPCs) from oxidative stress‐induced mitochondrial dysfunction. A) Differential gene enrichment maps in hypoxic and normoxic exosomes. B) Differential gene pathway enrichment analysis (Kyoto Encyclopedia of Genes and Genomes [KEGG] analysis). C) Gene ontology (GO) analysis of differential genes. D) Volcano plot showing differential gene expression in hypoxic and normoxic groups. False discovery rate < 0.001, logFC > 1.5. E) Western blot analysis of BCL2/adenovirus E1B 19 kDa interacting protein 3 (BNIP3) levels in tert‐butyl peroxide (TBHP)‐treated NPCs. n = 3, **p < 0.01. F) Western blot analysis of BNIP3 levels in NPCs treated with hypoxic versus normoxic exosomes. n = 3, **p < 0.01. G) Mitochondrial length measurements of NPCs under TBHP stimulation. n = 3, scale bar: 20 µm. ****p < 0.0001. H,I) Co‐localization of PKH67‐labeled exosomes with MitoTracker‐labeled mitochondria. n = 3, scale bar: 20 µm. J) Fluorescence analysis of hypoxic and normoxic exosomes for mitochondrial membrane potential (JC‐1; scale bar: 100 µm) and mitochondrial morphology (MitoTracker; scale bar: 50 µm). Mitochondrial reactive oxygen species (MitoSox) in NPCs. Scale bar: 100 µm. K) Quantitative analysis of relative fluorescence intensity of JC‐1 and MitoSox, as well as quantification of mitochondrial fragmentation ratio. n = 3, *p < 0.05; **p < 0.01; ***p < 0.001; ****p < 0.0001; ns, not significant. Data are expressed as mean ± standard deviation.
Figure 5
Figure 5
BCL2/adenovirus E1B 19 kDa interacting protein 3 (BNIP3) maintains mitochondrial homeostasis through autophagy activation. A) Western blot analysis of BNIP3, LC3, and P62 expression in wild‐type and BNIP3‐knockout NPCs treated with tert‐butyl peroxide (TBHP) with or without exosomes from hypoxia‐treated cells (hypoxia‐exo). B) Quantification of BNIP3, LC3, and P62 expression. n = 3, *p < 0.05; ***p < 0.001; ****p < 0.0001; ns, not significant. C) Mitochondrial morphology changes as observed by transmission electron microscopy. D) Double‐immunofluorescence staining of MitoTracker and BNIP3. Scale bar: 20 µm. E) Quantitative analysis of fluorescence intensity of BNIP3 and mitochondrial length measurements in different treatment groups. n = 3, **p < 0.01; ****p < 0.0001; ns, not significant. F) Immunofluorescence detection of changes in the fluorescence intensity of LC3 and translocase of outer mitochondrial membrane 20 (TOMM20) in nucleus pulposus cells (NPCs) after different treatments. Scale bar: 20 µm. G) X‐ray images of BNIP3 wild type (BNIP3 WT) and BNIP3‐/‐ mice after different treatments. H,I) Hematoxylin and eosin (HE) and Safranin‐O (SO) staining of BNIP3 WT and BNIP3‐/‐ mice. Scale bar: 1 mm. J,K) Immunohistochemical analysis of cyclin dependent kinase inhibitor 2A (CDKN2A) expression in BNIP3 WT and BNIP3‐/‐ mice. Scale bar: 200 µm. Data are expressed as mean ± standard deviation.
Figure 6
Figure 6
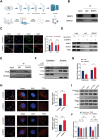
The BCL2/adenovirus E1B 19 kDa interacting protein 3 (BNIP3)–annexin A2 (ANXA2) interaction influences transcription factor EB (TFEB) localization. A) Schematic representation of co‐immunoprecipitation (CO‐IP) and mass spectrometry. B) BNIP3 interaction with ANXA2 demonstrated by CO‐IP. n = 3. C) Differential expression of BNIP3 and ANXA2 following overexpression or empty vector expression assessed by immunofluorescence staining analysis. n = 3, scale bar: 50 µm. D) Nucleus pulposus cells (NPCs) were transfected with either an BNIP3 plasmid to overexpress BNIP3 or an empty plasmid, followed by CO‐IP to validate the reciprocal binding between BNIP3, ANXA2, and TFEB. n = 3. E) CO‐IP experiment confirming TFEB binding to ANXA2. n = 3. F) NPCs were subjected to ANXA2 knockdown, and subsequent western blot analysis was employed to examine the cytoplasmic and nuclear expression levels of ANXA2 and TFEB proteins. n = 3. G) Quantitative analysis of cytoplasmic and cytosolic TFEB expression was performed. n = 3, *p < 0.05. H) In NPCs, ANXA2 was either silenced or BNIP3 was overexpressed, and the spatial localization of TFEB was assessed using immunofluorescence. n = 3, scale bar: 50 µm, **p < 0.01. I) Spatial changes in TFEB expression were analyzed by western blot analysis following treatment with tert‐butyl peroxide (TBHP) or an overexpression control plasmid (oe‐control) or overexpression of BNIP3 (oe‐BNIP3) in NPCs. J) Quantification of cytoplasmic and nuclear TFEB expression. n = 3, **p < 0.01; ****p < 0.0001; ns, not significant. Data are expressed as mean ± standard deviation.
Figure 7
Figure 7
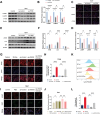
The influence of TFEB abundance and subcellular localization on lysosomal function. A) Expression analysis of lysosomal associated membrane protein (LAMP)−1, LAMP2, and cathepsin D (CTSD) using western blot analysis. B) Quantitative assessment of relative protein levels of LAMP1, LAMP2, and CTSD. n = 3, *p < 0.05, ****p < 0.0001. C) Fluorescence intensity detection of LAMP1, LAMP2, and CTSD by immunofluorescence assay. Scale bar: 50 µm. D) Quantitative analysis of LAMP1, LAMP2, and CTSD using immunofluorescence. n = 3, *p < 0.05, **p < 0.01, ***p < 0.001. E) Expression analysis of LC3, autophagy related 5 (ATG5), and P62 using western blot analysis. F) Protein quantification analysis of LC3, ATG5, and P62. n = 3, *p < 0.05; **p < 0.01; ****p < 0.0001; ns, not significant. G) Spatial distribution analysis of TFEB after different treatments using immunofluorescence. Scale bar: 100 µm. H) Quantitative analysis of nuclear/cytoplasmic protein ratio of TFEB. n = 3, ****p < 0.0001; ns, not significant. I) Immunofluorescence staining for LMAP1 and galectin‐3 GAL3 after different treatments. Scale bar: 50 µm. J) Quantitative analysis of GAL3 fluorescence intensity. n = 3, *p < 0.05, **p < 0.01. K) Treatment with 20‐deoxyingenol enhances TFEB nuclear translocation to augment Lyso Tracker Red staining. L) Quantitative analysis of the relative changes in Lyso Tracker Red. **p < 0.01; ***p < 0.001. Data are expressed as mean ± standard deviation.
Figure 8
Figure 8
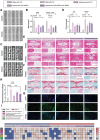
The BCL2/adenovirus E1B 19 kDa interacting protein 3 (BNIP3)/annexin A2 (ANXA2) axis regulates the progression of intervertebral disc degeneration (IVDD) in vivo. A) X‐ray images of rat tail vertebrae were taken at 4 and 8 w post‐injection with adenoviral‐associated viruses (AAVs). B) Quantitative analysis of rat disc height index scores. n = 4, **p < 0.01; ***p < 0.001; ****p < 0.0001; C) Magnetic resonance imaging (MRI) with T2‐weighted sequences was conducted at 4 and 8 w post‐injection with AAVs. D) Quantitative analysis of Pfirrmann grades. n = 4, *p < 0.05; **p < 0.01; ***p < 0.001; ****p < 0.0001; E) Hematoxylin and eosin (HE) staining of rat tail vertebrae slices after different treatments. Scale bar: 1 mm. F) Safranin‐O/Fast Green (SO) staining of rat tail vertebrae slices after different treatments. Scale bar: 1 mm. G) Fluorescent staining images of cyclin dependent kinase inhibitor 2A (CDKN2A) in rat tail vertebrae slices from each experimental group. Scale bar: 200 µm. H) Quantitative analysis of the relative fluorescence intensity of CDKN2A in each experimental group. n = 4, ***p < 0.001; ****p < 0.0001; I) Plotting histological scores of each experimental group in heatmap format. n = 4. Data are expressed as mean ± standard deviation.

References

    1. a) Cieza A., Causey K., Kamenov K., Hanson S. W., Chatterji S., Vos T., Lancet 2020, 396, P2006; - PMC - PubMed
    2. b) Hartvigsen J., Hancock M. J., Kongsted A., Louw Q., Ferreira M. L., Genevay S., Hoy D., Karppinen J., Pransky G., Sieper J., Smeets R. J., Underwood M., Lancet Low Back Pain Series Working Group Lancet, 2018, 391, 2356. - PubMed
    1. Knezevic N. N., Candido K. D., Vlaeyen J. W. S., Van Zundert J., Cohen S. P., Lancet 2021, 398, 78. - PubMed
    1. Du X., Liang K., Ding S., Shi H., Biomedicines 2023, 11, 2467. - PMC - PubMed
    1. a) He R., Wang Z., Cui M., Liu S., Wu W., Chen M., Wu Y., Qu Y., Lin H., Chen S., Wang B., Shao Z., Autophagy 2021, 17, 3338; - PMC - PubMed
    2. b) Krut Z., Pelled G., Gazit D., Gazit Z., Cells 2021, 10, 2241. - PMC - PubMed
    1. a) Chen S., Wu X., Lai Y., Chen D., Bai X., Liu S., Wu Y., Chen M., Lai Y., Cao H., Shao Z., Xiao G., Bone Res. 2022, 10, 5; - PMC - PubMed
    2. b) Romaniyanto, F. M. , Sigit Prakoeswa C. R., Notobroto H. B., Tinduh D., Ausrin R., Rantam F. A., Suroto H., Utomo D. N., Rhatomy S., Ann. Med. Surg. 2022, 77, 103619. - PMC - PubMed

MeSH terms

LinkOut - more resources