. 2024 Sep;11(36):e2403262.
doi: 10.1002/advs.202403262. Epub 2024 Jul 8.

DCAF7 Acts as A Scaffold to Recruit USP10 for G3BP1 Deubiquitylation and Facilitates Chemoresistance and Metastasis in Nasopharyngeal Carcinoma

Affiliations

DCAF7 Acts as A Scaffold to Recruit USP10 for G3BP1 Deubiquitylation and Facilitates Chemoresistance and Metastasis in Nasopharyngeal Carcinoma

Qing-Jie Li et al. Adv Sci (Weinh). 2024 Sep.

Abstract

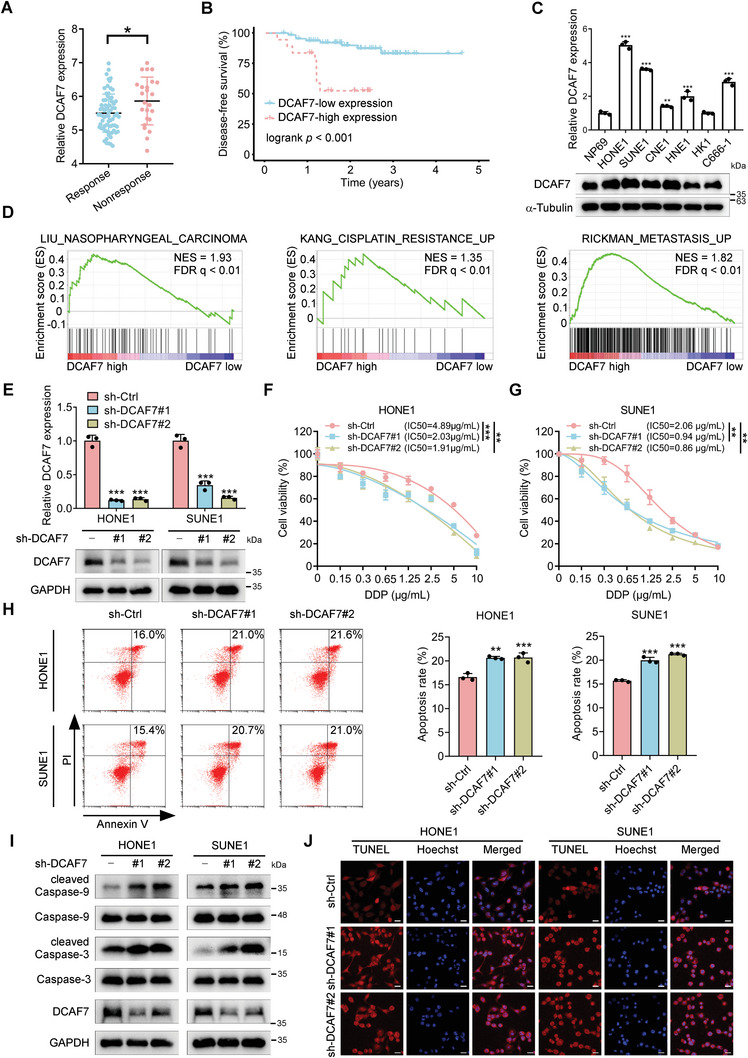
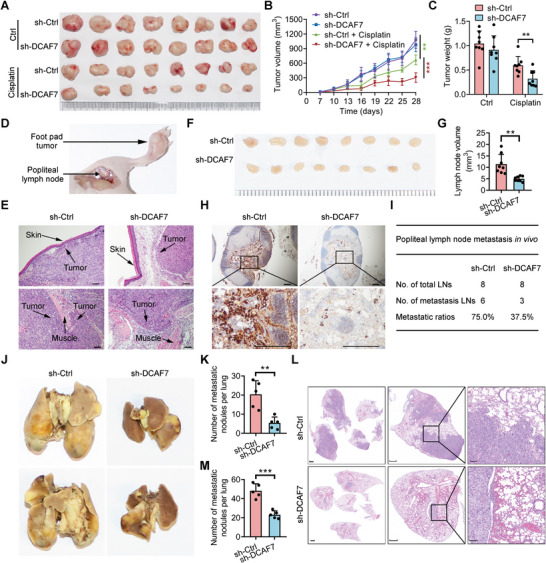
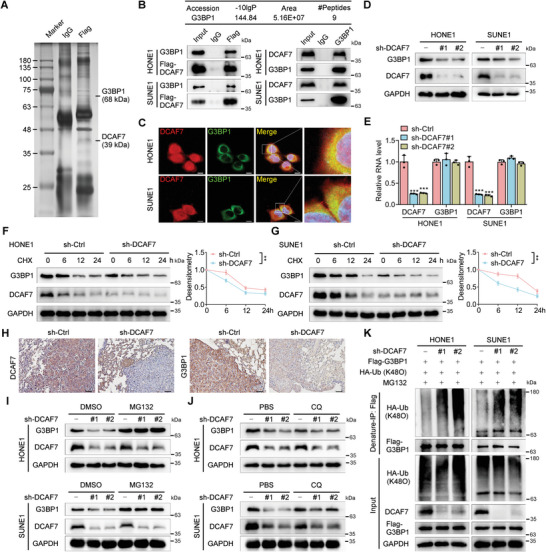
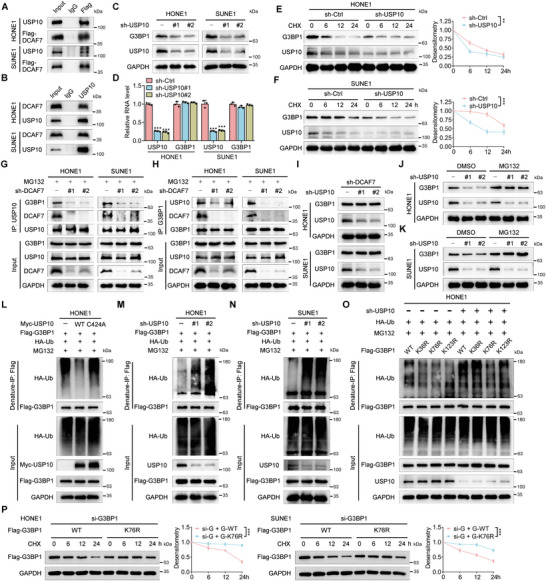
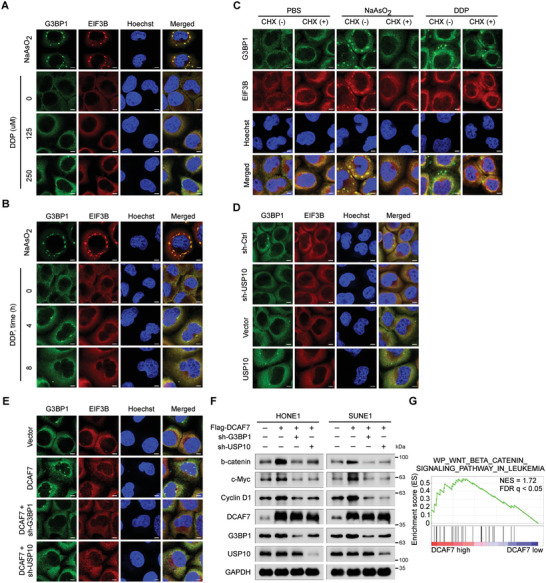
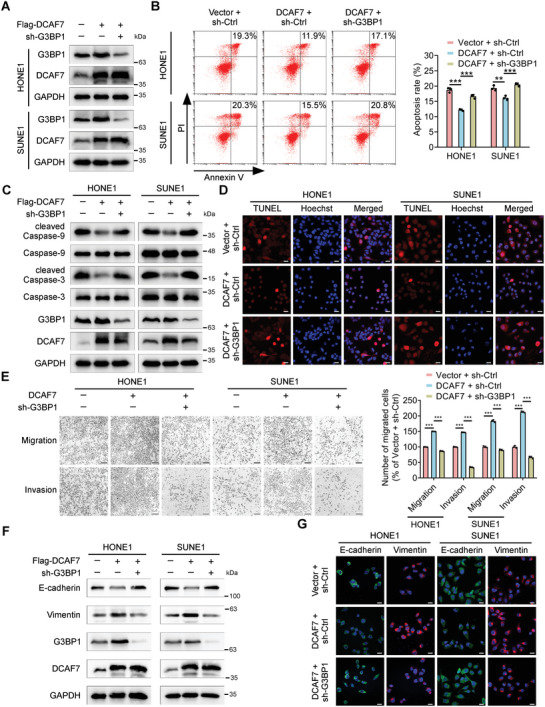
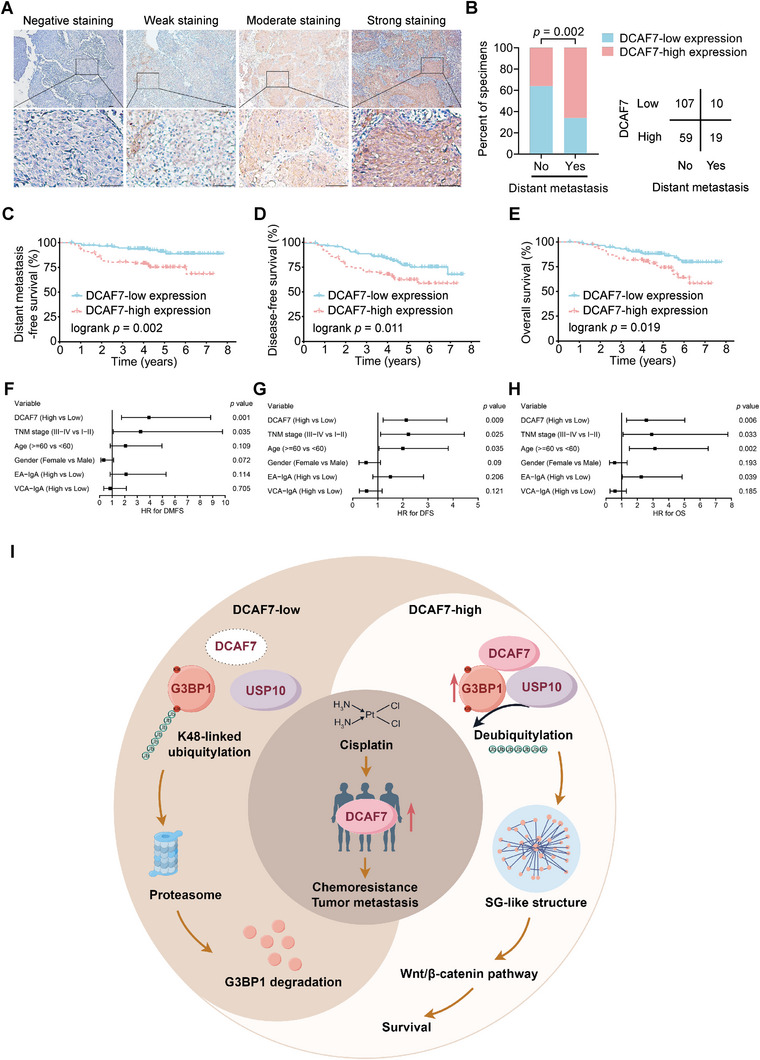
Despite docetaxel combined with cisplatin and 5-fluorouracil (TPF) being the established treatment for advanced nasopharyngeal carcinoma (NPC), there are patients who do not respond positively to this form of therapy. However, the mechanisms underlying this lack of benefit remain unclear. DCAF7 is identified as a chemoresistance gene attenuating the response to TPF therapy in NPC patients. DCAF7 promotes the cisplatin resistance and metastasis of NPC cells in vitro and in vivo. Mechanistically, DCAF7 serves as a scaffold protein that facilitates the interaction between USP10 and G3BP1, leading to the elimination of K48-linked ubiquitin moieties from Lys76 of G3BP1. This process helps prevent the degradation of G3BP1 via the ubiquitin‒proteasome pathway and promotes the formation of stress granule (SG)-like structures. Moreover, knockdown of G3BP1 successfully reversed the formation of SG-like structures and the oncogenic effects of DCAF7. Significantly, NPC patients with increased levels of DCAF7 showed a high risk of metastasis, and elevated DCAF7 levels are linked to an unfavorable prognosis. The study reveals DCAF7 as a crucial gene for cisplatin resistance and offers further understanding of how chemoresistance develops in NPC. The DCAF7-USP10-G3BP1 axis contains potential targets and biomarkers for NPC treatment.

Keywords: DCAF7; chemoresistance; chemotherapy; deubiquitylation; nasopharyngeal carcinoma.


Conflict of interest statement

The authors declare no conflict of interest.

Figures

Figure 1
Figure 1
DCAF7 is associated with chemoresistance and indicates a poor prognosis. A) mRNA expression levels of DCAF7 in NPC patients who received TPF chemotherapy, based on the GSE132112 dataset. Student's t‐test, * p < 0.05. B) Kaplan–Meier survival analysis of patients with NPC in the GSE102349 dataset (n = 88) stratified by DCAF7 expression (high vs low). C) RT‒qPCR and western blot analysis results showing the mRNA and protein expression levels, respectively, of DCAF7 in NPC and NP69 cells. Mean (n = 3) ± s.d. One‐way ANOVA, ** p < 0.01, *** p < 0.001. D) GSEA of the GSE102349 dataset revealed positive enrichment of genes associated with NPC, cisplatin resistance and metastasis signatures in response to high DCAF7 expression. E) The DCAF7 knockdown efficiency was assessed using RT‒qPCR and western blotting. Mean (n = 3) ± s.d. One‐way ANOVA, *** p < 0.001. F,G) A CCK‐8 assay was used to evaluate cisplatin resistance in transfected NPC cells following treatment with the indicated concentrations of cisplatin for 48 h. Mean (n = 4) ± s.d. Two‐way ANOVA, ** p < 0.01, *** p < 0.001. H) NPC cells were exposed to cisplatin (2.5 µg mL−1) for 24 h, and cisplatin‐induced apoptosis was measured via Annexin‐V/PI staining and flow cytometry. Mean (n = 3) ± s.d. One‐way ANOVA, ** p < 0.01, *** p < 0.001. I) NPC cells were treated with cisplatin (10 µg mL−1) for 24 h. The levels of apoptosis‐related proteins, including Caspase3/9 and cleaved Caspase3/9, were measured via western blotting. J) NPC cells were treated with cisplatin (10 µg mL−1) for 24 h, and cisplatin‐induced apoptosis was detected using a TUNEL assay. Scale bars = 20 µm. The unprocessed images of the blots are shown in Figure S10 (Supporting Information).
Figure 2
Figure 2
Knockdown of DCAF7 increases the chemosensitivity and suppresses the metastasis of NPC cells in vivo. A) Representative images displaying xenografts in nude mice. B,C) Growth curves and weights of xenograft tumors subjected to the indicated treatments. Mean (n = 8) ± s.d. Two‐way ANOVA in B, Student's t‐test in C, ** p < 0.01, *** p < 0.001. D) Schematic representation of the in vivo lymphatic metastasis model. E) Representative images of H&E‐stained footpad tumors; scale bars = 100 µm. F,G) Representative images and quantitative data for lymph nodes (n = eight mice per group). Mean (n = 8) ± s.d. Student's t‐test, ** p < 0.01. H,I) IHC images of popliteal lymph nodes stained with an anti‐pancytokeratin antibody, along with the corresponding metastasis rates. Scale bars = 500 µm. J,K) Representative images and quantification of macroscopic lung surface metastatic foci. Mean (n = 8) ± s.d. Student's t‐test, ** p < 0.01. L,M) Histological images of H&E‐stained lung tissue sections and quantification of microscopic lung metastatic foci. Scale bars = 1000 µm (left), 500 µm (middle), 100 µm (right). Mean (n = 8) ± s.d. Student's t‐test, *** p < 0.001.
Figure 3
Figure 3
Knockdown of DCAF7 facilitates the degradation of G3BP1 by increasing its K48‐linked polyubiquitination. A) Flag‐DCAF7‐ or vector‐transfected SUNE1 cells were subjected to immunoprecipitation with an anti‐Flag antibody, followed by SDS‒PAGE and silver staining of proteins. The proteins in the bands were analyzed by MS. B) The mass spectrometry results identifying G3BP1 as a potential binding partner of DCAF7 (top). Immunoprecipitation (IP) with an anti‐Flag or anti‐G3BP1 antibody and immunoblot analysis (IB) of G3BP1, Flag or DCAF7 expression in HONE1 and SUNE1 cells transfected with or without Flag‐DCAF7 (bottom). C) Confocal microscopy images showing the colocalization of DCAF7 and G3BP1 in HONE1 and SUNE1 cells. Scale bars: 10, 2 µm (magnified graphs). D,E) Western blotting and RT‒qPCR were used to measure the protein and mRNA levels of G3BP1 in HONE1 and SUNE1 cells following DCAF7 knockdown. Mean (n = 3) ± s.d. One‐way ANOVA, *** p < 0.001. F,G) IB of G3BP1, DCAF7 and GAPDH (left) in HONE1 and SUNE1 cells transduced with sh‐DCAF7 or sh‐control following CHX treatment for the indicated times. Plots showing the normalized G3BP1 levels are also presented (right). Mean (n = 3) ± s.d. Two‐way ANOVA, ** p < 0.01. H) IHC staining for DCAF7 and G3BP1 in the lung metastatic nodules of the mouse model. Scale bar: 50 µm. I,J) IB of G3BP1, DCAF7 and GAPDH in HONE1 and SUNE1 cells transduced with sh‐control or sh‐DCAF7 following treatment with MG132 (10 µm) or CQ (50 µm). K) Denaturing IP (with an anti‐Flag antibody) and IB of HA, Flag, DCAF7 and GAPDH in HONE1 and SUNE1 cells transfected with the indicated plasmids following MG132 treatment (10 µm, 6 h). The unprocessed images of the blots are shown in Figure S10 (Supporting Information).
Figure 4
Figure 4
DCAF7 recruits USP10 to deubiquitylate and stabilize G3BP1. A,B) IP (with an anti‐FLAG antibody or IgG) was conducted to validate the interaction between DCAF7 and USP10 in SUNE1 and HONE1 cells transfected with Flag‐DCAF7. C,D) Protein and mRNA levels of G3BP1 in HONE1 and SUNE1 cells with or without USP10 knockdown. Mean (n = 3) ± s.d. One‐way ANOVA, *** p < 0.001. E,F) Protein level of G3BP1 in HONE1 and SUNE1 cells with or without USP10 knockdown following CHX treatment (100 µg mL−1) for the indicated times. Mean (n = 3) ± s.d. Two‐way ANOVA, ** p < 0.01. G,H) IP (with an anti‐USP10 or anti‐G3BP1 antibody) and IB of G3BP1, DCAF7 and USP10 in HONE1 and SUNE1 cells transduced with sh‐control or sh‐DCAF7 following MG132 treatment (10 µm, 6 h). I) IB of G3BP1, USP10 and GAPDH in DCAF7‐knockdown HONE1 and SUNE1 cells transduced with sh‐control or sh‐USP10. J,K) IB of G3BP1, USP10 and GAPDH in HONE1 and SUNE1 cells transduced with sh‐control or sh‐USP10 following MG132 treatment (10 µm, 6 h). L–N) Denaturing IP with an anti‐Flag antibody and IB of HA‐Ub, Flag‐G3BP1, Myc‐USP10 and GAPDH in HONE1 and SUNE1 cells transfected with the indicated plasmids following MG132 treatment (10 µm, 6 h). O) Denaturing IP with an anti‐Flag antibody and IB of HA‐Ub, Flag‐G3BP1, USP10 and GAPDH in HONE1 cells transfected with the indicated plasmids following MG132 treatment (10 µm, 6 h). P) Protein level of Flag‐G3BP1 in HONE1 and SUNE1 cells transfected with indicated siRNA and plasmids following CHX treatment (100 µg mL−1) for the indicated times. Mean (n = 3) ± s.d. Two‐way ANOVA, ** p < 0.01. The unprocessed images of the blots are shown in Figure S10 (Supporting Information).
Figure 5
Figure 5
DCAF7 facilitates cisplatin‐induced formation of SG‐like structures. A,B) IF staining (with an anti‐G3BP1 or anti‐EIF3B antibody) of HONE1 cells subjected to stress induction via cisplatin (0, 125, or 250 µm) for 4 h (A) or to cisplatin treatment (250 µm) for 0, 4, or 8 h (B). As a positive control, cells were treated with 500 µm sodium arsenite (NaAsO2) for 1 h to induce robust SG formation. C) Cells were incubated with NaAsO2 (500 µm for 1 h) or cisplatin (250 µm for 4 h) and then treated with CHX (100 µg mL−1 for 30 min) for forced SG disassembly, and immunostaining for G3BP1 and EIF3B was then performed. D,E) IF staining (with an anti‐G3BP1 or anti‐EIF3B antibody) of HONE1 cells transfected with the indicated plasmids following cisplatin (250 µm) treatment for 4 h. The scale bar corresponds to 5 µm (A–E). F) IB of β‐catenin, c‐Myc, Cyclin D1, G3BP1, DCAF7, USP10 and GAPDH in HONE1 and SUNE1 cells transfected with the indicated plasmids following cisplatin treatment (10 µg mL−1) for 24 h. G) GSEA of the GSE102349 dataset demonstrated positive enrichment of genes associated with Wnt/β‐catenin signalling in response to DCAF7 overexpression. The unprocessed images of the blots are shown in Figure S10 (Supporting Information).
Figure 6
Figure 6
G3BP1 is required for the oncogenic effect of DCAF7 on NPC progression. A) IB of G3BP1, DCAF7 and GAPDH in HONE1 and SUNE1 cells transfected with the indicated plasmids. B) Annexin V/PI staining and flow cytometric analysis of apoptosis in HONE1 and SUNE1 cells transfected with the indicated plasmids following cisplatin treatment (2.5 µg mL−1) for 24 h. Mean (n = 3) ± s.d. One‐way ANOVA, ** p < 0.01, *** p < 0.001. C) IB of Caspase3/9, cleaved Caspase3/9, G3BP1, DCAF7 and GAPDH in HONE1 and SUNE1 cells treated with cisplatin (10 µg mL−1) for 24 h. D) Evaluation of apoptosis by a TUNEL assay in transfected NPC cells treated with cisplatin (10 µg mL−1) for 24 h. The scale bars represent 20 µm. E) Transwell assays were conducted to assess cell migration and invasion, and representative images and quantitative results are presented. The scale bars represent 200 µm. Mean (n = 3) ± s.d. One‐way ANOVA, *** p < 0.001. F) IB of E‐cadherin, Vimentin, G3BP1, DCAF7 and GAPDH in HONE1 and SUNE1 cells transfected with the indicated plasmids. G) IF (with an anti‐E‐cadherin or anti‐Vimentin antibody) in HONE1 and SUNE1 cells transfected with the indicated plasmids. The scale bars represent 20 µm. The unprocessed images of the blots are shown in Figure S10 (Supporting Information).
Figure 7
Figure 7
DCAF7 is an independent predictor of unfavorable prognosis in NPC patients. A) The protein expression of DCAF7 in 195 NPC tissues was scored based on the staining intensity. Scale bar = 50 µm. B) DCAF7 expression, as evaluated by IHC staining, was associated with the distant metastasis status. A two‐tailed χ2 test was used to calculate P values. C–E) Kaplan–Meier analysis further revealed strong correlations between DCAF7 expression and distant metastasis‐free survival (C), disease‐free survival (D), and overall survival (E), as calculated by the log‐rank test. F–H) Multivariate Cox regression analysis results revealing the prognostic significance of various clinical characteristics of NPC patients with distant metastasis‐free survival (F), disease‐free survival (G) and overall survival (H). I) Proposed working model. DCAF7 was notably upregulated in individuals with TPF‐resistant NPC, thereby enhancing cisplatin resistance and the metastatic potential of NPC cells. Mechanistically, DCAF7 functions as a scaffold to recruit USP10 for deubiquitylation and stabilization of G3BP1, thus facilitating formation of SG‐like structures in NPC cells and increasing the chemoresistance and metastasis of these cells.

References

    1. a) Zhang L., Chen Q. Y., Liu H., Tang L. Q., Mai H. Q., Drug Des. Devel. Ther. 2013, 7, 37; - PMC - PubMed
    2. b) Qiao H., Tan X. R., Li H., Li J. Y., Chen X. Z., Li Y. Q., Li W. F., Tang L. L., Zhou G. Q., Zhang Y., Liang Y. L., He Q. M., Zhao Y., Huang S. Y., Gong S., Li Q., Ye M. L., Chen K. L., Sun Y., Ma J., Liu N., JAMA Oncol. 2022, 8, 1301. - PMC - PubMed
    1. a) Tang L. L., Chen Y. P., Chen C. B., Chen M. Y., Chen N. Y., Chen X. Z., Du X. J., Fang W. F., Feng M., Gao J., Han F., He X., Hu C. S., Hu D. S., Hu G. Y., Jiang H., Jiang W., Jin F., Lang J. Y., Li J. G., Lin S. J., Liu X., Liu Q. F., Ma L., Mai H. Q., Qin J. Y., Shen L. F., Sun Y., Wang P. G., Wang R. S., et al., Cancer Commun. 2021, 41, 1195; - PMC - PubMed
    2. b) Sun Y., Li W. F., Chen N. Y., Zhang N., Hu G. Q., Xie F. Y., Sun Y., Chen X. Z., Li J. G., Zhu X. D., Hu C. S., Xu X. Y., Chen Y. Y., Hu W. H., Guo L., Mo H. Y., Chen L., Mao Y. P., Sun R., Ai P., Liang S. B., Long G. X., Zheng B. M., Feng X. L., Gong X. C., Li L., Shen C. Y., Xu J. Y., Guo Y., Chen Y. M., et al., Lancet Oncol. 2016, 17, 1509.
    1. Peng H., Chen L., Li W. F., Guo R., Mao Y. P., Zhang Y., Guo Y., Sun Y., Ma J., Cancer 2017, 123, 1643. - PubMed
    1. DiRusso C. J., Dashtiahangar M., Gilmore T. D., J. Biol. Chem. 2022, 298, 102628. - PMC - PubMed
    1. Faux M. C., Scott J. D., Cell 1996, 85, 9. - PubMed

MeSH terms

LinkOut - more resources