

A Genome-Wide Association Study Suggests New Susceptibility Loci for Primary Antiphospholipid Syndrome
- PMID: 38973605
- PMCID: PMC11521773
- DOI: 10.1002/art.42947
A Genome-Wide Association Study Suggests New Susceptibility Loci for Primary Antiphospholipid Syndrome
Abstract
Objective: Primary antiphospholipid syndrome (PAPS) is a rare autoimmune disease characterized by the presence of antiphospholipid antibodies and the occurrence of thrombotic events and pregnancy complications. Our study aimed to identify novel genetic susceptibility loci associated with PAPS.
Methods: We performed a genome-wide association study comprising 5,485 individuals (482 affected individuals) of European ancestry. Significant and suggestive independent variants from a meta-analysis of approximately 7 million variants were evaluated for functional and biological process enrichment. The genetic risk variability for PAPS in different populations was also assessed. Hierarchical clustering, Mahalanobis distance, and Dirichlet Process Mixtures with uncertainty clustering methods were used to assess genetic similarities between PAPS and other immune-mediated diseases.
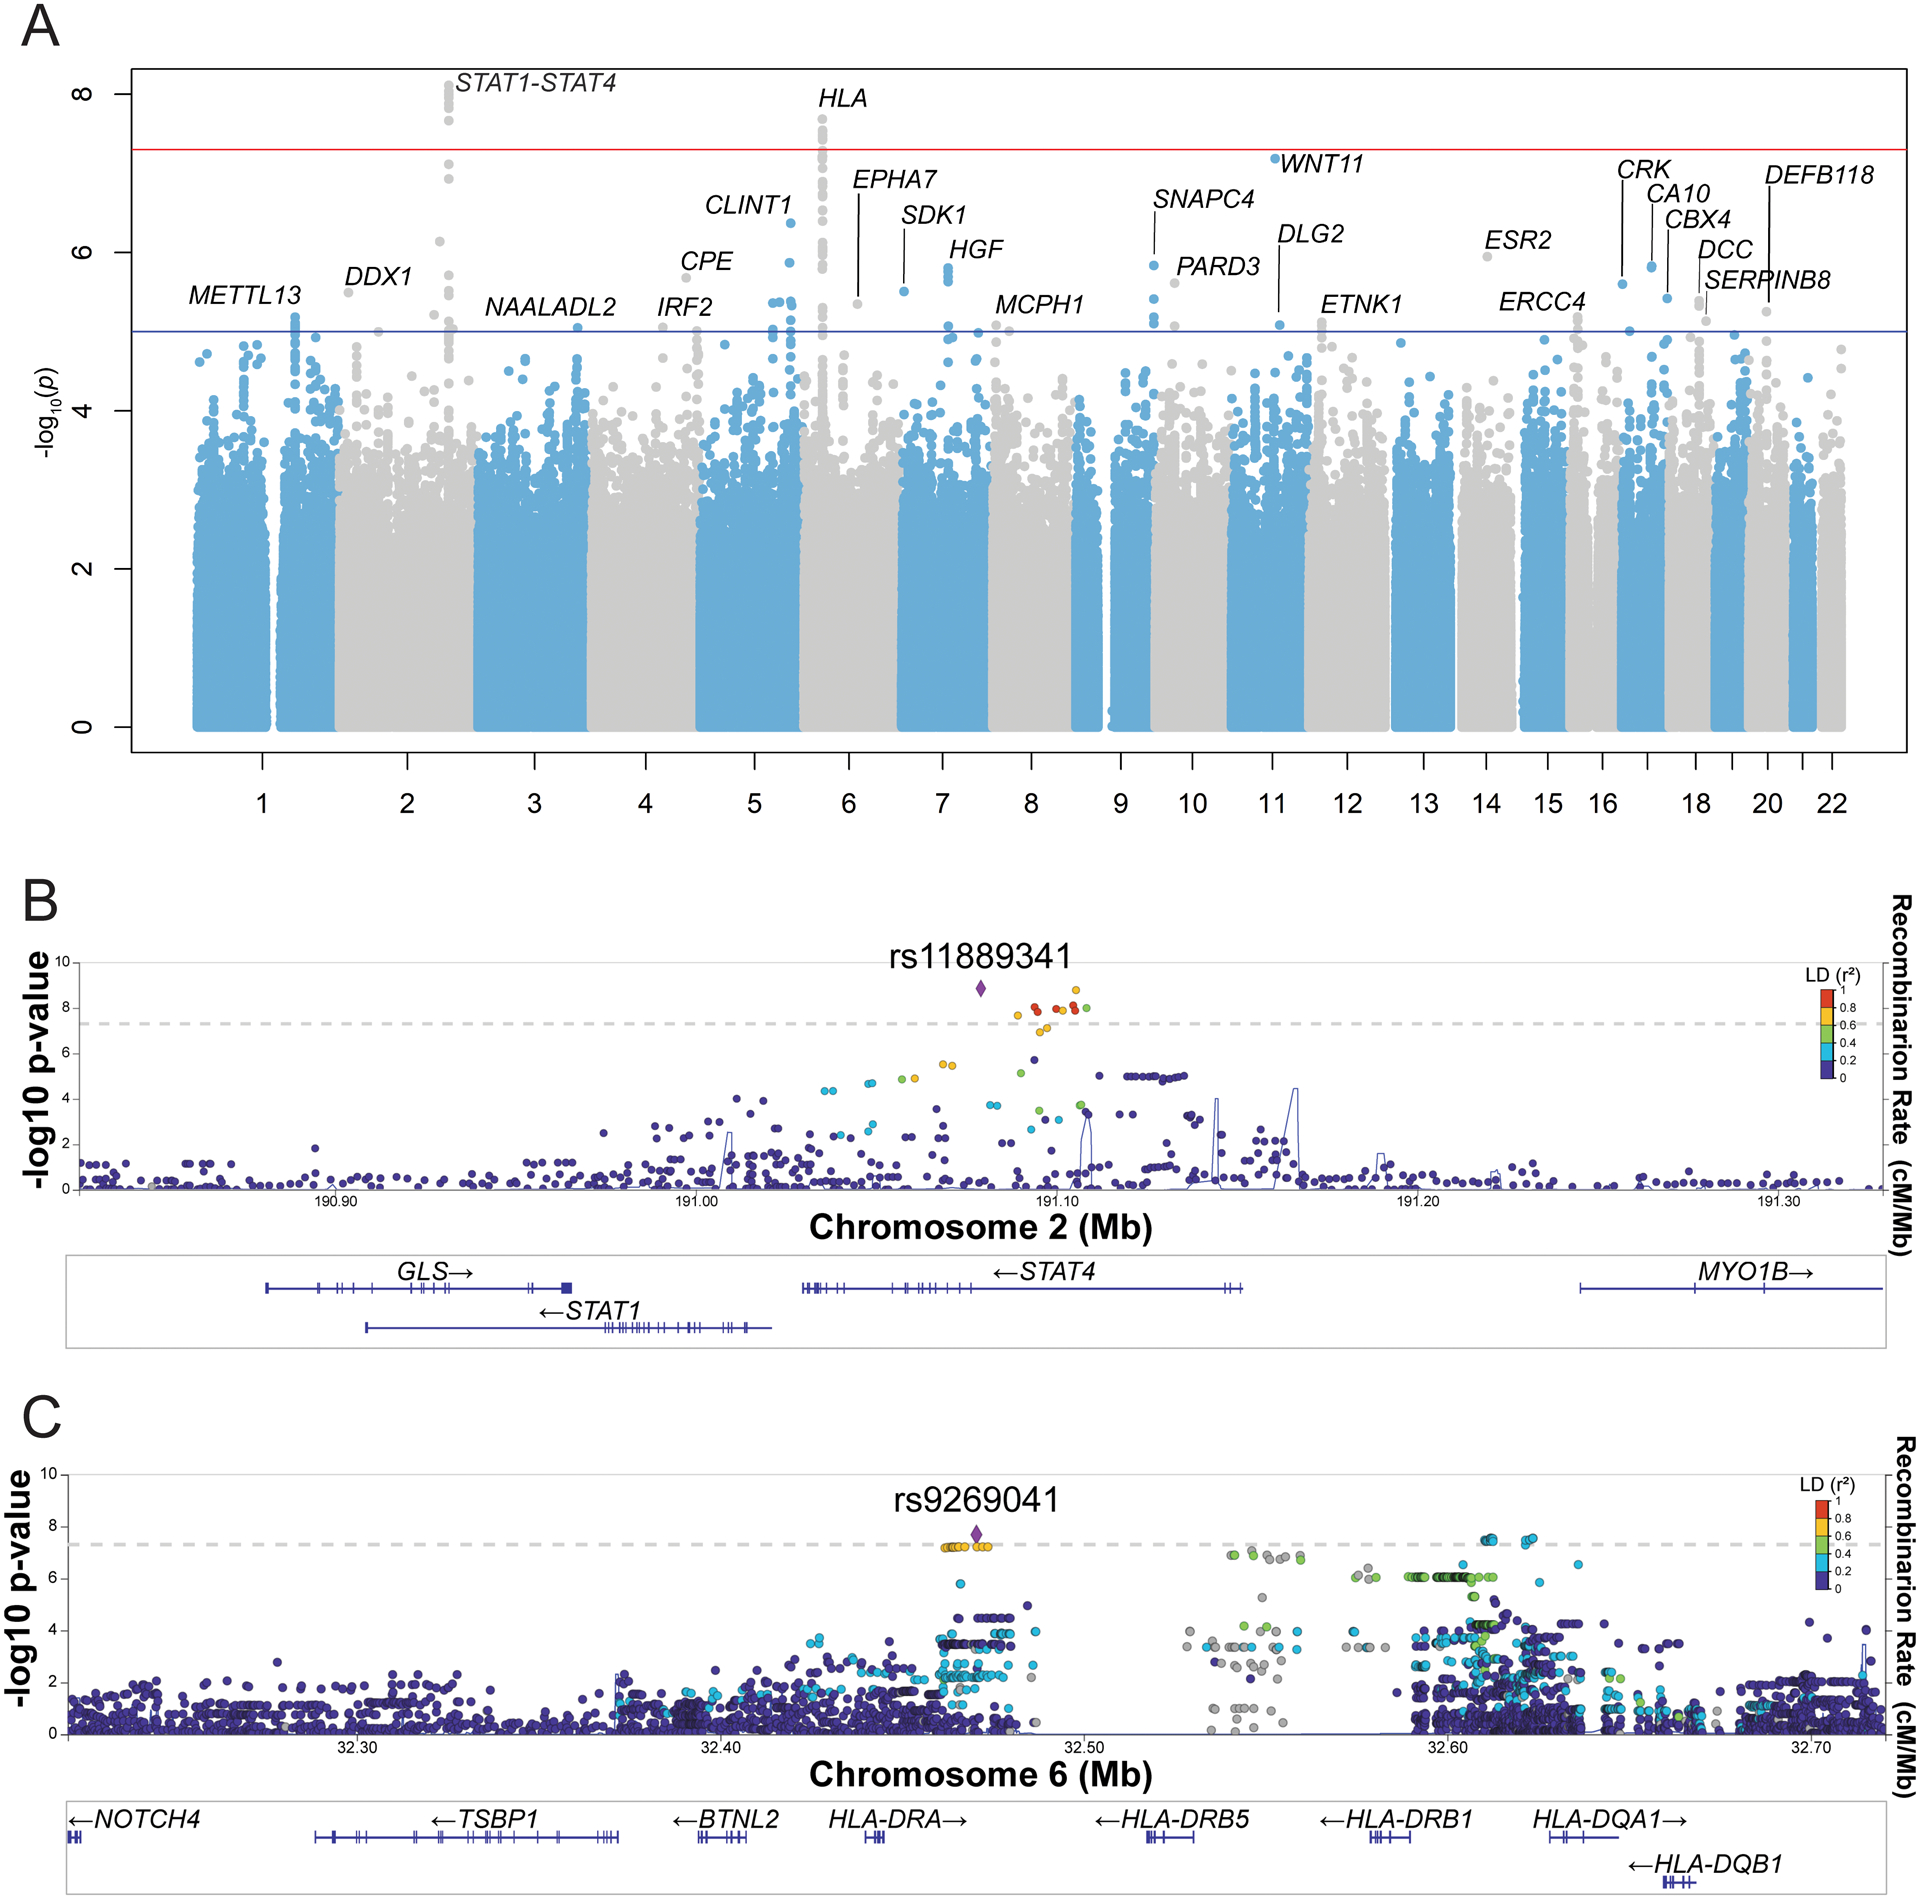
Results: We revealed genetic associations with PAPS in a regulatory locus within the HLA class II region near HLA-DRA and in STAT1-STAT4 with a genome-wide level of significance; 34 additional suggestive genetic susceptibility loci for PAPS were also identified. The disease risk allele near HLA-DRA is associated with overexpression of HLA-DRB6, HLA-DRB9, HLA-DQA2, and HLA-DQB2 in immune cells, vascular tissue, and nervous tissue. This association is independent of the association between PAPS and HLA-DRB1*1302. Functional analyses highlighted immune-related pathways in PAPS-associated loci. The comparison with other immune-mediated diseases revealed a close genetic relatedness to neuromyelitis optica, systemic sclerosis, and Sjögren syndrome, suggesting co-localized causal variations close to STAT1-STAT4, TNPO3, and BLK.
Conclusion: This study represents a comprehensive large-scale genetic analysis for PAPS and provides new insights into the genetic basis and pathophysiology of this rare disease.
© 2024 The Author(s). Arthritis & Rheumatology published by Wiley Periodicals LLC on behalf of American College of Rheumatology.
Conflict of interest statement
None of the authors has any financial conflict of interest to disclose. Dr. Chris Wallace is partially funded by GSK and MSD, and holds a part time position at GSK. Neither funder had any involvement with or influence on this work. Dr. Timothy is an employee and may hold stock/shares at AbbVie Inc. AbbVie Inc had no involvement with or influence on this work.
Figures


Update of
-
A genome-wide association study suggests new susceptibility loci for primary antiphospholipid syndrome.medRxiv [Preprint]. 2023 Dec 5:2023.12.05.23299396. doi: 10.1101/2023.12.05.23299396. medRxiv. 2023. Update in: Arthritis Rheumatol. 2024 Nov;76(11):1623-1634. doi: 10.1002/art.42947. PMID: 38405993 Free PMC article. Updated. Preprint.
References
-
- Hughes GR. The antiphospholipid syndrome: ten years on. Lancet. 1993;342(8867):341–4. - PubMed
-
- Knight JS, Branch DW, Ortel TL. Antiphospholipid syndrome: advances in diagnosis, pathogenesis, and management. BMJ. 2023;380:e069717. - PubMed
-
- Ortiz-Fernandez L, Sawalha AH. Genetics of Antiphospholipid Syndrome. Curr Rheumatol Rep. 2019;21(12):65. - PubMed
MeSH terms
Substances
Grants and funding
- R01 AR070148/AR/NIAMS NIH HHS/United States
- 115565/European Union/European Federation of Pharmaceutical Industries and Associations (EFPIA) Innovative Medicines Initiative Joint Undertaking
- MC UU 00002/4/MRC_/Medical Research Council/United Kingdom
- R01 AI097134/AI/NIAID NIH HHS/United States
- WT_/Wellcome Trust/United Kingdom
- BRC-1215-20014/National Institute for Health and Care Research Cambridge Biomedical Research Centre
- MSD
- WT220788/WT_/Wellcome Trust/United Kingdom
- R01-AI-097134/National Institute of Allergy and Infectious Diseases, NIH
- R01-AR-070148/National Institute of Arthritis and Musculoskeletal and Skin Diseases, NIH
- GSK
LinkOut - more resources
Full Text Sources
Research Materials
Miscellaneous
