. 2024 May 30;9(13):e176383.
doi: 10.1172/jci.insight.176383.

Protein biomarker signature in patients with spinal and bulbar muscular atrophy

Affiliations

Protein biomarker signature in patients with spinal and bulbar muscular atrophy

Andrew Tn Tebbenkamp et al. JCI Insight. .

Abstract

Spinal and bulbar muscular atrophy (SBMA) is a slowly progressing disease with limited sensitive biomarkers that support clinical research. We analyzed plasma and serum samples from patients with SBMA and matched healthy controls in multiple cohorts, identifying 40 highly reproducible SBMA-associated proteins out of nearly 3,000 measured. These proteins were robustly enriched in gene sets of skeletal muscle expression and processes related to mitochondria and calcium signaling. Many proteins outperformed currently used clinical laboratory tests (e.g., creatine kinase [CK]) in distinguishing patients from controls and in their correlations with clinical and functional traits in patients. Two of the 40 proteins, Ectodysplasin A2 receptor (EDA2R) and Repulsive guidance molecule A (RGMA), were found to be associated with decreased survival and body weight in a mouse model of SBMA. In summary, we identified what we believe to be a robust and novel set of fluid protein biomarkers in SBMA that are linked with relevant disease features in patients and in a mouse model of disease. Changes in these SBMA-associated proteins could be used as an early predictor of treatment effects in clinical trials.

Keywords: Genetic diseases; Muscle biology; Neuromuscular disease; Neuroscience; Proteomics.


Figures

Figure 1
Figure 1. Study design.
Illustration outlining the experimental design and analyses. Multiplexed proximity extension assay was used to discover protein biomarkers in the plasma/serum from patients with SBMA. These proteins were then measured against clinical outcomes from these patients and in the AR113Q mouse model of SBMA.
Figure 2
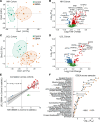
Figure 2. Discovery of protein biomarker signature in SBMA.
(A) PCA of control and patients with SBMA from the NIH cohort (n = 15 SBMA; n = 15 control). Differential abundance in protein expression was calculated using a linear regression framework, adjusting for age. (B) Volcano plot of all measured proteins from the NIH cohort. Proteins in red were increased, and proteins in blue were decreased. Proteins in green were not significantly different (Padj < 0.05 cut-off, dotted red line). Top proteins are labeled, and clinical labs measured in those patients are in bold and italicized. (C) PCA of samples from the UCL cohort (n = 19 SBMA; n = 12 control). (D) Volcano plot as described in B. (E) Correlation of proteins consistent across both cohorts; red indicates increased in both, blue indicates decreased in both, and green indicates inconsistent across cohorts. (F) Gene set enrichment analysis (GSEA) of SBMA proteomic associations showing the tissues and biological functions that were significantly enriched across cohorts.
Figure 3
Figure 3. Replication of SBMA proteomic signature.
(A) PCA of Nido Biosciences SBMA samples (n = 9) compared with control samples from NIH and UCL. (B) Volcano plot of increased (red), decreased (blue), or unchanged (green) proteins. (C) Log2 fold change of 40 SBMA-associated proteins from Nido Bio compared with control samples from NIH (n = 15) and UCL cohorts (n = 12). Data are plotted as mean ± SEM. *P < 0.05; **P < 0.01; ***P < 0.001; ****P < 0.0001.
Figure 4
Figure 4. A heatmap showing the correlations (r) of the 40 SBMA-associated proteins with clinical labs and functional readouts in the same patients using linear regression.
The different cohorts are labeled on the left of the heatmap, proteins and clinical labs (italicized) are labeled on the bottom, and traits are labeled on the right. The dendrogram at the top clusters the proteins via a hierarchical clustering algorithm. #P < 0.1; *P < 0.05; **P < 0.01; ***P < 0.001; ****P < 0.0001 as assessed by linear regression. NA, not applicable; MFF, muscle fat fraction.
Figure 5
Figure 5. Phenotypes and protein signature in AR113Q mice.
(A) Weekly body weight of WT and AR113Q mice from 5–30 weeks of age (2-way ANOVA). At study start, n = 47 for WT and n = 45 for AR113Q, with the number of mice that died each week during the study subtracted. (B) Kaplan-Meier survival plot comparing WT and AR113Q mice. The significance was measured at 30 weeks (Mantel-Cox). (C) Relationship between body weight and survival, categorized by AR113Q mice that died or survived. (D) Volcano plot of 92 proteins, as described previously. The red dashed line represents a P < 0.05 from multilevel metaregression models. (E and F) Volcano plots showing the correlation of protein levels with body weight or rate of death, respectively, across time in AR113Q mice. Eda2r: hazard ratio = 2.63, P = 0.003; Rgma: hazard ratio = 0.019, P = 0.0185 via time-varying Cox proportional hazard ratio models. All proteins below the red dashed line (P < 0.05) were not associated with weight or survival. The β represents the regression coefficient/slope of the model. (G) Differential abundance (log2 fold change) of Eda2r and Rgma between AR113Q and WT at different ages. n = 12 for WT and n = 15–30 for AR113Q mice, depending on each week. Week 18 samples were not available for analysis. ****P < 0.0001. (H) Change in levels of Eda2r and Rgma and association with body weight in AR113Q mice. (I) Change in levels of Eda2r and Rgma over time in AR113Q mice that died.
Figure 6
Figure 6. Contextual summary of 40 SBMA-associated proteins.
All 40 proteins are labeled next to their specific or general molecular functions as they may relate to neuromuscular biology in SBMA. The listed molecular functions or localization of proteins is not meant to rigidly define these proteins but, rather, to link the constellation of potential mechanisms that may contribute to SBMA pathophysiology.

References

    1. Kennedy WR, et al. Progressive proximal spinal and bulbar muscular atrophy of late onset. A sex-linked recessive trait. Neurology. 1968;18(7):671–680. doi: 10.1212/WNL.18.7.671. - DOI - PubMed
    1. Grunseich C, Fischbeck KH. Molecular pathogenesis of spinal bulbar muscular atrophy (Kennedy’s disease) and avenues for treatment. Curr Opin Neurol. 2020;33(5):629–634. doi: 10.1097/WCO.0000000000000856. - DOI - PMC - PubMed
    1. Hashizume A, et al. Disease mechanism, biomarker and therapeutics for spinal and bulbar muscular atrophy (SBMA) J Neurol Neurosurg Psychiatry. 2020;91(10):1085–1091. doi: 10.1136/jnnp-2020-322949. - DOI - PubMed
    1. Sobue G, et al. X-linked recessive bulbospinal neuronopathy. A clinicopathological study. Brain. 1989;112( pt 1):209–232. doi: 10.1093/brain/112.1.209. - DOI - PubMed
    1. Spada ARL, et al. Androgen receptor gene mutations in X-linked spinal and bulbar muscular atrophy. Nature. 1991;352(6330):77–79. doi: 10.1038/352077a0. - DOI - PubMed