. 2024 May 21;9(13):e171830.
doi: 10.1172/jci.insight.171830.

IFN-λ uniquely promotes CD8 T cell immunity against SARS-CoV-2 relative to type I IFN

Affiliations

IFN-λ uniquely promotes CD8 T cell immunity against SARS-CoV-2 relative to type I IFN

Abigail D Solstad et al. JCI Insight. .

Abstract

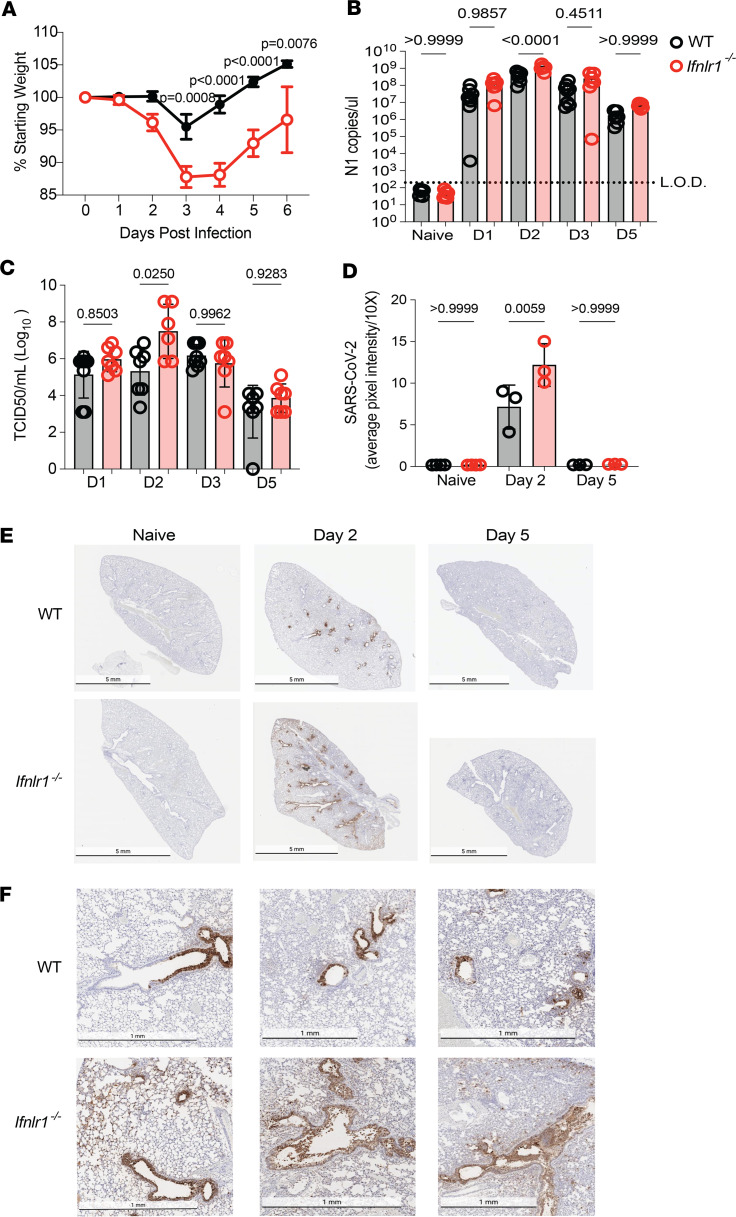
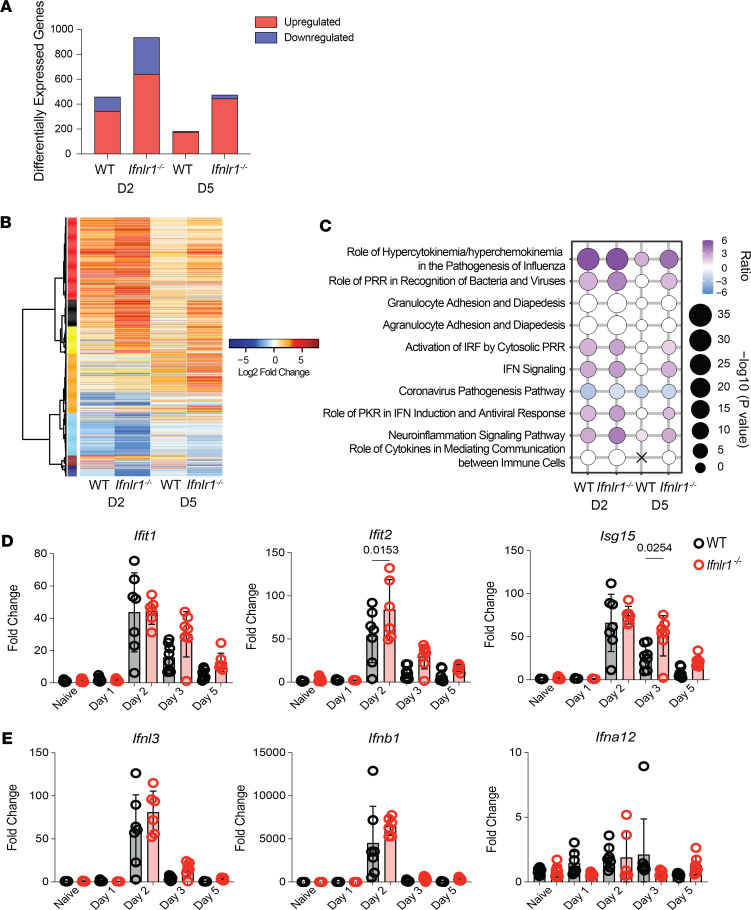
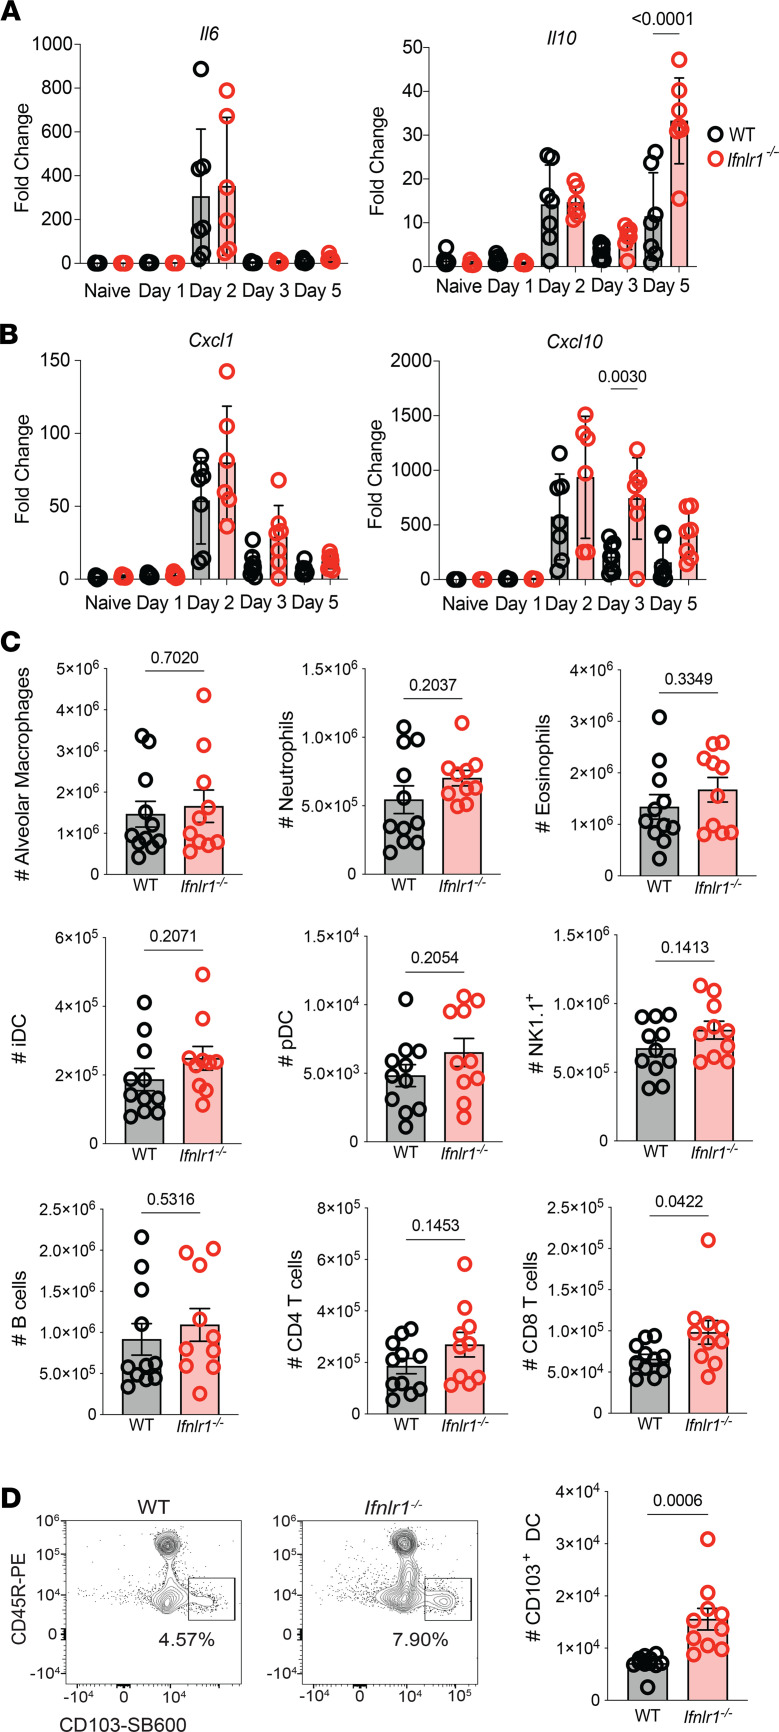
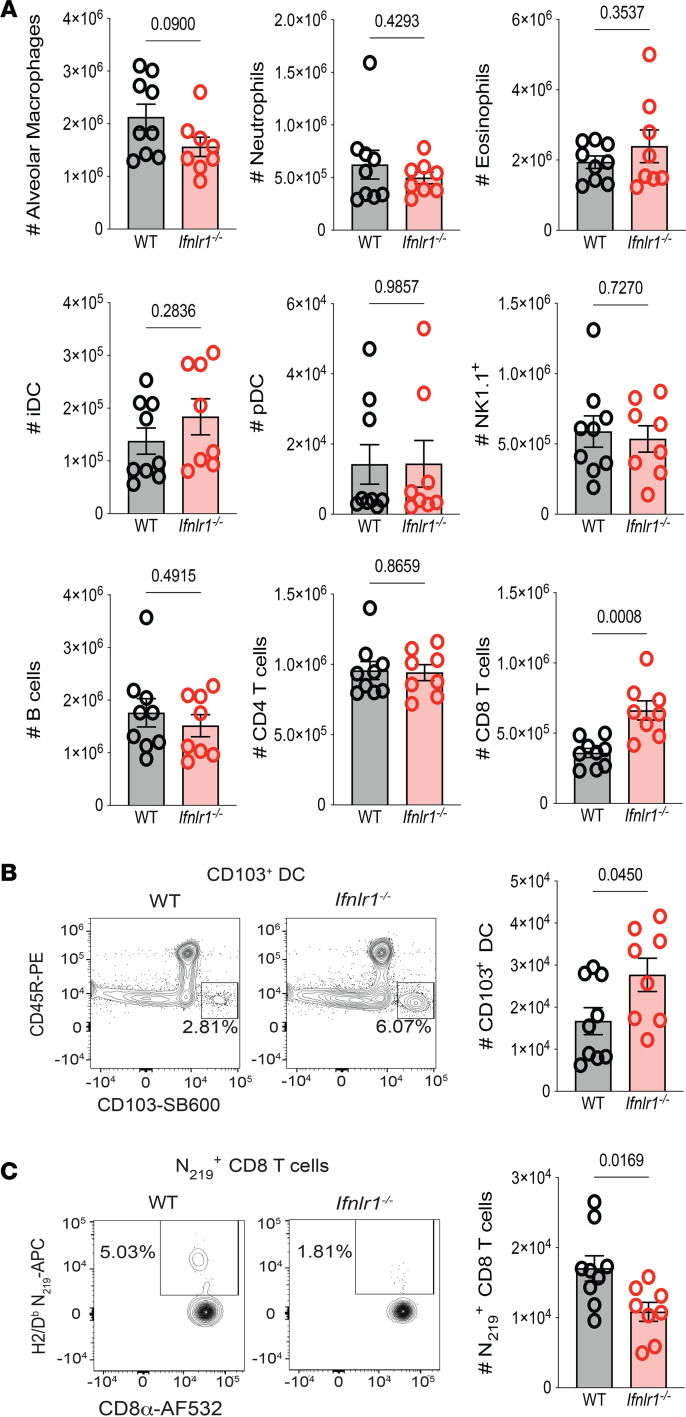
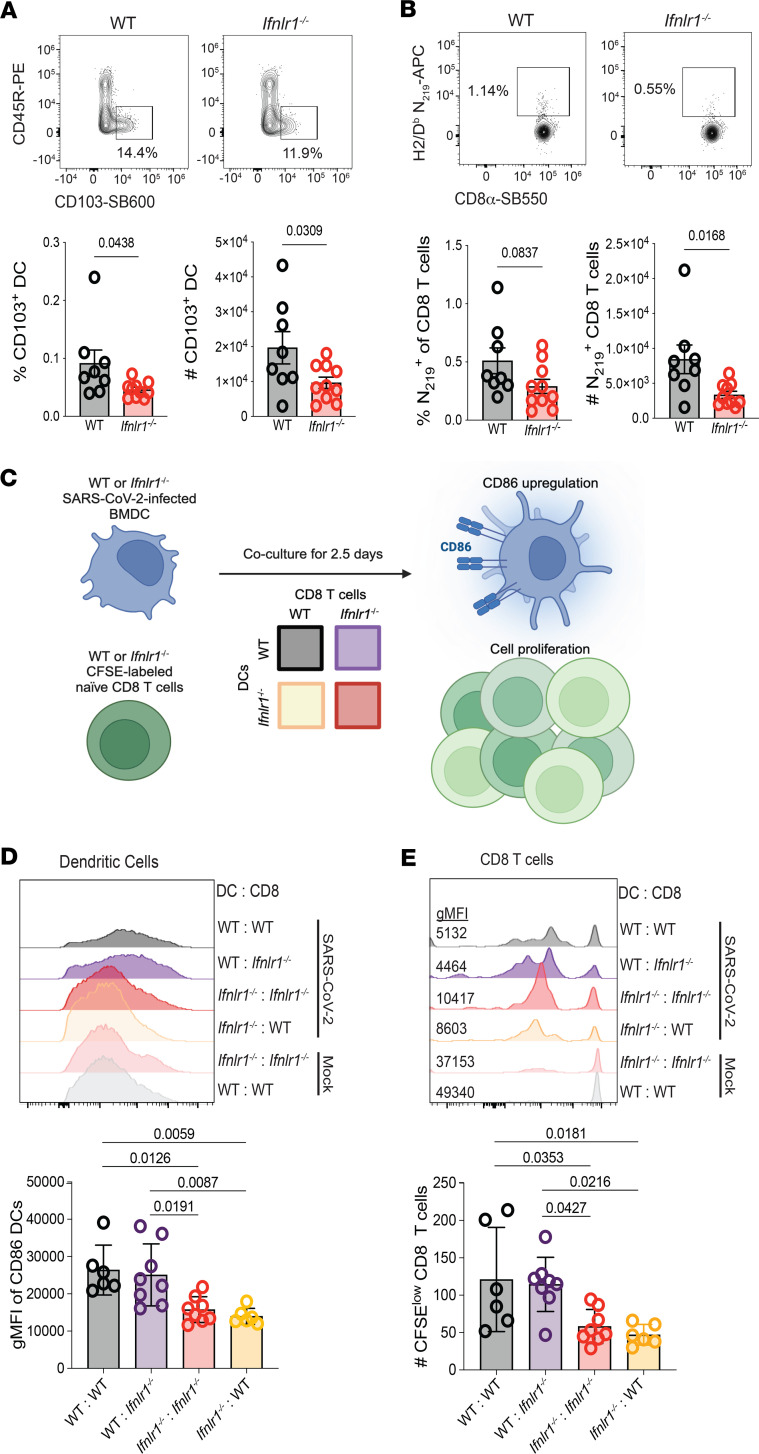
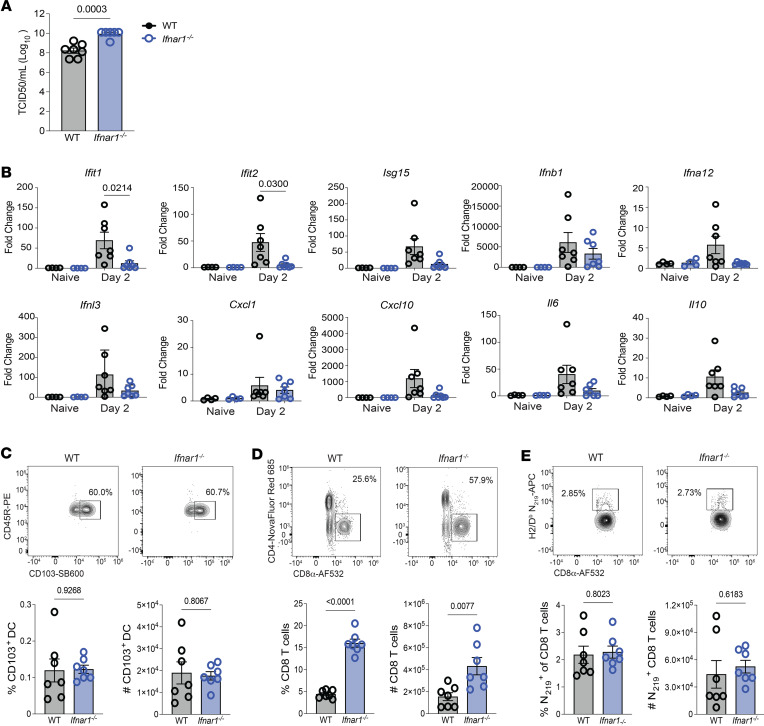
Optimization of protective immune responses against SARS-CoV-2 remains an urgent worldwide priority. In this regard, type III IFN (IFN-λ) restricts SARS-CoV-2 infection in vitro, and treatment with IFN-λ limits infection, inflammation, and pathogenesis in murine models. Furthermore, IFN-λ has been developed for clinical use to limit COVID-19 severity. However, whether endogenous IFN-λ signaling has an effect on SARS-CoV-2 antiviral immunity and long-term immune protection in vivo is unknown. In this study, we identified a requirement for IFN-λ signaling in promoting viral clearance and protective immune programming in SARS-CoV-2 infection of mice. Expression of both IFN and IFN-stimulated gene (ISG) in the lungs were minimally affected by the absence of IFN-λ signaling and correlated with transient increases in viral titers. We found that IFN-λ supported the generation of protective CD8 T cell responses against SARS-CoV-2 by facilitating accumulation of CD103+ DC in lung draining lymph nodes (dLN). IFN-λ signaling specifically in DCs promoted the upregulation of costimulatory molecules and the proliferation of CD8 T cells. Intriguingly, antigen-specific CD8 T cell immunity to SARS-CoV-2 was independent of type I IFN signaling, revealing a nonredundant function of IFN-λ. Overall, these studies demonstrate a critical role for IFN-λ in protective innate and adaptive immunity upon infection with SARS-CoV-2 and suggest that IFN-λ serves as an immune adjuvant to support CD8 T cell immunity.

Keywords: Immunology; Infectious disease; Innate immunity; Mouse models; T cells.


Conflict of interest statement

Conflict of interest: The authors have declared that no conflict of interest exists.

Figures

Figure 1
Figure 1. IFN-λ signaling restricts virus replication in a murine model of SARS-CoV-2 infection.
(A) WT and Ifnlr1–/– mice were infected intranasally with 1 × 10⁵ TCID50 of SARS-CoV-2 MA10, and weight loss was monitored for 6 days. A 2-way ANOVA with Šidák’s multiple-comparison test determined significance. Data from 2 independent experiments pooled with data representing mean ± SEM. n = 10 mice/group. (B) At days 1, 2, 3, and 5 p.i., RNA was isolated from lungs of naive or infected mice. RNA was subjected to qPCR to determine N1 copies per μl. Data from 2 independent experiments pooled with data representing mean ± SEM. n = 6-8 mice/group. (C) Lungs were harvested from naive and infected mice at days 1, 2, 3, and 5 p.i., and virus was quantified by TCID50. Data from 2 independent experiments pooled with data representing mean ± SEM. n = 6–8 mice/group. Statistical significance in B and C was determined by 1-way ANOVA with Tukey’s multiple-comparison test. (D) ImageJ was utilized to quantify the average pixel intensity of 10 randomly selected 10× images from each lung. Significance was determined by 1-way ANOVA with Tukey’s multiple-comparison test, n = 3 mice/group with data representing mean ± SD. (E) IHC was performed to detect the SARS-CoV-2 nucleocapsid (N). Scale bar: 5 mm. (F) Representative images of SARS-CoV-2 N staining from individual animals on day 2 p.i. Scale bar: 1 mm.
Figure 2
Figure 2. IFN-λ signaling regulates pulmonary transcriptional programming during SARS-CoV-2 MA10 infection.
RNA-Seq was performed on whole lungs of WT and Ifnlr1–/– naive mice or on days 2 and 5 following SARS-CoV-2 infection. (A) Quantification of differentially expressed genes (DEG) across WT or Ifnlr1–/– on days 2 and 5 following infection. Bar graphs represent total number of genes upregulated (red) or downregulated (blue) at the indicated time points. (B) Hierarchical clustering of the union of significantly up- or downregulated genes in WT or Ifnlr1–/– on days 2 and 5 following infection relative to naive. Heatmap represents the log2 fold change expression of 1277 DEG. Biweight midcorrelation was used to cluster transcripts in coexpression modules indicated by colors. (C) Enrichment of IPA canonical pathways from gene signatures derived from WT or Ifnlr1–/– mice during SARS-CoV-2 MA10 infection. Bubble plot represents the top 10 significantly enriched canonical pathways across day 2 and day 5 p.i. Bubble size indicates the -log10 P value of enrichment. Color indicates the inferred pathway activation Z score. Color indicates directionality of activation (purple) or repression (blue). White bubbles indicate significant pathways with no inferred activation state. (D and E) WT and Ifnlr1–/– mice were infected intranasally with 1 × 10⁵ TCID50 of SARS-CoV-2 MA10, and RNA was isolated from lungs of naive or infected mice on days 1, 2, 3, and 5 p.i. (D) Relative expression of Ifit1, Ifit2, and Isg15 compared with the housekeeping gene Chmp2a was determined by qPCR. (E) Relative expression of Ifnl3, Ifnb1, and Ifna12 compared with the housekeeping gene Chmp2a was determined by qPCR. Statistical significance was calculated by 1-way ANOVA followed by Tukey’s multiple-comparison test. Two independent experiments pooled with data representing mean ± SEM. n = 6–11 mice/group.
Figure 3
Figure 3. IFN-λ signaling regulates CD103+ DC populations in the lungs.
(A and B) WT and Ifnlr1–/– mice were infected intranasally with 1 × 10⁵ TCID50 of SARS-CoV-2 MA10, and RNA was isolated from lungs of naive or infected mice on days 1, 2, 3, and 5 p.i. Relative expression of Il6 and Il10 (A), as well as Cxcl1 and Cxcl10 (B), compared with the housekeeping gene Chmp2a was determined by qPCR. Statistical significance was calculated by 1-way ANOVA followed by Tukey’s multiple-comparison test. Two independent experiments pooled with data representing mean ± SEM. n = 6–11 mice/group. (C and D) WT and Ifnlr1–/– mice were infected intranasally with 1 × 10⁵ TCID50 of SARS-CoV-2 MA10. On day 4 p.i., lungs were harvested and numbers of specific immune cell (CD45+) populations were determined by flow cytometry. (C) Total numbers of alveolar macrophages, neutrophils, eosinophils, CD11c+CD11b+MHCII+ cells (iDC), pDCs, NK cells (NK1.1+), B cells, CD4 T cells, and CD8 T cells in the lungs was and N219-specific CD8 T cells were determined by flow cytometry. (D) Representative flow plots displaying the frequency and graphs quantifying numbers of WT and Ifnlr1–/– mice at day 4 following SARS-CoV-2 MA10 infection. Data from 2 independent experiments pooled with data representing mean ± SEM. n = 10–11 mice/group. Statistical significance was determined by unpaired 2-tailed t test. Frequencies on representative flow plots represent the percentage of parent gate (directly upstream of gate named in figure) with gating strategy shown in Supplemental Figure 2.
Figure 4
Figure 4. IFN-λ signaling is required for the generation of SARS-CoV-2–specific CD8 T cells in the lung following infection.
WT and Ifnlr1–/– mice were infected intranasally with 1 × 10⁵ TCID50 of SARS-CoV-2 MA10. On day 8 p.i., lungs were harvested and numbers of specific immune cell (CD45+) populations were determined by flow cytometry. (A) Total numbers of alveolar macrophages, neutrophils, eosinophils, CD11c+CD11b+MHCII+ cells (iDC), pDCs, NK cells (NK1.1+), B cells, CD4 T cells, and CD8 T cells in the lungs were determined by flow cytometry. (B) Representative flow plots displaying the frequency and graphs quantifying numbers of CD103+ DCs of WT and Ifnlr1–/– mice at day 8 following SARS-CoV-2 MA10 infection. (C) Representative flow plots displaying the frequency and graphs quantifying numbers of WT and Ifnlr1–/– mice at day 8 following SARS-CoV-2 MA10 infection. Data from 2 independent experiments pooled with data representing mean ± SEM. n = 8–9 mice/group. Statistical significance was determined by unpaired t test. Frequencies on representative flow plots represent the percentage of parent gate (directly upstream of gate named in figure) with gating strategy shown in Supplemental Figure 2.
Figure 5
Figure 5. IFN-λ signaling in DC is necessary for CD103+ DC and N219+ CD8 T cell responses in dLN and CD8 T cell proliferation during SARS-CoV-2 MA10 infection.
WT and Ifnlr1–/– mice were administered 1 × 10⁴ TCID50 of SARS-CoV-2 MA10 and, on day 4 p.i., dLN were harvested. (A and B) The number and frequency of CD103+ DCs (A) and N219-specific CD8 T cells (B) were assessed by flow cytometry. Data from 2 independent experiments pooled with data representing mean ± SEM. n = 8–11 mice/group. Statistical significance was determined by unpaired t test. Frequencies on representative flow plots represent the percentage of parent gate (directly upstream of gate named in figure). (C) BMDC generated from WT and Ifnlr1–/– mice were infected with SARS-CoV-2 and cocultured for 2.5 days with WT or Ifnlr1–/– CFSE-labeled CD8 T cells purified from spleens of mice. (D and E) After 2.5 days, CD86 expression on BMDC (D) and CD8 T cell proliferation as measured by CFSE dilution (E) was quantified by flow cytometry. Statistical significance was calculated by 1-way ANOVA followed by Tukey’s multiple-comparison test. Data from 2 individual experiments pooled with data representing mean ± SEM. n = 6–8 mice/group with each data point representing BMDC harvested from an individual mouse.
Figure 6
Figure 6. Type I IFN signaling does not affect the generation of SARS-CoV-2 N219-specific CD8 T cells in the lungs SARS-CoV-2 MA10 infection.
WT and Ifnar1–/– mice were infected intranasally with 1 × 10⁵ TCID50 of SARS-CoV-2 MA10. (A) At day 2 p.i., lungs were harvested to quantify virus via TCID50. Two independent experiments pooled with data representing mean ± SEM. n = 6–7 mice/group. Statistical significance was determined by unpaired t test. (B) At day 2 p.i., lungs were harvested. Relative expression of Ifit1, Ifit2, Isg15, Ifnb1, Ifna12, Ifnl3, Cxcl1, Cxcl10, Il6, and Il10 compared with the housekeeping gene Chmp2a was determined by qPCR. Statistical significance was calculated by 1-way ANOVA followed by Tukey’s multiple-comparison test. Two independent experiments pooled with data representing mean ± SEM. n = 4–7 mice/group. (CE) At day 8 p.i., lungs were harvested and the frequency and number of CD103+ DCs (C), the frequency and number of CD8 T cells (D), and the frequency and number of SARS-CoV-2 N219-specific CD8 T cells (E) were determined by flow cytometry. Data from 2 independent experiments pooled with data representing mean ± SEM. n = 7 mice/group. Statistical significance was determined by unpaired t test. Frequencies on representative flow plots are percentage of parent gate (directly upstream of gate named in figure).

Similar articles

Cited by

References

    1. Yuan M, et al. Structural and functional ramifications of antigenic drift in recent SARS-CoV-2 variants. Science. 2021;373(6556):818–823. doi: 10.1126/science.abh1139. - DOI - PMC - PubMed
    1. VanBlargan LA, et al. An infectious SARS-CoV-2 B.1.1.529 Omicron virus escapes neutralization by therapeutic monoclonal antibodies. Nat Med. 2022;28(3):490–495. doi: 10.1038/s41591-021-01678-y. - DOI - PMC - PubMed
    1. Thorne LG, et al. Evolution of enhanced innate immune evasion by SARS-CoV-2. Nature. 2022;602(7897):487–495. doi: 10.1038/s41586-021-04352-y. - DOI - PMC - PubMed
    1. McCallum M, et al. Structural basis of SARS-CoV-2 Omicron immune evasion and receptor engagement. Science. 2022;375(6583):864–868. doi: 10.1126/science.abn8652. - DOI - PMC - PubMed
    1. Hemann EA, et al. Interferon lambda genetics and biology in regulation of viral control. Front Immunol. 2017;8:1707. doi: 10.3389/fimmu.2017.01707. - DOI - PMC - PubMed