Review
. 2025 Mar 5;17(9):13094-13110.
doi: 10.1021/acsami.4c03434. Epub 2024 Jul 8.

Near Infrared Biomimetic Hybrid Magnetic Nanocarrier for MRI-Guided Thermal Therapy

Affiliations
Review

Near Infrared Biomimetic Hybrid Magnetic Nanocarrier for MRI-Guided Thermal Therapy

João Victor Ribeiro Rocha et al. ACS Appl Mater Interfaces. .

Abstract

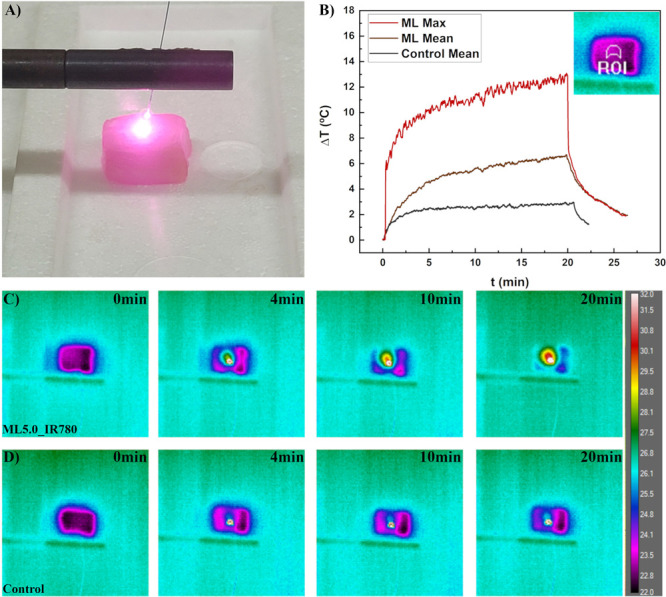
Cell-membrane hybrid nanoparticles (NPs) are designed to improve drug delivery, thermal therapy, and immunotherapy for several diseases. Here, we report the development of distinct biomimetic magnetic nanocarriers containing magnetic nanoparticles encapsulated in vesicles and IR780 near-infrared dyes incorporated in the membranes. Distinct cell membranes are investigated, red blood cell (RBC), melanoma (B16F10), and glioblastoma (GL261). Hybrid nanocarriers containing synthetic lipids and a cell membrane are designed. The biomedical applications of several systems are compared. The inorganic nanoparticle consisted of Mn-ferrite nanoparticles with a core diameter of 15 ± 4 nm. TEM images show many multicore nanostructures (∼40 nm), which correlate with the hydrodynamic size. Ultrahigh transverse relaxivity values are reported for the magnetic NPs, 746 mM-1s-1, decreasing respectively to 445 mM-1s-1 and 278 mM-1s-1 for the B16F10 and GL261 hybrid vesicles. The ratio of relaxivities r2/r1 decreased with the higher encapsulation of NPs and increased for the biomimetic liposomes. Therapeutic temperatures are achieved by both, magnetic nanoparticle hyperthermia and photothermal therapy. Photothermal conversion efficiency ∼25-30% are reported. Cell culture revealed lower wrapping times for the biomimetic vesicles. In vivo experiments with distinct routes of nanoparticle administration were investigated. Intratumoral injection proved the nanoparticle-mediated PTT efficiency. MRI and near-infrared images showed that the nanoparticles accumulate in the tumor after intravenous or intraperitoneal administration. Both routes benefit from MRI-guided PTT and demonstrate the multimodal theranostic applications for cancer therapy.

Keywords: SPION; cancer; cell membrane nanoparticles; glioblastoma.; thermal nanomedicine.


Conflict of interest statement

The authors declare no competing financial interest.

Figures

Figure 1
Figure 1
Representative scheme of the steps for production of the biomimetic magnetofluorescent liposomes.
Figure 2
Figure 2
Cancer theranostic applications of hybrid magnetofluorescent liposomes. FMT - Fluorescence molecular tomography, MRI - Magnetic resonance imaging, PTT - Photothermal therapy, MNH - Magnetic nanoparticle hyperthermia.
Figure 3
Figure 3
(A) Representative TEM images of the Mn-ferrite NPs. (B) SAED. (C) TEM Mn-ferrite size distribution. The inset shows the XRD of the NPs. (D) TEM image of ML1.0. (E) TEM image of ML2.5. (F) TEM image of ML5.0. The insets of Figures D-F show isolated MLs evaluated using ImageJ for area determination. (G) High resolution TEM image of isolated ML showing the encapsulation of NPs. The inset shows the EDS data of this ML. (H) Fraction of vesicles containing NPs and area occupied by NPs encapsulated in the vesicles for samples ML1.0, ML2.5, and ML5.0. (I) Specific magnetization curve of the Mn-ferrite NPs and of their colloidal suspension. (J) Specific magnetization curves of the magneto vesicles. (K) ESR spectra of Mn-ferrite colloidal suspension at different concentrations (left) and MLs samples at fixed NP concentration (right). (L) ESR line width concentration dependence of the Mn-ferrite magnetic fluid. (M) MLs mean size and polydispersity obtained by DLS. (N) MLs zeta potential profile. (O) SDS-PAGE of representative hybrid liposomes: 1 molecular weight markers; 2 melanoma (B16F10); 3 glioblastoma (GL261) and 4 red blood cells (RBC) cell-derived liposomes protein profile indicating the cell-membrane fragments retention by each hybrid vesicle.
Figure 4
Figure 4
(A) MRI inversion recovery (IR) data for the T1 determination of sample ML_GL261. The inset shows the relaxivity concentration dependence. (B) Representative TI images for NP and synthetic ML samples with [Fe] + [Mn] = 0.12 mM. (C) r1 for all samples. (D) MRI spin echo (SE) data for the T2 determination of sample ML_GL261. The inset shows the relaxivity concentration dependence. (E) Representative T2 images for hybrid ML samples with spin echo time TE = 15 ms. (F) r2 for all samples. (G) Representative TI images for all hybrid samples at [Fe] + [Mn] = 0.12 mM. (H) r2/r1 values for all samples.
Figure 5
Figure 5
Immunofluorescence images acquired using a CellInsight CX7 LZR Pro (ThermoFisher). Cell membranes were labeled with Wheat Germ Agglutinin – Alexa Fluor 488 (green) and the nuclei with Hoechst 33342 (blue). The red fluorescence was used for the identification of GL261-mCherry fragments autofluorescence or for formulations labeled with IR780. GL261-eGFP autofluorescence was also identified by green. (A) and (B) Glioblastoma GL261-eGFP and GL261-mCherry cell lines, respectively. (C) B16F10 melanoma cells. (D) macrophage J774A.1 cells. (E) and (F) merged images showing MLs-GL261-mCherry upatake by GBL and macrophages cells, respectively. (G) and (H) merged images showing the uptake of MLs hybridized with B16F10 membranes by melanoma and macrophages cells, respectively. (I)-(K) Cellular uptake of nanocarriers by GL261, B16F10 and J774A.1 cells, respectively, evaluated by flow cytometry. (L)-(N) Thermal bath cell viability study. Cell viability was calculated in relation to control samples incubated at 37 °C with 5% CO2.
Figure 6
Figure 6
(A) MNH temperature profile during MNH, at 323 kHz and 86 Oe. (B) MNH frequency study at 71 Oe and distinct AC field frequencies. Symbols represent data, while lines are the fit using the LRT model. (C) MNH efficiency, SLP, for distinct samples, at 323 kHz and 86 Oe. (D) PTT temperature profile for distinct samples. (E) Absorbance curve of the samples. (F) Photothermal conversion efficiency (PCE) values of the samples. (G) Relaxivity hydrodynamic size dependence. (H) SLP hydrodynamic size dependence. (I) PCE hydrodynamic size dependence.
Figure 7
Figure 7
(A) Pork loin dimensions used in the ex vivo experiment. ML containing IR780 dyes in the membrane is injected 5 mm below the surface. (B) Image of the position of the pork loin in the MRI RF coil. (C) T1W MRI image before ML injection. (D) T1W MRI image after ML administration. (E) FMT image of the near-infrared ML inside the pork loin. (F) MRI-FMT merged image.
Figure 8
Figure 8
(A) Image of the PTT experiment in the pork loin containing MLs with IR780 incorporated in the membrane, sample ML5.0_IR780. (B) Mean temperature profiles considering the same ROI for samples without MLs (control) and with ML5.0_IR780 mean and maximum temperature profiles. Thermal camera snapshot images at distinct PTT times for (C) ML5.0_IR780, and (D) control.
Figure 9
Figure 9
(A) T1W MRI images of the control animal at distinct times (0, 6, and 24 h). (B) T1W MRI images of an animal that received intravenous (I.V.) administration of MLB16_IR780 at distinct times (0, 6, and 24 h). The image of the I.V. animal at 24h corresponds to a post PTT procedure. (C) FMT images of both animals, 24h after I.V. administration, before PTT. (D) Thermal images of animal I.V., 11 days after tumor inoculation, considering distinct times of PTT. (E) Mean temperature profile during PTT for a ROI located on the tumor. (F) Tumor growth of both control and I.V. animals. The arrow indicates the day of PTT. The inset shows FMT images of both animals’ tumors, 19 days after innoculation. (G) FMT images showing the biodistribution of MLB16_IR780, 19 days after tumor innoculation (8 days after PTT).

Similar articles

Cited by

References

    1. Fang R. H.; Gao W.; Zhang L. Targeting Drugs to Tumours Using Cell Membrane-Coated Nanoparticles. Nature Reviews Clinical Oncology 2023, 20, 33–48. 10.1038/s41571-022-00699-x. - DOI - PubMed
    1. Strauss W. E.; Dahl N. V.; Li Z.; Lau G.; Allen L. F. Ferumoxytol Versus Iron Sucrose Treatment: A Post-hoc Analysis of Randomized Controlled Trials in Patients with Varying Renal Function and Iron Deficiency Anemia. BMC Hematology 2016, 16, 20.10.1186/s12878-016-0060-x. - DOI - PMC - PubMed
    1. Zhou Z.; Yang L.; Gao J.; Chen X. Structure–Relaxivity Relationships of Magnetic Nanoparticles for Magnetic Resonance Imaging. Adv. Mater. 2019, 31, e180456710.1002/adma.201804567. - DOI - PMC - PubMed
    1. Healy S.; Bakuzis A. F.; Goodwill P. W.; Attaluri A.; Bulte J. W.; Ivkov R. Clinical Magnetic Hyperthermia Requires Integrated Magnetic Particle Imaging. WIREs Nanomedicine and Nanobiotechnology 2022, 14, 1779.10.1002/wnan.1779. - DOI - PMC - PubMed
    1. Soares G.; Pinto L.; Liebl M.; Biasotti G.; Prospero A.; Stoppa E.; Bakuzis A.; Baffa O.; Wiekhorst F.; Miranda J. R. A. Quantitative Imaging of Magnetic Nanoparticles in an Unshielded Environment Using a large AC Susceptibility Array. Journal of Biological Engineering 2022, 16, 25.10.1186/s13036-022-00305-9. - DOI - PMC - PubMed