The health implications of cumulative exposure to contextual (dis)advantage: methodological and substantive advances from a unique data linkage
- PMID: 38973742
- PMCID: PMC11815491
- DOI: 10.1093/aje/kwae183
The health implications of cumulative exposure to contextual (dis)advantage: methodological and substantive advances from a unique data linkage
Abstract
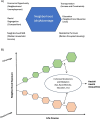
Deleterious neighborhood conditions are associated with poor health, yet the health impact of cumulative lifetime exposure to neighborhood disadvantage is understudied. Using up to 5 decades of residential histories for 4177 adult participants in the Survey of the Health of Wisconsin (SHOW) and spatiotemporally linked neighborhood conditions, we developed 4 operational approaches to characterizing cumulative neighborhood (dis)advantage over the life course. We estimated their associations with self-reported general health and compared them with estimates using neighborhood (dis)advantage at the time of study enrollment. When cumulative exposures were assessed with the most granular temporal scale (approach 4), neighborhood transportation constraints (odds ratio [OR] = 1.21; 95% CI, 1.08-1.36), residential turnover (OR = 1.20; 95% CI, 1.07-1.34), education deficit (OR = 1.17; 95% CI, 1.04-1.32), racial segregation (OR = 1.20; 95% CI, 1.04-1.38), and median household income (OR = 0.85; 95% CI, 0.75-0.97) were significantly associated with risk of fair or poor health. For composite neighborhood disadvantage, cumulative exposures had a stronger association (OR = 1.05; 95% CI, 1.02-1.08) than the cross-sectional exposure (OR = 1.03; 95% CI, 1.01-1.06). Single-point-in-time neighborhood measures underestimate the relationship between neighborhood and health, underscoring the importance of a life-course approach to cumulative exposure measurement.
Keywords: health; life course; neighborhoods; residential history.
© The Author(s) 2024. Published by Oxford University Press on behalf of the Johns Hopkins Bloomberg School of Public Health.
Conflict of interest statement
The authors declare no conflicts of interest.
Figures


Similar articles
-
Linking sequences of exposure to residential (dis)advantage, individual socioeconomic status, and health.Health Place. 2024 Jul;88:103262. doi: 10.1016/j.healthplace.2024.103262. Epub 2024 Jun 3. Health Place. 2024. PMID: 38833849 Free PMC article.
-
Perceived neighborhood disadvantage and poor chronic health in Israel.Isr J Health Policy Res. 2025 May 27;14(1):30. doi: 10.1186/s13584-025-00695-3. Isr J Health Policy Res. 2025. PMID: 40426224 Free PMC article.
-
The health implications of neighborhood networks based on daily mobility in US cities.Soc Sci Med. 2024 Aug;354:117058. doi: 10.1016/j.socscimed.2024.117058. Epub 2024 Jun 24. Soc Sci Med. 2024. PMID: 38943778
-
Beyond the residential neighborhood: A scoping review of research on urban neighborhood networks.Soc Sci Med. 2025 May;372:117945. doi: 10.1016/j.socscimed.2025.117945. Epub 2025 Mar 13. Soc Sci Med. 2025. PMID: 40101666
-
Neighborhood Disadvantage, Residential Segregation, and Beyond-Lessons for Studying Structural Racism and Health.J Racial Ethn Health Disparities. 2018 Apr;5(2):357-365. doi: 10.1007/s40615-017-0378-5. Epub 2017 Jun 1. J Racial Ethn Health Disparities. 2018. PMID: 28573643 Review.
Cited by
-
Cumulative neighborhood disadvantage and racial and geographic disparities in epigenetic aging.SSM Popul Health. 2025 Jun 10;31:101825. doi: 10.1016/j.ssmph.2025.101825. eCollection 2025 Sep. SSM Popul Health. 2025. PMID: 40584435 Free PMC article.
-
Xu et al respond to "Invited commentary: improving spatial exposure data for everyone-life-course social context and ascertaining residential history".Am J Epidemiol. 2025 Mar 4;194(3):578-579. doi: 10.1093/aje/kwae243. Am J Epidemiol. 2025. PMID: 39270678 No abstract available.
-
Linking sequences of exposure to residential (dis)advantage, individual socioeconomic status, and health.Health Place. 2024 Jul;88:103262. doi: 10.1016/j.healthplace.2024.103262. Epub 2024 Jun 3. Health Place. 2024. PMID: 38833849 Free PMC article.
References
MeSH terms
Grants and funding
LinkOut - more resources
Full Text Sources
Medical

