. 2024 Jun 30;13(6):1277-1295.
doi: 10.21037/tlcr-24-309. Epub 2024 Jun 7.

Bioinformatics analysis of an immunotherapy responsiveness-related gene signature in predicting lung adenocarcinoma prognosis

Affiliations

Bioinformatics analysis of an immunotherapy responsiveness-related gene signature in predicting lung adenocarcinoma prognosis

Yupeng Jiang et al. Transl Lung Cancer Res. .

Abstract

Background: Immune therapy has become first-line treatment option for patients with lung cancer, but some patients respond poorly to immune therapy, especially among patients with lung adenocarcinoma (LUAD). Novel tools are needed to screen potential responders to immune therapy in LUAD patients, to better predict the prognosis and guide clinical decision-making. Although many efforts have been made to predict the responsiveness of LUAD patients, the results were limited. During the era of immunotherapy, this study attempts to construct a novel prognostic model for LUAD by utilizing differentially expressed genes (DEGs) among patients with differential immune therapy responses.

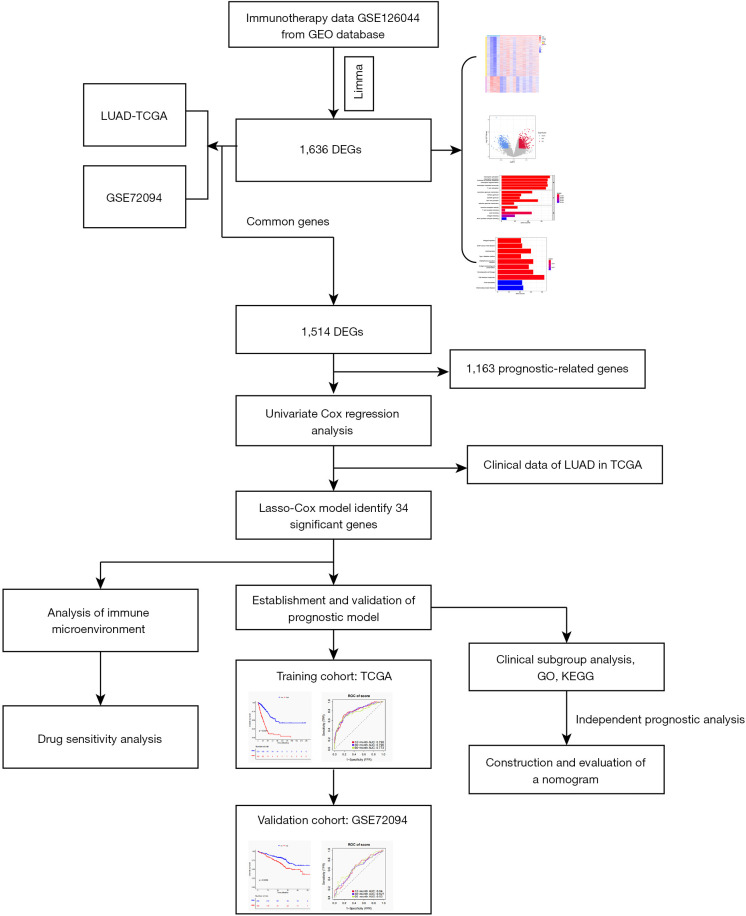
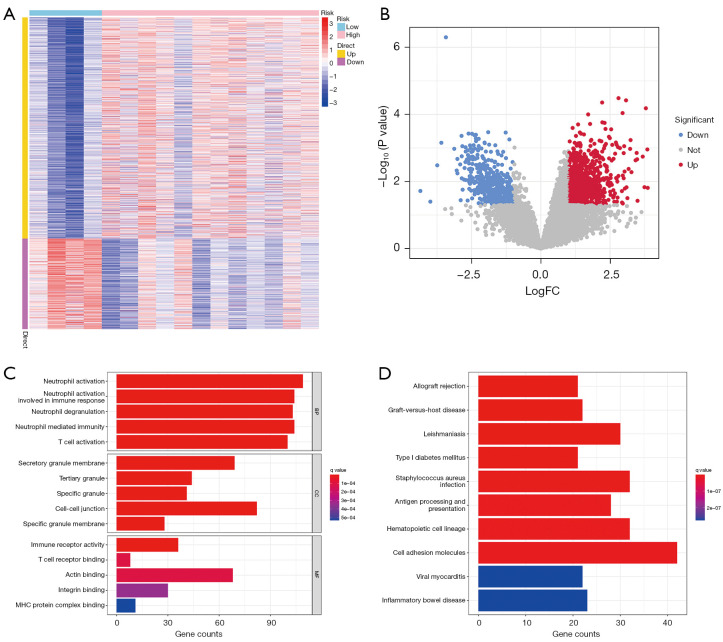
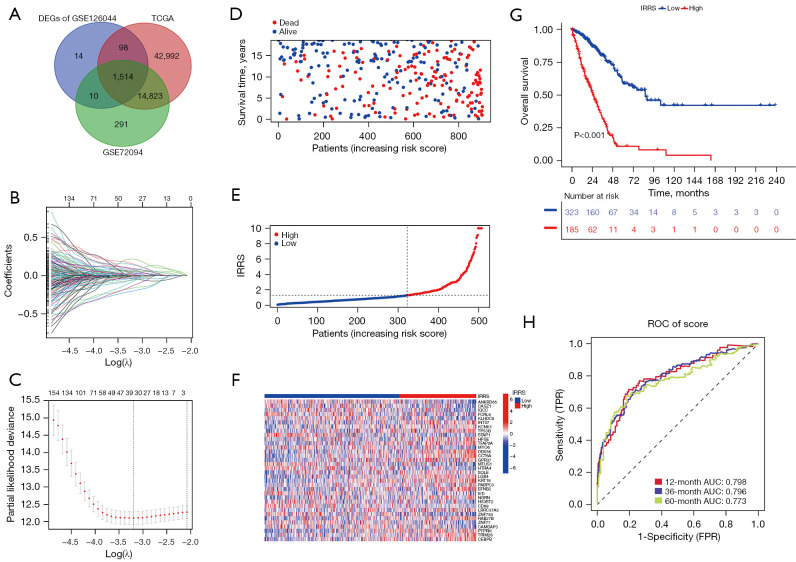
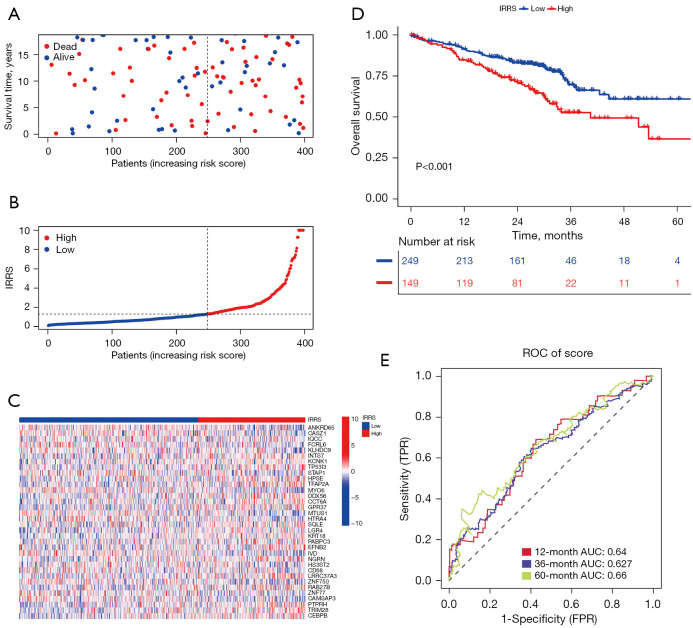
Methods: Transcriptome data of 598 patients with LUAD were downloaded from The Cancer Genome Atlas (TCGA) database, which included 539 tumor samples and 59 normal control samples, with a mean follow-up time of 29.69 months (63.1% of patients remained alive by the end of follow-up). Other data sources including three datasets from the Gene Expression Omnibus (GEO) database were analyzed, and the DEGs between immunotherapy responders and nonresponders were identified and screened. Univariate Cox regression analysis was applied with the TCGA cohort as the training set and GSE72094 cohort as the validation set, and least absolute shrinkage and selection operator (LASSO) Cox regression were applied in the prognostic-related genes which fulfilled the filter criteria to establish a prognostic formula, which was then tested with time-dependent receiver operating characteristic (ROC) analysis. Enriched pathways of the prognostic-related genes were analyzed with Gene Ontology (GO) and Kyoto Encyclopedia of Genes and Genomes (KEGG) enrichment analyses, and tumor immune microenvironment (TIME), tumor mutational burden, and drug sensitivity tests were completed with appropriate packages in R (The R Foundation of Statistical Computing). Finally, a nomogram incorporating the prognostic formula was established.

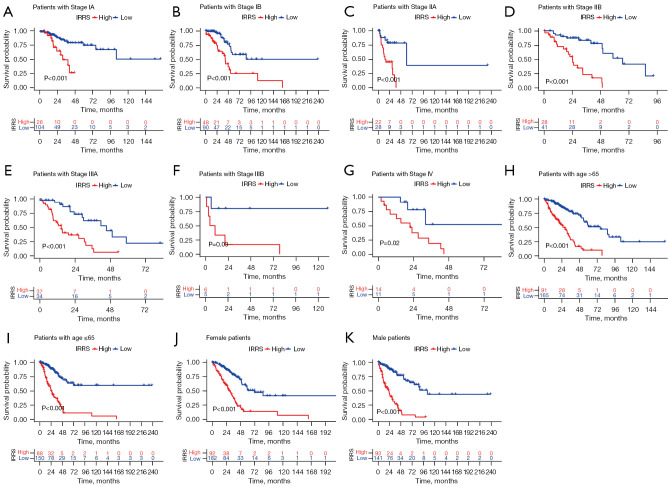
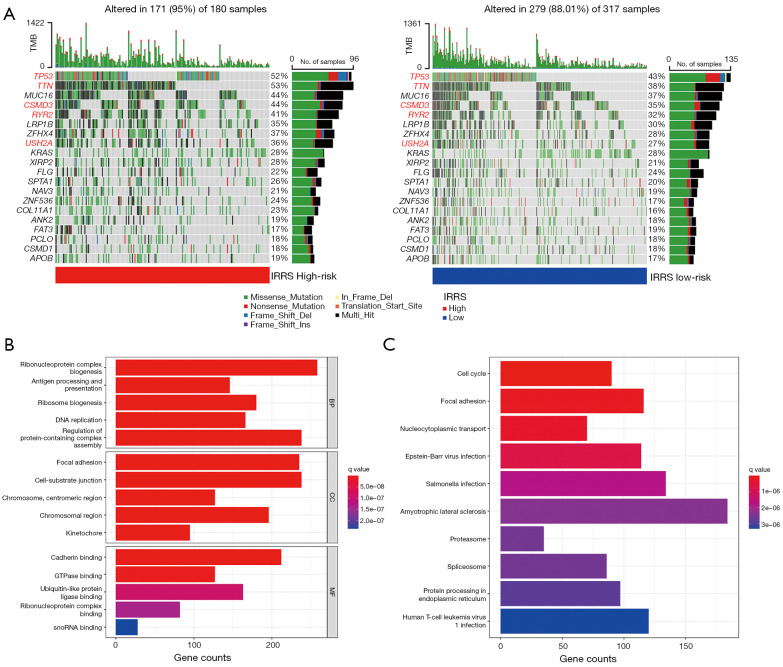
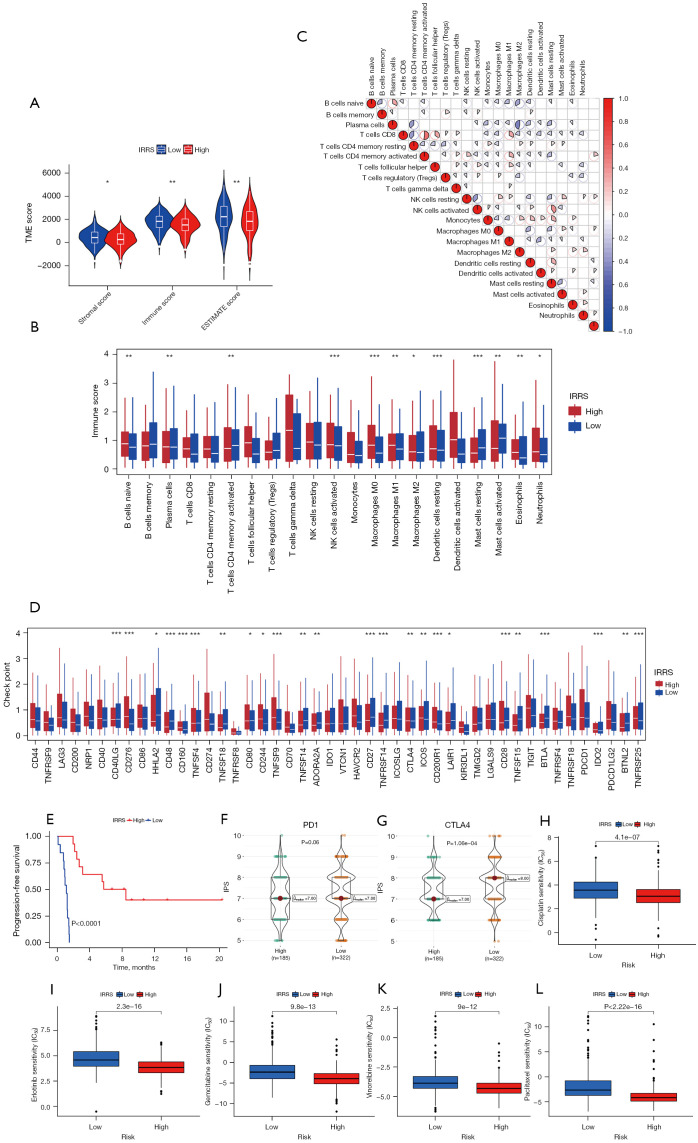
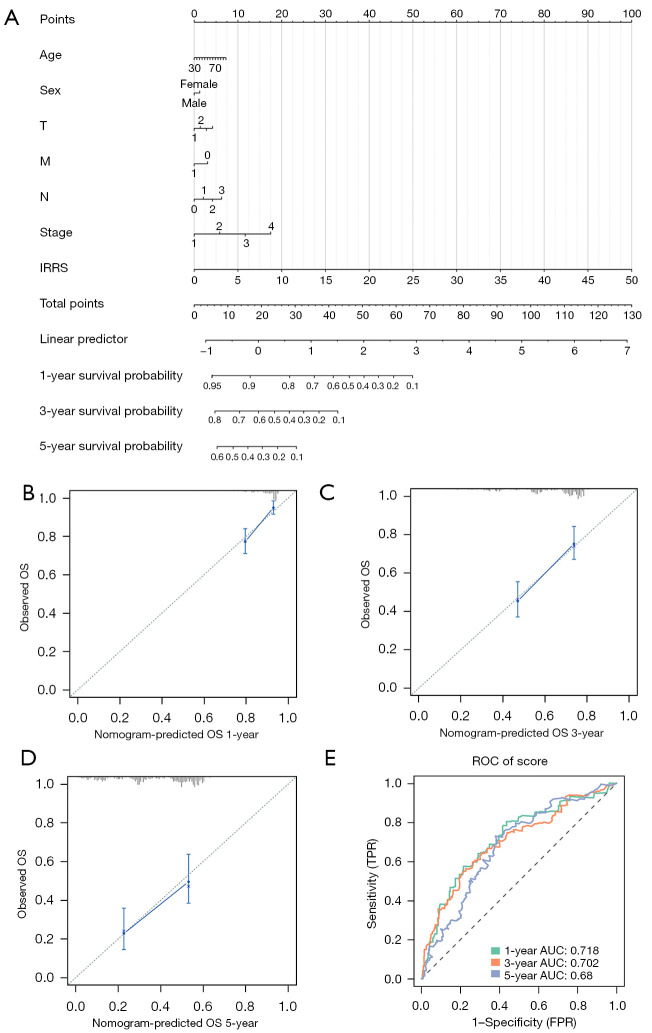
Results: A total of 1,636 DEGs were identified, 1,163 prognostic-related DEGs were extracted, and 34 DEGs were selected and incorporated into the immunotherapy responsiveness-related risk score (IRRS) formula. The IRRS formula had good performance in predicting the overall prognoses in patients with LUAD and had excellent performance in prognosis prediction in all LUAD subgroups. Moreover, the IRRS formula could predict anticancer drug sensitivity and immunotherapy responsiveness in patients with LUAD. Mechanistically, immune microenvironments varied profoundly between the two IRRS groups; the most significantly varied pathway between the high-IRRS and low-IRRS groups was ribonucleoprotein complex biogenesis, which correlated closely with the TP53 and TTN mutation burdens. In addition, we established a nomogram incorporating the IRRS, age, sex, clinical stage, T-stage, N-stage, and M-stage as predictors that could predict the prognoses of 1-year, 3-year, and 5-year survival in patients with LUAD, with an area under curve (AUC) of 0.718, 0.702, and 0.68, respectively.

Conclusions: The model we established in the present study could predict the prognosis of LUAD patients, help to identify patients with good responses to anticancer drugs and immunotherapy, and serve as a valuable tool to guide clinical decision-making.

Keywords: Lung adenocarcinoma (LUAD); anticancer drug sensitivity; immunotherapy responsiveness; nomogram; prognosis.


Conflict of interest statement

Conflicts of Interest: All authors have completed the ICMJE uniform disclosure form (available at https://tlcr.amegroups.com/article/view/10.21037/tlcr-24-309/coif). The authors have no conflicts of interest to declare.

Figures

Figure 1
Figure 1
Design and flowchart of the study. GEO, Gene Expression Omnibus; LUAD, lung adenocarcinoma; TCGA, The Cancer Genome Atlas; DEG, differentially expressed genes; GO, Gene Ontology; KEGG, Kyoto Encyclopedia of Genes.
Figure 2
Figure 2
Screening and functional analysis of immunotherapy responsiveness-related DEGs. (A) Heatmap of differentially expressed immunotherapy responsiveness-related genes. (B) The volcano plot of DEGs with a cutoff at P<0.05 and |log2FC| >1. (C) GO enrichment of immunotherapy responsiveness-related DEGs. (D) KEGG pathway of immunotherapy responsiveness-related DEGs. DEG, differentially expressed gene; FC, fold change; GO, Gene Ontology; KEGG, Kyoto Encyclopedia of Genes and Genomes; MHC, major histocompatibility complex; BP, biological process; CC, cellular component; MF, molecular function.
Figure 3
Figure 3
Construction of the IRRS formula. (A) The Venn diagram displays the intersection of common genes among the three cohorts. (B) LASSO coefficient profile plots of prognostic-related genes showing that the variations in the size of the coefficients of parameters decrease with an increasing value of the k penalty. (C) Penalty plot for the LASSO regression analysis. (D) Distribution patterns of survival time and status in the high-IRRS group and low-IRRS group in the training set. (E) Distribution of IRRS in the training set. (F) Heatmap of the 34 prognostic-related genes for each patient in the training set. (G) Kaplan-Meier survival curve of patients in the high-IRRS group and low-IRRS group in the training set. (H) Time-related ROC analysis to evaluate the prognostic value of the IRRS in the training set. DEG, differentially expressed gene; IRRS, immunotherapy responsiveness-related risk score; LASSO, least absolute shrinkage and selection operator; ROC, receiver operating characteristic; AUC, area under the curve; TPR, true positive rate; FPR, false positive rate.
Figure 4
Figure 4
Validation of the stability of the IRRS formula. (A) Distribution patterns of survival time and status in the high-IRRS group and low-IRRS group in the validation set. (B) Distribution of IRRS in the validation set. (C) Heatmap of the 34 prognostic-related genes for each patient in the validation set. (D) Kaplan-Meier survival curve of patients in the high-IRRS group and low-IRRS group in the validation set. (E) Time-related ROC analysis for evaluating the prognostic value of the IRRS in the validation set. IRRS, immunotherapy responsiveness-related risk score; ROC, receiver operating characteristic; AUC, area under the curve; TPR, true positive rate; FPR, false positive rate.
Figure 5
Figure 5
Subgroup analyses with the IRRS formula. (A) Kaplan-Meier survival curve of patients in the high-IRRS group and low-IRRS group in patients with stage IA with LUAD. (B) Kaplan-Meier survival curve of patients in the high-IRRS group and low-IRRS group in patients with stage IB LUAD. (C) Kaplan-Meier survival curve of patients in the high-IRRS group and low-IRRS group in patients with stage IIA LUAD. (D) Kaplan-Meier survival curve of patients in the high-IRRS group and low-IRRS group in patients with stage IIB LUAD. (E) Kaplan-Meier survival curve of patients in the high-IRRS group and low-IRRS group in patients with stage IIIA LUAD. (F) Kaplan-Meier survival curve of patients in the high-IRRS group and low-IRRS group in patients with stage IIIB LUAD. (G) Kaplan-Meier survival curve of patients in the high-IRRS group and low-IRRS group in patients with stage IV LUAD. (H) Kaplan-Meier survival curve of patients with age >65 years in the high-IRRS group and low-IRRS group. (I) Kaplan-Meier survival curve of patients with stage IA LUAD and age ≤65 years in the high-IRRS group and low-IRRS group. (J) Kaplan-Meier survival curve of female patients in the high-IRRS group and low-IRRS group. (K) Kaplan-Meier survival curve of male patients in the high-IRRS group and low-IRRS group. IRRS, immunotherapy responsiveness-related risk score; LUAD, lung adenocarcinoma.
Figure 6
Figure 6
Mutation landscape and functional analysis of IRRS-related DEGs. (A) Mutation burdens of various oncogenes in the high-IRRS group and low-IRRS group. The genes with significant differences between the two groups were highlighted in red font. (B) GO enrichment analysis of DEGs between the high-IRRS and low-IRRS groups. (C) KEGG pathway enrichment of DEGs between the high-IRRS and low-IRRS groups. TMB, tumor mutation burden; IRRS, immunotherapy responsiveness-related risk score; DEG, differentially expressed genes; GO, Gene Ontology; KEGG, Kyoto Encyclopedia of Genes.
Figure 7
Figure 7
Immune status analysis and anticancer drug sensitivity analyses. (A) The relationships between IRRS, immune score, stromal score, and ESTIMATE score. (B) Infiltration of various types of immune cells in the high-IRRS group and low-IRRS group. (C) The correlations between IRRS and immune cells. (D) The expressions of immune checkpoints in the high-IRRS group and low-IRRS group. (E) Kaplan-Meier survival curve of patients in the high-IRRS group and low-IRRS group in the GSE135222 cohort. (F,G) IPS of the high-IRRS group and low-IRRS group. (H) The IC50 of cisplatin in the low-IRRS group and high-IRRS group. (I) The IC50 of erlotinib in the low-IRRS group and high-IRRS group. (J) The IC50 of gemcitabine in the low-IRRS group and high-IRRS group. (K) The IC50 of vinorelbine in the low-IRRS group and high-IRRS group. (L) The IC50 of paclitaxel in the low-IRRS group and high-IRRS group. *, P<0.05; **, P<0.01; ***, P<0.001. IRRS, immunotherapy responsiveness related risk score; IPS, immune cell proportion score; TME, tumor microenvironment; NK, natural killer cell; PD-1, programmed cell death protein 1; CTLA4, cytotoxic T-lymphocyte associated protein 4; IC50, half maximal inhibitory concentration.
Figure 8
Figure 8
Construction and validation of IRRS-related nomogram. (A) A nomogram incorporating parameters including age, sex, T stage, N stage, M stage, clinical stage, and the IRRS. (B) The calibration curves for 1-year OS prediction. (C) The calibration curves for 3-year OS prediction. (D) The calibration curves for 5-year OS prediction. (E) The ROC curve for the nomogram. IRRS, immunotherapy responsiveness related risk score; OS, overall survival; ROC, receiver operating characteristic curve; AUC, area under curve.

Similar articles

Cited by

References

    1. Chen P, Liu Y, Wen Y, et al. Non-small cell lung cancer in China. Cancer Commun (Lond) 2022;42:937-70. 10.1002/cac2.12359 - DOI - PMC - PubMed
    1. Maomao C, He L, Dianqin S, et al. Current cancer burden in China: epidemiology, etiology, and prevention. Cancer Biol Med 2022;19:1121-38. 10.20892/j.issn.2095-3941.2022.0231 - DOI - PMC - PubMed
    1. Ettinger DS, Wood DE, Aisner DL, et al. Non-Small Cell Lung Cancer, Version 3.2022, NCCN Clinical Practice Guidelines in Oncology. J Natl Compr Canc Netw 2022;20:497-530. 10.6004/jnccn.2022.0025 - DOI - PubMed
    1. Wang MM, Zhang Y, Wu S, et al. Clinical outcomes of KRAS-mutant non-small cell lung cancer under untargeted therapeutic regimes in the real world: a retrospective observational study. Transl Lung Cancer Res 2023;12:2030-9. 10.21037/tlcr-23-449 - DOI - PMC - PubMed
    1. Smyth MJ, Ngiow SF, Ribas A, et al. Combination cancer immunotherapies tailored to the tumour microenvironment. Nat Rev Clin Oncol 2016;13:143-58. 10.1038/nrclinonc.2015.209 - DOI - PubMed