. 2024 Jun 10:38:100625.
doi: 10.1016/j.pacs.2024.100625. eCollection 2024 Aug.

Effect of gas turbulence in quartz-enhanced photoacoustic spectroscopy: A comprehensive flow field analysis

Affiliations

Effect of gas turbulence in quartz-enhanced photoacoustic spectroscopy: A comprehensive flow field analysis

Andrea Zifarelli et al. Photoacoustics. .

Abstract

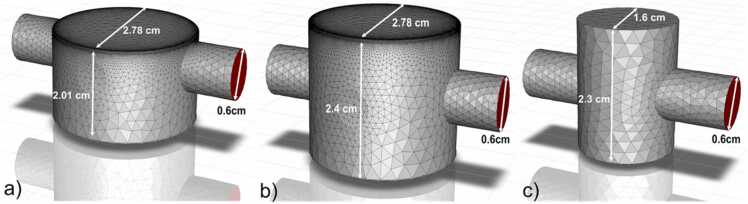
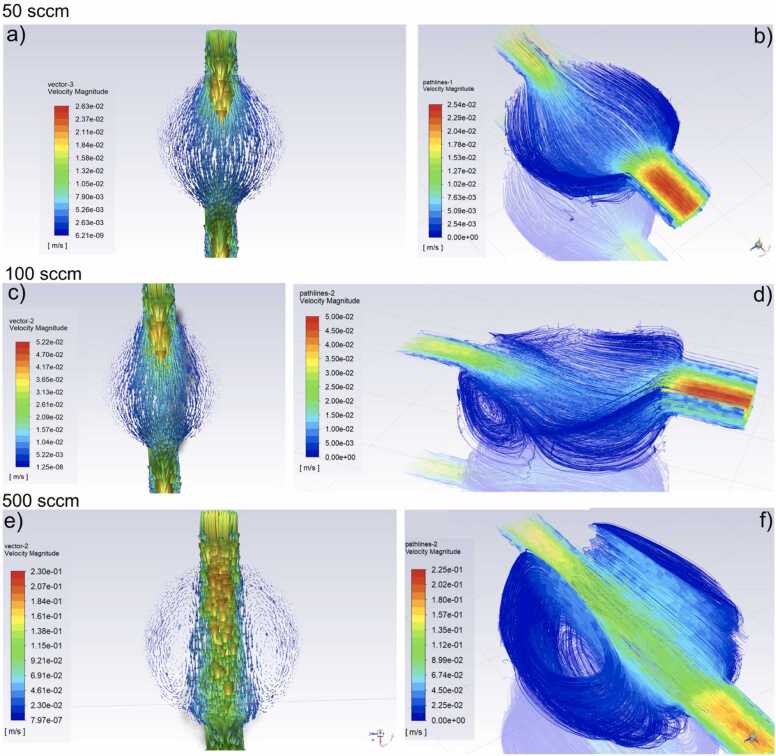
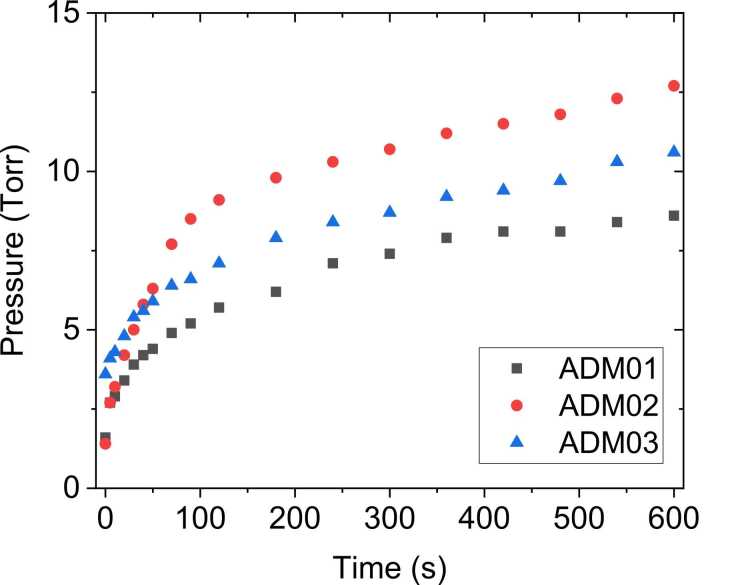
Here we present a computational and experimental fluid dynamics study for the characterization of the flow field within the gas chamber of a Quartz-Enhanced Photoacoustic Spectroscopy (QEPAS) sensor, at different flow rates at the inlet of the chamber. The transition from laminar to turbulent regime is ruled both by the inlet flow conditions and dimension of the gas chamber. The study shows how the distribution of the flow field in the chamber can influence the QEPAS sensor sensitivity, at different operating pressures. When turbulences and eddies are generated within the gas chamber, the efficiency of photoacoustic generation is significantly altered.

Keywords: Flow field analysis; Photoacoustic wave generation; QEPAS; Turbulence effect.


Conflict of interest statement

The authors declare that they have no known competing financial interests or personal relationships that could have appeared to influence the work reported in this paper.

Figures

Fig. 1
Fig. 1
(a) CAD of the starting acoustic detection module ADM01; (b) reconstruction of the internal volume chamber.
Fig. 2
Fig. 2
Computational mesh of the internal volume chamber of ADM01 (a), ADM02 (b), and ADM03 (c). Inlet and outlet have the same dimensions in all the three geometries.
Fig. 3
Fig. 3
Schematic of the operating condition of a gas chamber in a QEPAS sensor. An upstream mass flow controller fixes the flow rate injected in the chamber while a pressure controller and a pump both located downstream regulate the pressure within the volume chamber. PC – Pressure Controller.
Fig. 4
Fig. 4
Flow Field analysis within the empty volume chamber at 50 sccm ((a) and (b)), 100 sccm ((c) and (d)) and 500 sccm ((e) and (f)).
Fig. 5
Fig. 5
Flow Field magnitude on a plane perpendicular to inlet and outlet and placed at the center of the chamber simulated at MFR of 50 sccm (a) and 500 sccm (d).Flow Field magnitude ((b) and (e)) and turbulent intensity ((c) and (f)) on the plane represented by the horizontal section containing the axis of inlet and outlet, at 50 sccm ((b) and (c)) and 500 sccm ((e) and (f)) MFRs.
Fig. 6
Fig. 6
Flow Field analysis at 500 sccm in ADM02 within the empty volume chamber (a); flow field magnitude on a plane perpendicular to inlet and outlet and placed at the center of the chamber (b) and on the plane cutting the center of inlet and outlet (c); turbulent intensity on the plane cutting the center of inlet and outlet (d).
Fig. 7
Fig. 7
Flow field analysis within the empty volume chamber of ADM03 at 50 sccm (a), 100 sccm (b), and 500 sccm (c). Flow field magnitude on a plane perpendicular to inlet and outlet and placed at the center of the chamber ADM03 at 500 sccm(d).
Fig. 8
Fig. 8
The vacuum seal test for the three ADMs.
Fig. 9
Fig. 9
a) Resonance curves of the spectrophone acquired via photoacoustic excitation in 2 f-WM with the laser source locked to the methane absorption peak, for different flow rates. b) Peak value, quality factor and resonance frequency extracted from each resonance curve and plotted as a function of the flow rate.
Fig. 10
Fig. 10
QEPAS signal as a function of time acquired with ADM01 at different flow rates at 240 Torr.
Fig. 11
Fig. 11
Normalized QEPAS signals acquired at different flow rates with an operating pressure of (a) 240 Torr; (b) 400 Torr; and (c) 700 Torr. The straight line connecting the data points are guides to the eye.

References

    1. Dey A. Semiconductor metal oxide gas sensors: A review. Mater. Sci. Eng. B. 2018;229:206–217.
    1. Capelli L., Sironi S., Del Rosso R. Electronic noses for environmental monitoring applications. Sensors 2014. 2014;14:19979–20007. - PMC - PubMed
    1. Liu X., Cheng S., Liu H., Hu S., Zhang D., Ning H. A survey on gas sensing technology. Sens. (Switz. ) 2012;12:9635–9665. - PMC - PubMed
    1. Feng S., Farha F., Li Q., Wan Y., Xu Y., Zhang T., Ning H. Rev. Smart Gas. Sens. Technol., Sens. 2019;19:3760. - PMC - PubMed
    1. Wales D.J., Grand J., Ting V.P., Burke R.D., Edler K.J., Bowen C.R., Mintova S., Burrows A.D. Gas sensing using porous materials for automotive applications. Chem. Soc. Rev. 2015;44:4290–4321. - PubMed

LinkOut - more resources