. 2023 Sep 13:7:308.
doi: 10.12688/wellcomeopenres.18657.2. eCollection 2022.

Systematic review and meta-analyses: What has the application of Mendelian randomization told us about the causal effect of adiposity on health outcomes?

Affiliations

Systematic review and meta-analyses: What has the application of Mendelian randomization told us about the causal effect of adiposity on health outcomes?

Matthew A Lee et al. Wellcome Open Res. .

Abstract

Mendelian randomization (MR) is increasingly used for generating estimates of the causal impact of exposures on outcomes. Evidence suggests a causal role of excess adipose tissue (adiposity) on many health outcomes. However, this body of work has not been systematically appraised. We systematically reviewed and meta-analysed results from MR studies investigating the association between adiposity and health outcomes prior to the SARS-CoV-2/COVID-19 pandemic (PROSPERO: CRD42018096684). We searched Medline, EMBASE, and bioRxiv up to February 2019 and obtained data on 2,214 MR analyses from 173 included articles. 29 meta-analyses were conducted using data from 34 articles (including 66 MR analyses) and results not able to be meta-analysed were narratively synthesised. Body mass index (BMI) was the predominant exposure used and was primarily associated with an increase in investigated outcomes; the largest effect in the meta-analyses was observed for the association between BMI and polycystic ovary syndrome (estimates reflect odds ratios (OR) per standard deviation change in each adiposity measure): OR = 2.55; 95% confidence interval (CI) = 1.22-5.33. Only colorectal cancer was investigated with two exposures in the meta-analysis: BMI (OR = 1.18; 95% CI = 1.01-1.37) and waist-hip ratio (WHR; OR = 1.48; 95% CI = 1.08-2.03). Broadly, results were consistent across the meta-analyses and narrative synthesis. Consistent with many observational studies, this work highlights the impact of adiposity across a broad spectrum of health outcomes, enabling targeted follow-up analyses. However, missing and incomplete data mean results should be interpreted with caution.

Keywords: Mendelian randomization; Systematic review; adiposity; epidemiology; obesity.


Conflict of interest statement

No competing interests were disclosed.

Figures
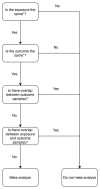
Figure 1.
Figure 1.. Inclusion criteria for meta-analysis: flowchart.
Mendelian randomization (MR) analyses were included in meta-analyses if they met the conditions set out in the flowchart with regards to sample overlap. * = MR analyses had to use the same exposure and the same outcome to be compatible, e.g., for the exposure, body mass index (BMI) could not be meta-analysed with any other exposure that was not BMI. This also applies to outcomes, e.g., the outcome oestrogen receptor negative (ER-) breast cancer could not be meta-analysed with breast cancer, it could only be meta-analysed with ER- breast cancer.
Figure 2.
Figure 2.. PRISMA flowchart.
N gives the number of articles at each stage. MR = Mendelian randomization.
Figure 3.
Figure 3.. Distribution of publication year and average exposure and outcome sample sizes across included studies up to the search date of February 2019.
The number of articles included per year is given on the left Y axis; the right Y axis gives the average sample size for exposure (grey) and outcome (red) for each year. Outcome cases and controls were summed within analyses for binary outcomes.
Figure 4.
Figure 4.. Distribution of study design across 173 included articles.
The Y axis gives the MR study design and the X axis gives the number of studies for that study design. The majority of the 173 included articles reported more than one Mendelian randomization (MR) analysis. Where a study performed a bi-directional MR analysis and adiposity was the secondary analysis (i.e., to check for reverse causation), this was recorded as a bi-directional MR analysis. One-sample and two-sample MR meta-analysis indicates that the meta-analysis included MR analyses that were both one- and two-sample designs. Generalized summary data-based MR allows for, and models, correlated SNPs within the instrument. Factorial MR is analogous to a factorial randomized controlled trial, whereby individuals are grouped using genetic scores (generally in a 2 x 2 approach). An MR-PheWAS is the investigation of a single trait on many, potentially hundreds, of outcomes. Direct G-O refers to an MR analysis which used instruments from a single locus, e.g., the FTO locus.
Figure 5.
Figure 5.. Quality assessment: distribution of quality assessment scores for studies included in the meta-analyses.
“High” indicates a study scored highly; “low” indicates a study scored poorly. QA = quality assessment score.
Figure 6.
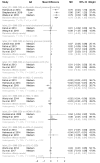
Figure 6.. Meta-analysis: effect estimates and 95% confidence intervals for binary outcomes.
Forest plot shows effect estimates and 95% confidence intervals (CIs) from a meta-analysis of 22 different exposure-outcome pairs. Mendelian randomization analyses included based on criteria in Figure 1. P-values are given for the heterogeneity statistics. QA = quality assessment score; OR = odds ratio. Available on GitHub. Forest plots of individual meta-analyses are also available on GitHub.
Figure 7.
Figure 7.. Meta-analysis: effect estimates and 95% confidence intervals for continuous outcomes.
Forest plot shows effect estimates and 95% confidence intervals (CIs) from a meta-analysis of 9 different exposure-outcome pairs. Mendelian randomization analyses included based on criteria in Figure 1. P-values are given for the heterogeneity statistics. QA = quality assessment score; OR = odds ratio. Available on GitHub. Forest plots of individual meta-analyses are also available on GitHub.

References

    1. Flegal KM, Kit BK, Orpana H, et al. : Association of all-cause mortality with overweight and obesity using standard body mass index categories: a systematic review and meta-analysis. JAMA. 2013;309(1):71–82. 10.1001/jama.2012.113905 - DOI - PMC - PubMed
    1. Rost S, Freuer D, Peters A, et al. : New indexes of body fat distribution and sex-specific risk of total and cause-specific mortality: a prospective cohort study. BMC Public Health. 2018;18(1): 427. 10.1186/s12889-018-5350-8 - DOI - PMC - PubMed
    1. Cornier MA, Després JP, Davis N, et al. : Assessing Adiposity: a scientific statement from the American Heart Association. Circulation. 2011;124(18):1996–2019. 10.1161/CIR.0b013e318233bc6a - DOI - PubMed
    1. Koliaki C, Liatis S, Kokkinos A: Obesity and cardiovascular disease: revisiting an old relationship. Metabolism. 2019;92:98–107. 10.1016/j.metabol.2018.10.011 - DOI - PubMed
    1. Bhaskaran K, Douglas I, Forbes H, et al. : Body-mass index and risk of 22 specific cancers: a population-based cohort study of 5·24 million UK adults. Lancet. 2014;384(9945):755–765. - PMC - PubMed

Publication types

LinkOut - more resources