. 2024 Jul 2:12:e17586.
doi: 10.7717/peerj.17586. eCollection 2024.

HaMADS3, HaMADS7, and HaMADS8 are involved in petal prolongation and floret symmetry establishment in sunflower (Helianthus annuus L.)

Affiliations

HaMADS3, HaMADS7, and HaMADS8 are involved in petal prolongation and floret symmetry establishment in sunflower (Helianthus annuus L.)

Qian Wang et al. PeerJ. .

Abstract

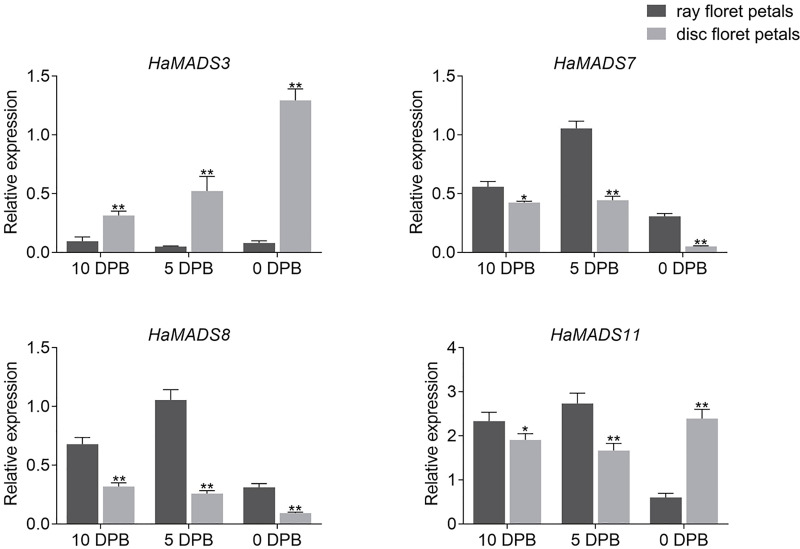
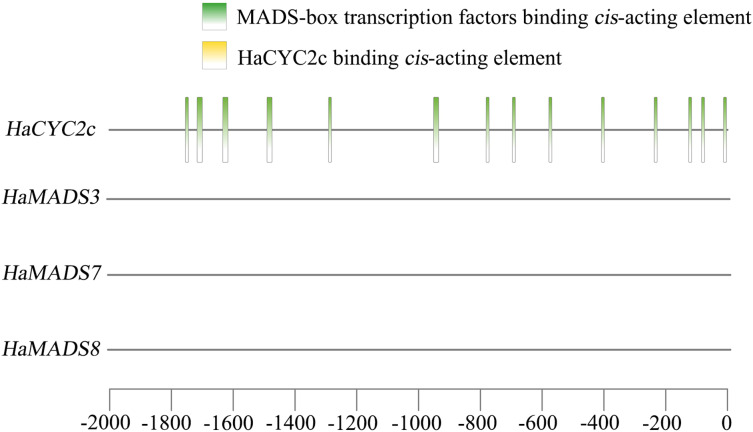
The development of floral organs, crucial for the establishment of floral symmetry and morphology in higher plants, is regulated by MADS-box genes. In sunflower, the capitulum is comprised of ray and disc florets with various floral organs. In the sunflower long petal mutant (lpm), the abnormal disc (ray-like) floret possesses prolongated petals and degenerated stamens, resulting in a transformation from zygomorphic to actinomorphic symmetry. In this study, we investigated the effect of MADS-box genes on floral organs, particularly on petals, using WT and lpm plants as materials. Based on our RNA-seq data, 29 MADS-box candidate genes were identified, and their roles on floral organ development, especially in petals, were explored, by analyzing the expression levels in various tissues in WT and lpm plants through RNA-sequencing and qPCR. The results suggested that HaMADS3, HaMADS7, and HaMADS8 could regulate petal development in sunflower. High levels of HaMADS3 that relieved the inhibition of cell proliferation, together with low levels of HaMADS7 and HaMADS8, promoted petal prolongation and maintained the morphology of ray florets. In contrast, low levels of HaMADS3 and high levels of HaMADS7 and HaMADS8 repressed petal extension and maintained the morphology of disc florets. Their coordination may contribute to the differentiation of disc and ray florets in sunflower and maintain the balance between attracting pollinators and producing offspring. Meanwhile, Pearson correlation analysis between petal length and expression levels of MADS-box genes further indicated their involvement in petal prolongation. Additionally, the analysis of cis-acting elements indicated that these three MADS-box genes may regulate petal development and floral symmetry establishment by regulating the expression activity of HaCYC2c. Our findings can provide some new understanding of the molecular regulatory network of petal development and floral morphology formation, as well as the differentiation of disc and ray florets in sunflower.

Keywords: Floral development; MADS-box genes; Petal prolongation; Sunflower; Symmetry.


Conflict of interest statement

The authors declare that they have no competing interests.

Figures

Figure 1
Figure 1. Morphological and histological comparison between WT and lpm.
(A) Capitulum. Bar = 1 cm. (B and C) Anatomy of disc and ray floret. Bar = 5 mm. (D) Petal length. R: ray floret (the 1st parastichy). OD: outer disc floret (the 5th parastichy). ID: intermediate disc floret (the 15th parastichy). CD: central disc floret (the 19th parastichy). Each column represents the mean ± SD of 20 biological replicates. Different lowercase letters represent significant differences (P < 0.05 by one-way ANOVA analysis and Tukey multiple comparison). (E) Morphological analysis of disc floret (yellow), stamen (blue), and pistil (orange) at different stages. DPB: days prior to floret blooming, corresponding to the reproductive stage. 25, 20, 15, and 10 DPB: bar = 1 mm. 5 and 0 DPB: bar = 2 mm. (F) Histological analysis of disc floret at different stages. Pe: petal. St: stamen. Pi: pistil. 30 and 25 DPB: bar = 0.1 mm. 20 and 15 DPB: bar = 0.2 mm. (G) Cell size and number analysis of petal. Each column represents the mean ± SD of 20 biological replicates. Different lowercase letters represent significant differences (P < 0.05 by one-way ANOVA analysis and Tukey multiple comparison).
Figure 2
Figure 2. Analysis of conserved motifs of MADS-box protein in sunflower and construction of phylogenetic tree.
(A) Conserved motifs of MADS-box proteins in sunflower. The conserved motifs were visualized via MEME online website, and P-value was calculated referring to Tanaka, Bailey & Keich, 2014. (B) Phylogenetic tree of MADS-box genes in sunflower and A. thaliana. Neighbor-joining tree with bootstrap replications of 1,000, the branch length represents sequence similarity.
Figure 3
Figure 3. Expression analysis of MADS-box genes.
(A) Tissue expression pattern of MADS-box genes in sunflower based on RNA-seq data. Color change from red to blue represents a change of expression level from high to low. Group A: the genes with highest expression level in flower. Group B: the genes expressed in all tissues. Group C: the genes hardly expressed in flower. (B) Expression pattern of MADX-box genes in different stages of flower development. Note: Each column represents mean ± SEM of three technical. An asterisk (*) represents P < 0.05 and two asterisks (**) represent P < 0.01 by one-way ANOVA analysis.
Figure 4
Figure 4. Expression of MADS-box genes in petals at 5 DPB and 0 DPB.
Note: Each column represents mean ± SEM of three technical. An asterisk (*) represents P < 0.05 and two asterisks (**) represent P < 0.01 by one-way ANOVA analysis.
Figure 5
Figure 5. Expression of MADS-box genes in disc and ray floret petal of WT plants at different stages.
Note: Each column represents mean ± SEM of three technical. An asterisk (*) represents P < 0.05 and two asterisks (**) represent P < 0.01 by one-way ANOVA analysis.
Figure 6
Figure 6. Expression of MADS-box genes in petals of WT and lpm plants on different positions.
R: ray floret (the 1st parastichy of floret). OD: outer disc floret (the 5th parastichy of floret). ID: intermediate disc floret (the 15th parastichy of floret), CD: central disc floret (the 19th parastichy of floret). Different lowercase letters represent significant differences (P < 0.05 by one-way ANOVA analysis and Tukey multiple comparison).
Figure 7
Figure 7. Analysis of cis-acting element.

Similar articles

References

    1. Almeida J, Galego L. Flower symmetry and shape in Antirrhinum. International Journal of Developmental Biology. 2004;49(5–6):527–537. doi: 10.1387/ijdb.041967ja. - DOI - PubMed
    1. Alvarez-Buylla ER, Benítez M, Corvera-Poiré A, Chaos Cador Á, de Folter S, Gamboa de Buen A, Garay-Arroyo A, García-Ponce B, Jaimes-Miranda F, Pérez-Ruiz RV, Piñeyro-Nelson A, Sánchez-Corrales YE. Flower development. The Arabidopsis Book/American Society of Plant Biologists. 2010;8(1):e0127. doi: 10.1199/tab.0127. - DOI - PMC - PubMed
    1. Celedón-Neghme C, Gonzáles WL, Gianoli E. Cost and benefits of attractive floral traits in the annual species Madia sativa (Asteraceae) Evolutionary Ecology. 2007;21(2):247–257. doi: 10.1007/s10682-006-9002-6. - DOI
    1. Chai Y, Liu H, Chen W, Guo C, Chen H, Cheng X, Chen D, Luo C, Zhou X, Huang C. Advances in research on the regulation of floral development by CYC-like genes. Current Issues in Molecular Biology. 2023;45(3):2035–2059. doi: 10.3390/cimb45030131. - DOI - PMC - PubMed
    1. Chang YY, Kao NH, Li JY, Hsu WH, Liang YL, Wu JW, Yang CH. Characterization of the possible roles for B class MADS box genes in regulation of perianth formation in orchid. Plant Physiology. 2010;152(2):837–853. doi: 10.1104/pp.109.147116. - DOI - PMC - PubMed

MeSH terms

LinkOut - more resources