. 2024 Mar;3(3):269-282.
doi: 10.1038/s44161-024-00429-9. Epub 2024 Mar 12.

TREM2 protects from atherosclerosis by limiting necrotic core formation

Affiliations

TREM2 protects from atherosclerosis by limiting necrotic core formation

Marie Piollet et al. Nat Cardiovasc Res. 2024 Mar.

Abstract

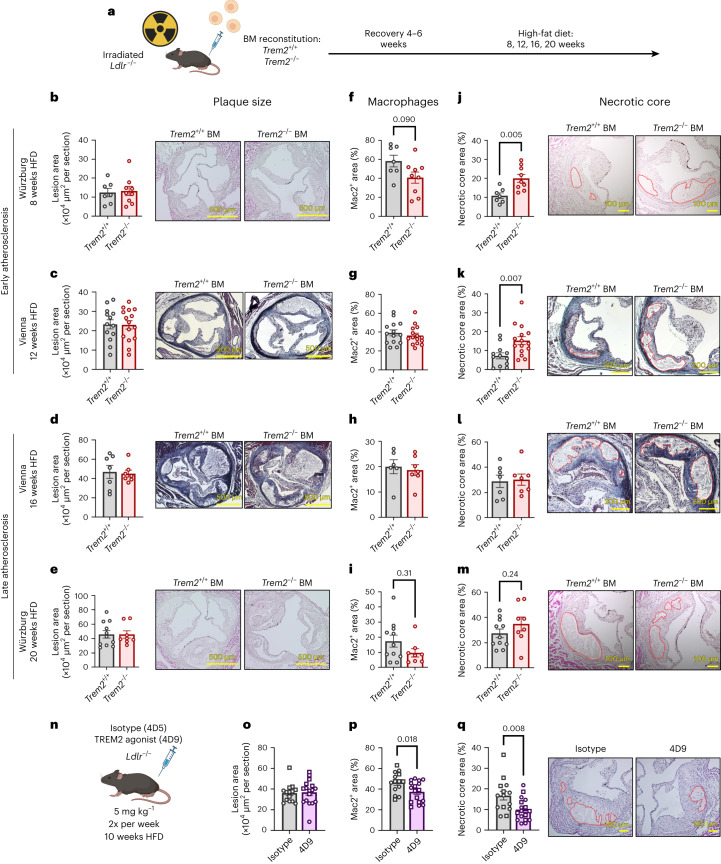
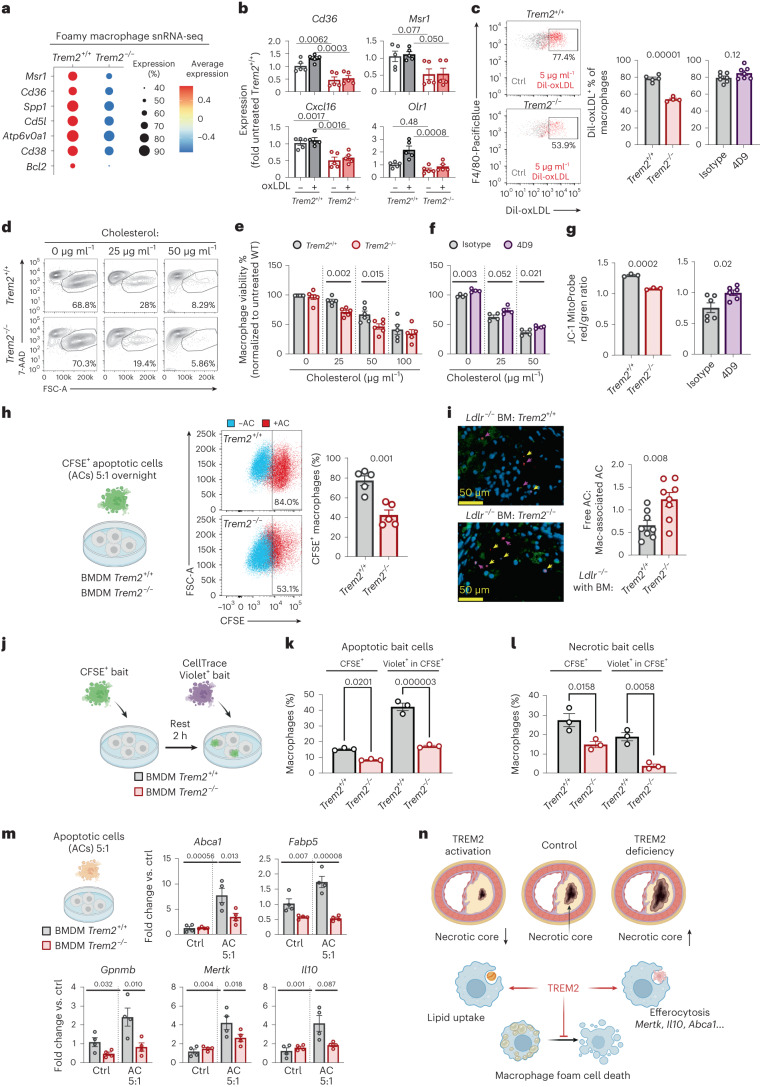
Atherosclerosis is a chronic disease of the vascular wall driven by lipid accumulation and inflammation in the intimal layer of arteries, and its main complications, myocardial infarction and stroke, are the leading cause of mortality worldwide [1], [2]. Recent studies have identified Triggering receptor expressed on myeloid cells 2 (TREM2), a lipid-sensing receptor regulating myeloid cell functions [3], to be highly expressed in macrophage foam cells in experimental and human atherosclerosis [4]. However, the role of TREM2 in atherosclerosis is not fully known. Here, we show that hematopoietic or global TREM2 deficiency increased, whereas TREM2 agonism decreased necrotic core formation in early atherosclerosis. We demonstrate that TREM2 is essential for the efferocytosis capacities of macrophages, and to the survival of lipid-laden macrophages, indicating a crucial role of TREM2 in maintaining the balance between foam cell death and clearance of dead cells in atherosclerotic lesions, thereby controlling plaque necrosis.


Conflict of interest statement

Competing Interests statement Christian Haass is a collaborator of Denali Therapeutics and a member of the advisory board of AviadoBio. Other authors have no conflicts of interest to declare.

Figures

Fig. 1
Fig. 1. Trem2 expression patterns at the single-cell level in mouse and human atherosclerosis.
a, Uniform manifold approximation and projection (UMAP) visualization of scRNA-seq profiles of total mouse aortic cells in Ldlr−/− mice fed normal chow or an HFD for 8 weeks, 16 weeks or 26 weeks (Ldlr−/− HFD), n = 1 scRNA-seq library per timepoint. b, Expression of Trem2 in murine aortas projected onto the UMAP plot, split according to experimental condition. c, UMAP plot of mouse aortic MPCs identified in a after subsetting and reclustering. Inflamm., inflammatory; Mono, monocyte; (p)DC, (plasmacytoid) dendritic cell; Prolif., proliferating. d, Proportion of MPC clusters among all MPCs, and macrophage clusters among all macrophages, at different times of HFD feeding. e, Trem2 expression levels in MPC clusters. UMAP visualization of scRNA-seq of human atherosclerotic coronary artery cells (n = 4 patients, data from ref. ) (f) and expression of TREM2 projected onto the UMAP plot (g). UMAP visualization of scRNA-seq profiles of human coronary artery MPCs after subsetting and reclustering (h) and expression of TREM2 projected onto the UMAP plot (i). APC, antigen-presenting cell; Cytotoxic, cytotoxic T cell; EC, endothelial cell; Fibro, fibroblast; gdT, gammadelta T cell; LEC, lymphatic endothelial cell; MSC, mesenchymal stromal cell; Neutro, neutrophil; NK, natural killer cell. j, sTREM2 levels in the serum of patients with or without progression of atherosclerotic lesions from baseline to follow-up. Statistical test: unpaired two-tailed t-test. Center: median; dashed lines: quartiles. k, Plot showing adjusted OR (center of measure) and 95% CI (error bars) for progression of atherosclerotic carotid lesions from baseline to follow-up investigation after a median of 7.5 months (range, 6–9 months) in 707 patients. OR was calculated by multivariable logistic regression analysis with adjustment for age, sex, history of myocardial infarction, stroke and peripheral artery disease, arterial hypertension, smoking history, statin use, hypertension, LDL cholesterol and HbA1c. Source data
Fig. 2
Fig. 2. TREM2 controls necrotic core formation in early experimental atherosclerosis.
a, Experimental design for atherogenesis experiments in BM chimeras reconstituted with Trem2+/+ or Trem2−/− BM. Aortic sinus plaque size (be), macrophage content (expressed in percent of cellular plaque area) (fi) and necrotic core size (expressed in percent of total plaque area; necrotic area is demarcated by a dashed red line) (jm) in Ldlr−/− mice irradiated and reconstituted with Trem2+/+ or Trem2−/− BM cells and fed an HFD for 8 weeks (b,f,j: n = 7 Trem2+/+ BM, n = 9 Trem2−/− BM); 12 weeks (c,g,k: n = 13 Trem2+/+ BM, n = 15 Trem2−/− BM in c; n = 14 Trem2+/+ BM, n = 15 Trem2−/− BM in g, n = 12 Trem2+/+ BM, n = 15 Trem2−/− BM in k); 16 weeks (d,h,l: n = 7 Trem2+/+ BM, n = 7 Trem2−/− BM in d,l; n = 6 Trem2+/+ BM, n = 7 Trem2−/− BM in h); or 20 weeks (e,i,m: n = 11 Trem2+/+ BM, n = 8 Trem2−/− BM). n, Experimental design for the in vivo TREM2 agonism experiment. Aortic sinus plaque size (o), macrophage content (expressed in percent of cellular plaque area) (p) and necrotic core size (expressed in percent of total plaque area; necrotic area is demarcated by a dashed red line) (q) in Ldlr−/− mice fed an HFD and treated with isotype antibody or 4D9 for 10 weeks (5 mg kg−1 i.p. twice weekly) (n = 14 Ldlr−/− mice treated with isotype control (eight males, six females); n = 17 Ldlr−/− mice treated with 4D9 (10 males, seven females). Squares, female mice; circles, male mice; pooled from two experiments. All bar graphs in Fig. 2 present data as mean ± s.e.m. together with individual data point distribution. Statistical tests: two-tailed Mann–Whitney test (b,d,f,hj,l); two-tailed unpaired t-test (c,e,g,k,m,oq). Pictures in a and n were created with BioRender. Source data
Fig. 3
Fig. 3. TREM2 controls macrophage survival and efferocytosis.
a, Dot plot of differentially expressed genes in Ldlr−/−Trem2+/+ and Ldlr−/−Trem2−/− foamy macrophages as determined by snRNA-seq analyses. b, Expression of the indicated transcripts in Trem2+/+ and Trem2−/− BMDMs with or without oxLDL loading (n = 5 biological replicates per genotype and condition; pooled from two experiments). c, Dil-oxLDL uptake by Trem2+/+ and Trem2−/− BMDMs (n = 5 Trem2+/+ and n = 4 Trem2−/− biological replicates; representative of two independent experiments) and in BMDMs treated with the TREM2 agonistic antibody 4D9 (n = 7 biological replicates; pooled from two experiments). Representative flow cytometric analysis of BMDM survival in response to free cholesterol loading (d) and analysis of macrophage viability (expressed as percent of untreated wild-type (WT) control) (e) (0 µg ml−1 and 50 µg ml−1 cholesterol, n = 6 biological replicates per genotype; 25 µg ml−1 and 100 µg ml−1 cholesterol, n = 5 biological replicates per genotype; data were pooled from six experiments with BMDMs from n = 1 mouse from each genotype assayed in technical triplicates). f, Analysis of macrophage viability in response to free cholesterol loading in BMDMs treated with 4D9 or isotype control (n = 4 biological replicates per condition; representative of two independent experiments). g, JC-1 MitoProbe red/green ratio indicating mitochondrial potential in viable 7-AAD macrophages after free cholesterol loading (25 µg ml−1) in Trem2+/+ and Trem2−/− BMDMs (left; n = 3 biological replicates per genotype and condition; one experiment) and in 4D9-treated BMDMs (right; n = 6 biological replicates; pooled from two experiments). h, Efferocytosis assay with experimental design, representative flow cytometry plots (pre-gated on viable F4/80+ cells) and quantitative analysis of phagocytic macrophages after overnight co-incubation with CFSE-labeled apoptotic Jurkat T cells (n = 5 Trem2+/+ and n = 5 Trem2−/− biological replicates; pooled from two independent experiments). i, Analysis of in situ efferocytosis in Ldlr−/− mice with hematopoietic Trem2 deficiency after 12 weeks of HFD with representative pictures and quantification of the free apoptotic cell:macrophage-associated apoptotic cell ratio. For representative images, F4/80+ areas are shown in green, TUNEL+ areas in red and DAPI+ nuclei in blue. Pink arrows indicate F4/80+ macrophage-associated TUNEL+DAPI+ apoptotic cells, and yellow arrows indicate free TUNEL+DAPI+ apoptotic cells (n = 8 Ldlr−/− mice with Trem2+/+ BM and n = 8 Ldlr−/− mice with Trem2−/− BM). jl, Continuous efferocytosis assay with experimental design (j), continuous efferocytosis assay with apoptotic bait cells (k) and continuous efferocytosis assay with necrotic bait cells (l) (for k and l: n = 3 Trem2+/+ and n = 3 Trem2−/− biological replicates; one experiment). m, Gene expression in Trem2+/+ and Trem2−/− BMDMs in response to apoptotic cell efferocytosis overnight (n = 4 biological replicates per genotype and condition; one experiment). n, Proposed model and overview of the conclusions. ctrl, control; FSC-A; forward scatter area. Source data
Extended Data Fig. 1
Extended Data Fig. 1. Additional scRNA-seq analysis of mouse aortic macrophages and vascular smooth muscle cells (related to Fig. 1).
a) Percent of cells with detectable Trem2 transcripts across aortic cell types/states in Fig. 1a; b) UMAP plot displayed in Fig. 1c of mononuclear phagocyte clusters split according to time of high fat diet feeding; c) expression of marker genes used to identify macrophage subsets projected onto the UMAP plot; d) dot plot showing expression of marker genes in mononuclear phagocyte populations; e) proportion of vascular smooth muscle cell (VSMC) clusters among total VSMCs according to time of high fat diet feeding; f) marker gene expression in the VSMC clusters; g) expression of foamy macrophage markers in the VSMC clusters. Statistical analysis performed in Seurat using ‘FindAllMarkers’ with default parameters and statistical test (Wilcoxon Rank Sum test); n cells VSMC_1: 6,618; VSMC_2: 5,143; VSCM_3: 1,945; h) levels of serum soluble Trem2 (sTREM2), aortic sTREM2 and aortic cellular TREM2 in Ldlr−/− mice fed normal chow (n = 5) or a high fat diet (n = 6) for 6 weeks, male mice, data presented as mean +/− SEM together with individual data point distribution, statistical test: two-tailed Mann Whitney test. Source data
Extended Data Fig. 2
Extended Data Fig. 2. Additional scRNA-seq analysis of human atherosclerotic coronary artery mononuclear phagocytes (related to Fig. 1).
a) Expression of the indicated transcripts projected onto the UMAP plot presented in Fig. 1i of human atherosclerotic coronary artery mononuclear phagocytes; b) dot plot of top marker genes used to identify human atherosclerotic coronary artery mononuclear phagocytes clusters. Prolif.: proliferating.
Extended Data Fig. 3
Extended Data Fig. 3. Additional analyses of atherosclerosis (related to Fig. 2).
a) Atherosclerotic lesion formation in the aorta at 8 weeks of HFD feeding (n = 7 Trem2+/+ BM, n = 9 Trem2−/− BM, all males) and b) atherosclerotic lesion formation in the innominate artery (n = 13 Trem2+/+ BM, n = 14 Trem2−/− BM, all males) and aorta at 12 weeks of HFD (n = 9 Trem2+/+ BM, n = 11 Trem2−/− BM, all males) in Ldlr−/− mice irradiated and reconstituted with Trem2+/+ or Trem2−/− bone marrow. Data in a and b presented as mean +/− SEM together with individual data point distribution, statistical test: two-tailed Mann Whitney test (a, b for en face aorta); unpaired two-tailed t test (b for innominate artery). c) representative pictures of macrophage coverage (Mac2 staining), related to Fig. 2f (8 weeks HFD; n = 7 Trem2+/+ BM, n = 9 Trem2−/− BM, all males), Fig. 2g (12 weeks HFD; n = 14 Trem2+/+ BM, n = 15 Trem2−/− BM, all males), Fig. 2h (16 weeks HFD; n = 6 Trem2+/+ BM, n = 7 Trem2−/− BM, all males), and Fig. 2i (20 weeks HFD; n = 11 Trem2+/+ BM, n = 8 Trem2−/− BM, all males). d) representative pictures of macrophage coverage (Mac2 staining) in in Ldlr−/− mice fed a high fat diet and treated with isotype antibody or 4D9 for 10 weeks (5mg/kg i.p. twice weekly), related to Fig. 2p (n = 14 Ldlr−/− mice treated with isotype control (8 males, 6 females); 17 Ldlr−/−, mice treated with 4D9 (10 males, 7 females)). Source data
Extended Data Fig. 4
Extended Data Fig. 4. Analysis of atherosclerosis in Ldlr−/−Trem2−/− mice.
a-d) Analysis of atherosclerosis in Ldlr−/−Trem2−/− mice after 10 weeks with a) lesion coverage in the aorta (n = 6 male mice per genotype), b) plaque size in the aortic sinus (Ldlr−/−Trem2+/+: 11 males, 4 females; Ldlr−/−Trem2−/− n = 11 males, 5 females), c) macrophage coverage in aortic sinus lesions (expressed in percent of cellular plaque area; Ldlr−/−Trem2+/+: 12 males, 5 females; Ldlr−/−Trem2−/− n = 12 males, 6 females) and d) necrotic core relative size (expressed in percent of total plaque area; Ldlr−/−Trem2+/+: 12 males, 5 females; Ldlr−/−Trem2−/− n = 12 males, 6 females) in aortic sinus lesions; e-g) analysis of atherosclerosis in Ldlr−/−Trem2−/− mice after 20 weeks of HFD feeding with e) plaque size in the aortic sinus (Ldlr−/−Trem2+/+: 9 males, 6 females; Ldlr−/−Trem2−/− n = 9 males, 6 females), f) macrophage coverage in aortic sinus lesions (Ldlr−/−Trem2+/+: 9 males, 7 females; Ldlr−/−Trem2−/− n = 11 males, 6 females) and g) necrotic core relative size in aortic sinus lesions (Ldlr−/−Trem2+/+: 9 males, 7 females; Ldlr−/−Trem2−/− n = 11 males, 6 females). Open circles: female mice; filled circles: male mice. Data presented as mean +/− SEM together with individual data point distribution. Statistical test: two-tailed Mann Whitney test (all panels). Source data
Extended Data Fig. 5
Extended Data Fig. 5. Analysis of atherosclerosis in Ldlr−/− mice treated with low dose TREM2 agonist antibody 4D9.
a) Lesion coverage in the en face aorta of Ldlr−/− mice treated with 4D9 as in Fig. 2n-q (5mg/kg twice weekly, 10 weeks high fat diet (HFD)); n = 8 Ldlr−/− mice treated with isotype control (3 males, 5 females); 11 Ldlr−/− mice treated with 4D9 (5 males, 6 females), squares: female mice, circles: male mice. b-e) analysis of atherosclerosis in mice treated with low dose 4D9 (1mg/kg weekly, 9 weeks high fat diet) with b) lesion coverage in the en face aorta (n = 19 Ldlr−/− mice treated with isotype control, n = 17 Ldlr−/− mice treated with 4D9), c) lesion size in the aortic sinus (n = 17 Ldlr−/− mice treated with isotype control, n = 16 Ldlr−/− mice treated with 4D9), d) macrophage coverage in aortic sinus lesions (n = 18 Ldlr−/− mice treated with isotype control, n = 16 Ldlr−/− mice treated with 4D9) and e) relative necrotic core size in aortic sinus atherosclerotic lesions (n = 19 Ldlr−/− mice treated with isotype control, n = 17 Ldlr−/− mice treated with 4D9); data in b-e pooled from two experiments, all male mice. Data presented as mean +/− SEM together with individual data point distribution. Statistical test: two-tailed unpaired t test (all panels). Pictures in a and b created with BioRender.com. Source data
Extended Data Fig. 6
Extended Data Fig. 6. Single-nucleus RNA-seq of Ldlr−/−Trem2−/− aortas.
a) Experimental design; b) UMAP visualization of aortic single-nucleus transcriptomes from Ldlr−/−Trem2+/+ (n = 3 females) and Ldlr−/−Trem2−/− (n = 3 females) mice after 10 weeks of HFD feeding (MPC:mononuclear phagocytes, VSMC: vascular smooth muscle cells) and c) expression of marker genes defining cell lineages; d) UMAP plot of mononuclear phagocytes after subsetting and reclustering (Mac: macrophage; Myelo: myeloid cell; DC: dendritic cell; nd: not determined); e) marker genes of mononuclear phagocyte clusters; f) expression of selected differentially expressed genes in foamy macrophages as determined from pseudo-bulk analysis of experimental replicates from the snRNA-seq data. Samples with >200 foamy macrophages were included for pseudo-bulk analysis. Picture in a created with BioRender.com.
Extended Data Fig. 7
Extended Data Fig. 7. Additional in vitro assays.
a) Gene expression in thioglycolate-elicited peritoneal macrophages (Thio-PM) in response to OxLDL and native LDL (nLDL); pooled from 2 (Abca1, Abcg1), 3 (Cd36, Lgals3) or 4 (Gpnmb, Trem2) experiments (n for each condition indicated in the figure, each data point representing a biological replicate, statistical test: 1 way ANOVA with Tukey’s test for multiple comparison); b-d) in vitro efferocytosis assay with Thio-PM with b) experimental design, c) representative flow cytometry plot with a 4:1 apoptotic cell (AC):macrophage ratio, and d) quantitative analysis (n = 6 Trem2+/+, n = 5 Trem2−/− biological replicates; 2 pooled experiments, statistical test: two-tailed Mann Whitney test). e) sorting strategy to assess gene expression in efferocytic bone marrow derived macrophages (BMDM). Cells were pregated on viable F4/80+ macrophages. Efferopos: efferocytosis-positive, Efferoneg: efferocytosis-negative; f) gene expression in efferocytic and non-efferocytic BMDM as sorted in e (gene expression normalized to Hprt and expressed as fold of control that is Trem2+/+ efferoneg; n = 3 Trem2+/+, n = 3 Trem2−/− biological replicates; 1 experiment, statistical test: 1 way ANOVA with Tukey’s test for multiple comparison). One biological replicate: macrophages from one mouse. All bar graphs in Extended Data Fig. 7 presented as mean +/− SEM together with individual data point distribution. Picture in b created with BioRender.com. Source data
Extended Data Fig. 8
Extended Data Fig. 8. Cd47 expression in aortic cells.
Normalized Cd47 transcript expression in single-nucleus RNA seq data in aortic cell populations identified in Supplementary Figure 6, split according to genotype.

References

    1. Libby, P. et al. Atherosclerosis. Nat. Rev. Dis. Primers5, 56 (2019). 10.1038/s41572-019-0106-z - DOI - PubMed
    1. Roy, P., Orecchioni, M. & Ley, K. How the immune system shapes atherosclerosis: roles of innate and adaptive immunity. Nat. Rev. Immunol.22, 251–265 (2022). 10.1038/s41577-021-00584-1 - DOI - PMC - PubMed
    1. Deczkowska, A., Weiner, A. & Amit, I. The physiology, pathology, and potential therapeutic applications of the TREM2 signaling pathway. Cell181, 1207–1217 (2020). 10.1016/j.cell.2020.05.003 - DOI - PubMed
    1. Zernecke, A. et al. Integrated single-cell analysis based classification of vascular mononuclear phagocytes in mouse and human atherosclerosis. Cardiovasc. Res. 119, 1676–1689 (2022). - PMC - PubMed
    1. Binder, C. J., Papac-Milicevic, N. & Witztum, J. L. Innate sensing of oxidation-specific epitopes in health and disease. Nat. Rev. Immunol.16, 485–497 (2016). 10.1038/nri.2016.63 - DOI - PMC - PubMed

LinkOut - more resources