. 2024 May 8;27(6):109912.
doi: 10.1016/j.isci.2024.109912. eCollection 2024 Jun 21.

Cbl and Cbl-b ubiquitin ligases are essential for intestinal epithelial stem cell maintenance

Affiliations

Cbl and Cbl-b ubiquitin ligases are essential for intestinal epithelial stem cell maintenance

Neha Zutshi et al. iScience. .

Abstract

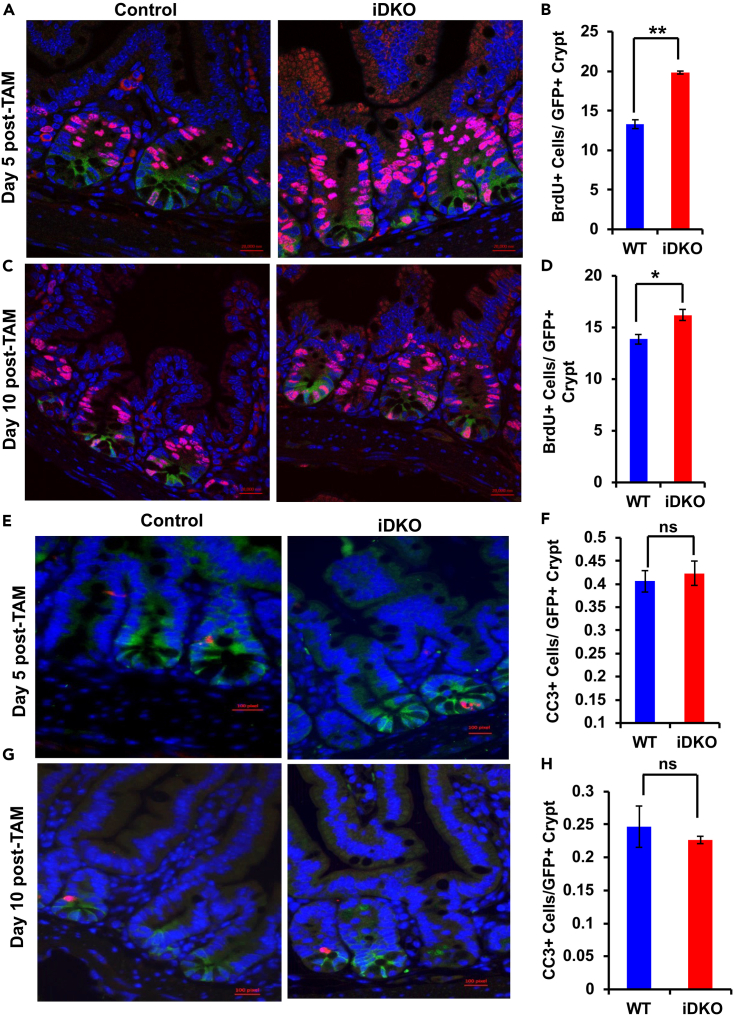
Receptor tyrosine kinases (RTKs) control stem cell maintenance vs. differentiation decisions. Casitas B-lineage lymphoma (CBL) family ubiquitin ligases are negative regulators of RTKs, but their stem cell regulatory roles remain unclear. Here, we show that Lgr5+ intestinal stem cell (ISC)-specific inducible Cbl-knockout (KO) on a Cblb null mouse background (iDKO) induced rapid loss of the Lgr5 Hi ISCs with transient expansion of the Lgr5 Lo transit-amplifying population. LacZ-based lineage tracing revealed increased ISC commitment toward enterocyte and goblet cell fate at the expense of Paneth cells. Functionally, Cbl/Cblb iDKO impaired the recovery from radiation-induced intestinal epithelial injury. In vitro, Cbl/Cblb iDKO led to inability to maintain intestinal organoids. Single-cell RNA sequencing in organoids identified Akt-mTOR (mammalian target of rapamycin) pathway hyperactivation upon iDKO, and pharmacological Akt-mTOR axis inhibition rescued the iDKO defects. Our results demonstrate a requirement for Cbl/Cblb in the maintenance of ISCs by fine-tuning the Akt-mTOR axis to balance stem cell maintenance vs. commitment to differentiation.

Keywords: Biochemistry; Biological sciences; Cell biology; Molecular biology; Natural sciences; Stem cells research.


Conflict of interest statement

H.B. and V.B. received funding from Nimbus Therapeutics for an unrelated project.

Figures

None
Graphical abstract
Figure 1
Figure 1
Preferential expression of Cbl and Cbl-b proteins in the crypt regions of the intestine (A and B) Immunohistochemical (IHC) staining for Cbl (A) and Cbl-b (B) on formalin-fixed paraffin-embedded (FFPE) tissue sections from 6-weeks-old mice reveals their expression in a gradient from crypt to villus in WT animals; lack of epithelial staining in sections from Cbl−/− or Cblb−/− knockout mice demonstrates the specificity of antibody staining. (C) Crypt-villus fractionation of intestinal mucosa followed by immunoblotting confirmed the crypt enrichment of Cbl and Cbl-b expression. Blotting for crypt (pH3 and Cyclin D1)- and villus (Villin-1)-associated markers confirmed the purity of villus and crypt fractions. Hsc-70 served as a loading control. (D) Immunoblot analysis of crypt and villus fractions prepared from age- and gender-matched WT, Cbl−/−, and Cblb−/− mice. Within the crypt compartment, deletion of Cblb resulted in an increase in the expression of Cbl while Cbl-b expression was unchanged upon deletion of Cbl. The reverse was seen in the villus compartment, with an increase in Cbl-b expression upon Cbl deletion whereas Cbl expression was unchanged in Cblb−/− animals. Scale bars in A and B are 50 μm; data are representative of 3 experiments. (E and F) Altered intestinal epithelial cell proliferation and differentiation in Cbl-/- mice. (E) WT and Cbl−/− mice were injected with BrdU 4 h prior to euthanasia and FFPE sections of intestines were stained with anti-BrdU antibody (Red) and DAPI (Blue); scale bar = 20 μm. (F) Quantification of the number of BrdU+ cells per crypt shows an increased proportion of cells in S phase of the cell cycle in Cbl null mice. (G and I) Muc2 staining of tissue sections from age-matched WT, Cbl−/−, and Cblb−/− mice revealed a significant increase in the number of goblet cells (Crypt-villus unit) in both Cbl−/− and Cblb−/− mice (H and J) and a significant reduction in the Paneth cell (Lysozyme+ cells in crypt regions) number in Cbl−/− mice and Cblb−/− (H), scale bar = 50 μm. Data are presented as mean ± SEM of 3 independent experiments from counting 50 crypt-villus units for goblet cells and 50 crypts for Paneth cells. Statistical analysis used the student’s two-tailed t test; ∗∗∗; p ≤ 0.001. (K and L) Chromogranin A staining (Red), showed no significant difference in the number of enteroendocrine cells between WT and Cbl−/− mice; scale bar = 50 μm. Data are presented as mean ± SEM of 4 independent experiments. Statistical analysis used the student’s two-tailed t test; ns, p ≤ 0.05, ∗; p ≤ 0.01, ∗∗.
Figure 2
Figure 2
Expansion of the intestinal epithelial progenitor compartment at the expense of stem cells upon inducible Cbl/Cblb double KO in Lgr5+ stem cells (A) Schematic showing the experimental plan followed. Cblflox/flox; Cblb−/−; Lgr5-creERT2; R26-LacZ (iDKO) mice received tamoxifen (TAM) on days 0, 1 and 2 to induce conditional deletion of floxed Cbl alleles in Lgr5+ cells on a Cblb null background. (B and C) Deletion of Cbl was assessed using real-time PCR of FACS-sorted GFP-high and GFP-low vs. GFP-negative epithelial cells at day 5 and day 10 of induction. (D–G) Flow cytometric analysis of live epithelial cells showed a significant expansion of Lgr5-GFP Lo (progenitor) cells and a concomitant decrease in Lgr5-GFP Hi (stem cells) at 5 days (D and E) and 10 days (F and G) after TAM induction in Cbl/Cblb iDKO vs. control mice. Data are represented as mean ± SEM of 4 independent experiments. Statistical analysis using student’s two-tailed t test is shown; ns, p ≤ 0.05, ∗; p ≤ 0.01, ∗∗.
Figure 3
Figure 3
Increased crypt cell proliferation with no change in apoptosis upon Lgr5+ cell-specific Cbl/Cblb iDKO in the intestine (A–D) Control and Cbl/Cblb iDKO mice were injected with BrdU 4 h prior to euthanasia and FFPE sections of intestines were stained for BrdU (Red), GFP (Green) and DAPI (Blue). Quantification of BrdU+ cells within GFP+ crypts showed a significant increase in the fraction of iDKO stem/progenitor cells in S phase of the cell cycle at day 5 (A and B) and day 10 (C and D) of initiating TAM treatment. (E–H) Cleaved caspase 3 (Red) co-immunostaining with GFP (Green) and DAPI (Blue) revealed no significant difference in the number of dead cells between control and iDKO mice at day 5 (E and F) or day 10 (G and H) after initiating TAM treatment. Analyses at each time point were repeated three times. Data are presented as mean ± SEM with statistical analysis using student’s two-tailed t test; ns, p ≤ 0.05, ∗; p ≤ 0.01, ∗∗. Scale bar, 20 mm.
Figure 4
Figure 4
Increased commitment to differentiation upon Lgr5+ cell-specific Cbl/Cblb iDKO in the intestine (A and B) X-Gal staining of intestinal sections at 5 (A) and 10 (B) days post-TAM induction to trace the fate of Lgr5+ ISCs shows an increase in blue progeny in Cbl/Cblb iDKO mice at both time points as compared to control mice; scale bar = 1,000 μm. (C and D) Quantitative analysis of the staining shown in A & B was performed by counting 2,000 crypts per genotype and assessing the number of crypts with a single blue cell or with fully or partially blue crypts. An increase in the percentage of full and partial blue crypts was observed together with a reduction in the percentage of crypts with single blue cells. (E and F) Real-time PCR analysis shows a mis-localization of the quiescent secretory progenitor markers Delta-like 1 (Dll1) (E) and Neurogenin 3 (Ngn3) (F) in GFP Hi and GFP Lo populations in Cbl/Cblb iDKO vs. control mice. (G and H) Enumeration of the number of LacZ+ crypts undergoing fission shows an increase in iDKO mice at 10 days post-TAM induction as compared to control mice. (I) LacZ staining at 4 months post-TAM induction showed comparable staining between control and Cbl/Cblb iDKO mice with no signs of hyperplasia in the latter; scale bar = 400 μm. Analyses at each time point were repeated four times. Data are presented as mean ± SEM with statistics using student’s two-tailed t test. ns, p ≤ 0.05, ∗; p ≤ 0.01, ∗∗.
Figure 5
Figure 5
Cbl/Cblb iDKO mice exhibit delayed recovery from abdominal radiation injury Control and Cbl/Cblb iDKO mice were exposed to CT-based conformal X-ray radiation (14 Gy) focused on the abdomen to assess the ability of intestinal stem/progenitor cells to re-establish epithelial homeostasis post-damage. (A) The schematic shows the experimental plan followed. (B) Histological analysis of H&E-stained sections of different regions of intestine on day 7 post-injury showed hyperproliferating crypts with fission and repopulation of villi in the control mice while Cbl/Cblb iDKO mice showed bare, crypt-less patches and blunted villi with little recovery; representative pictures are shown; scale bar, 200 μm. (C–E) The inability of Cbl/Cblb iDKO mice to regenerate injured intestinal epithelium is associated with a precipitous drop in the Lgr5-Hi stem cell population (C and D) and a mild increase in the Lgr5-Lo progenitors (C and E) analyzed at d5 post-injury. Analysis at each time point was repeated three times. Data are presented as mean ± SEM with statistics using student’s two-tailed t test; ns, p ≤ 0.05, ∗; p ≤ 0.01, ∗∗.
Figure 6
Figure 6
Conditional Cbl/Cblb deletion impairs self-renewal in intestinal crypt organoid cultures by upregulating the Akt-mTOR pathway Equal number of crypts isolated from Cblflox/flox; Cblbflox/flox (FF Control) and Cblflox/flox; Cblbflox/flox; R26creERT2 (FF/creERT) mice were plated in 100% Matrigel in the presence of growth factors to form organoids. Once formed, organoids were replated at a 1:4 split ratio and treatment with 400 nM 4-OH TAM was initiated after 24 h to induce Cbl/Cblb deletion. (A) Bright-field imaging showed that while FF control mouse intestinal organoids exhibited a steady increase in budding (crypt domains) over time (up to 72 h of observation), the FF/creERT mouse organoids showed increased budding until 48 h after 4-OH-TAM induction but rapidly lost crypt domains by 72 h post-induction; scale bar = 40 μm. (B) Representative H&E-stained images of FF control and FF/creERT organoids confirm the loss of morphological features in the latter; scale bar = 50 μm. (C) Ten distinct organoids per genotype were followed up to 72 h and change in the number of buds (crypt domains) at each time point relative to time 0 was quantified. (D) FF Control and FF/creERT organoids grown in 4-OH-TAM for 72 h were re-passaged and imaged after 48 h. Note the lack of organoid structures with intact morphology in FF/creERT organoid cultures, supporting a loss of self-renewal contrary to growth and intact morphology of control organoids; scale bar = 400 μm. (E) Immunoblotting of organoid lysates at different time points confirmed effective Cbl/Cblb deletion by 48 and 72 h time points in FF/creERT organoids. HSC-70, loading control. FF/creERT organoids derived from two independent female mice (2F and 3F) were cultured in the presence (iDKO) or absence (control) of 400 nM 4-hydroxy-TAM for 72 h. Single cells isolated from the organoids were processed through the GemCode Single Cell Platform (10X Genomics) to perform single-cell RNA-seq and analyzed using Seurat. (F) tSNE map of combined controls and combined Cbl/Cblb iDKO mouse organoid cells. Cells are grouped into seven clusters based on transcriptome profiles and are colored accordingly. The cell types were assigned based on gene expression profile of stem cells (Lgr5, Ascl2, Axin2, Olfm4, Gkn3), transit-amplifying (TA) cells (Mki67, Cdk4, Mcm5, Mcm6, Pcna), enterocytes (Alpi, Apoa1, Apoa4, Fabp1), Paneth cells (Lyz1, Defa17, Defa22, Defa24, Ang4), enteroendocrine cells (Chga, Chgb, Tac1, Tph1, Neurog3), goblet cells (Muc2, Tff3, Agr2) and tuft cells (Dclk1, Trpm5, Gfi1b). (G) Heatmap shows the expression levels of top cluster-specific genes in each cluster. Yellow represents the highest expression while purple represents low or no expression. (H) Histogram depicting the percentage of cells in each cluster. (I) Validation of Cbl and Cblb deletion in the 2F and 3F organoids by qPCR. (J) Gene set enrichment analysis (GSEA) of each cell type between control and iDKO organoids shows upregulation the of PI3K-Akt-mTOR signaling pathway upon Cbl/Cblb iDKO in stem cells, goblet cells, enteroendocrine cells, Paneth cells, and enterocytes. NES (normalized enrichment score), FDR (false discovery rate), and p values are indicated in the GSEA plots. (K) To validate the alterations in PI3K-mTOR signaling upon Cbl/Cblb iDKO, organoid lysates were collected at different time points of culture in the presence of 4-OH-TAM and analyzed by immunoblotting for EGFR, p-EGFR, Akt, p-Akt, S6 and p-S6. Clear upregulation of p-AKT/mTOR pathway components (p-Akt and p-S6) is seen and pEGFR upregulation is observed only after 72 h of 4-OH-Tam induction. Hsc-70 served as a loading control. Densitometries of Cbl, Cbl-b, p-EGFR/EGFR, p-Akt/Akt and p-S6/S6 after normalizing to loading control in comparison to FF control sample in each time point are indicated on the top of the immunoblots. (L) Intestinal tissue sections from Control and Cbl/Cblb iDKO mice 10 days after initiating TAM treatment were stained with antibodies against p-S6 to assess the impact of Cbl/Cblb deletion. Sections stained with secondary antibody alone were used as a negative control. p-S6 levels (red in color) were sharply increased in iDKO as compared to control sections; scale bar = 20 μm. Quantified data are presented as mean ± SEM of three independent experiments with statistics using student’s two-tailed t test. ns, not significant; p ≤ 0.05, ∗; p ≤ 0.01, ∗∗; p ≤ 0.001, ∗∗∗.
Figure 7
Figure 7
p-Akt/mTOR pathway inhibition rescues defective maintenance of Cbl/Cblb iDKO intestinal crypt organoids (A) Organoids established from FF/creERT mice carrying the mT/mG dual fluorescent reporter to document gene deletion were treated with 400 nM 4-OH-TAM, without (4-OH-TAM only control) or with Akt inhibitor MK-2206 (250 nM), mTOR inhibitor Rapamycin (10 nM) or their indicated combinations (5 nM Rapamycin plus 125 nM MK-2206 or 10 nM Rapamycin plus 250 nM MK-2206) and imaged at various time points over a 72 h period. While 4-OH-TAM alone treated organoid structures showed the expected disruption of architecture by 72 h, inhibition of Akt, mTOR or their combination rescued the organoid morphology with robust budding. Fluorescent imaging showed successful activation of Cre following TAM treatment under all conditions (conversion from uniform red to uniform green). (B) Quantification of crypt domains showed that Rapamycin by itself or in combination with MK-2206 significantly improved the crypt budding in comparison to TAM alone at 72 h; significant reduction in crypt budding was seen at 24 h, while no differences were seen at 48 h. (C) After 72 h of organoid culture treatments, the 4-OH-TAM treated, 10 nM Rapamycin+4-OH-TAM treated and 10 nM Rapamycin+250nM MK-2206+4-OH-TAM treated organoids (the latter two showing the best rescue) were replated in complete ADF medium and imaged at 48 h after replating. The organoids previously treated with Rapamycin or Rapamycin plus MK-2206 showed robust budding while such structures were absent in secondary cultures of 4-OH-TAM alone treated organoids. (D) Western blot analysis of FF control organoids and FF/creERT organoids at 72 h of treatment showed the expected downregulation of p-Akt, p-S6 or p-S6 + p-Akt levels with 4-OH-TAM+MK-2206, 4-OH-TAM+ Rapamycin or 4-OH-TAM+MK-2206+Rapamycin treatment, respectively, as compared to 4-OH-TAM alone treatment in both FF Control and FF/creERT organoids. Densitometries of p-Akt/Akt and p-S6/S6 after normalizing to loading control in comparison to 4-OH-TAM treated FF control sample are indicated on the top of p-Akt and p-S6 bands. Quantified data are presented as mean ± SEM of three independent experiments with statistics using student’s two-tailed t test. ns, p ≤ 0.05, ∗; p ≤ 0.01, ∗∗.

Update of

Similar articles

Cited by

References

    1. Mele S., Johnson T.K. Receptor Tyrosine Kinases in Development: Insights from Drosophila. Int. J. Mol. Sci. 2019;21:188. - PMC - PubMed
    1. Ramachandra C.J.A., Mehta A., Lua C.H., Chitre A., Ja K.P.M.M., Shim W. ErbB Receptor Tyrosine Kinase: A Molecular Switch Between Cardiac and Neuroectoderm Specification in Human Pluripotent Stem Cells. Stem Cell. 2016;34:2461–2470. - PubMed
    1. Takahashi T., Shiraishi A. Stem Cell Signaling Pathways in the Small Intestine. Int. J. Mol. Sci. 2020;21:2032. - PMC - PubMed
    1. Mohapatra B., Ahmad G., Nadeau S., Zutshi N., An W., Scheffe S., Dong L., Feng D., Goetz B., Arya P., et al. Protein tyrosine kinase regulation by ubiquitination: critical roles of Cbl-family ubiquitin ligases. Biochim. Biophys. Acta. 2013;1833:122–139. - PMC - PubMed
    1. Griffiths E.K., Sanchez O., Mill P., Krawczyk C., Hojilla C.V., Rubin E., Nau M.M., Khokha R., Lipkowitz S., Hui C.C., Penninger J.M. Cbl-3-deficient mice exhibit normal epithelial development. Mol. Cell Biol. 2003;23:7708–7718. - PMC - PubMed