. 2024 May 31;27(6):110156.
doi: 10.1016/j.isci.2024.110156. eCollection 2024 Jun 21.

Single-cell view into the role of microbiota shaping host immunity in the larynx

Affiliations

Single-cell view into the role of microbiota shaping host immunity in the larynx

Ran An et al. iScience. .

Abstract

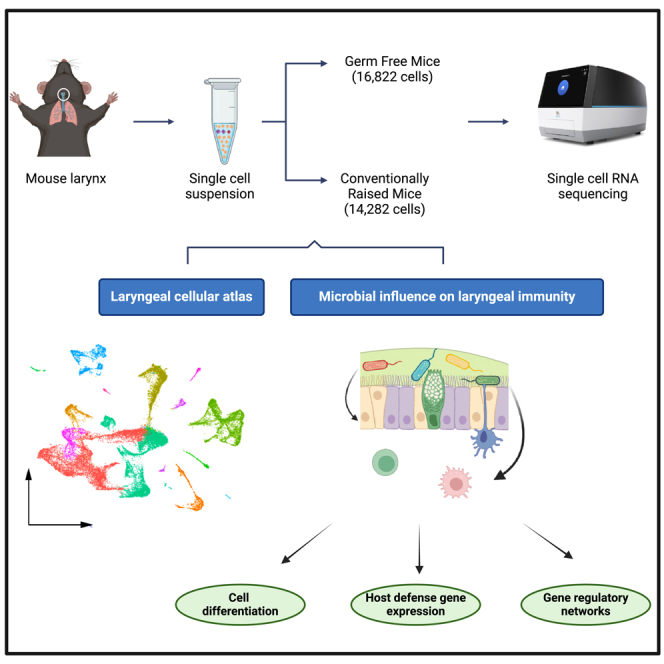
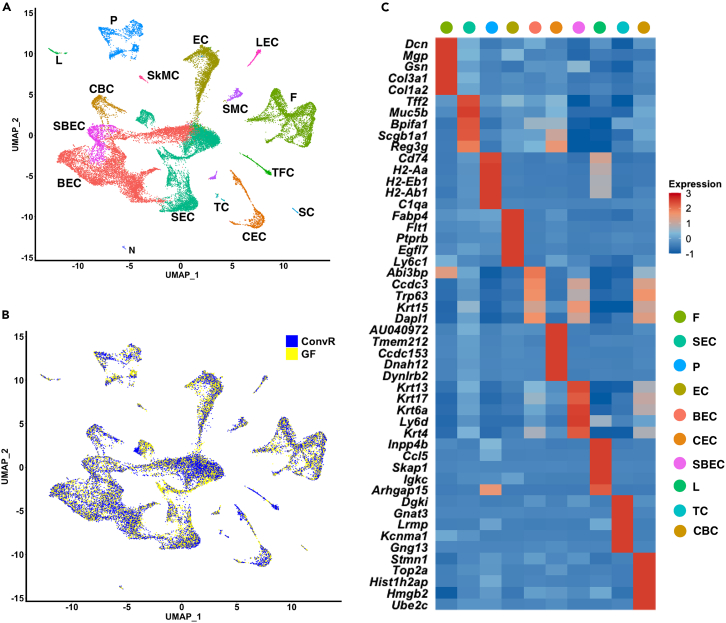
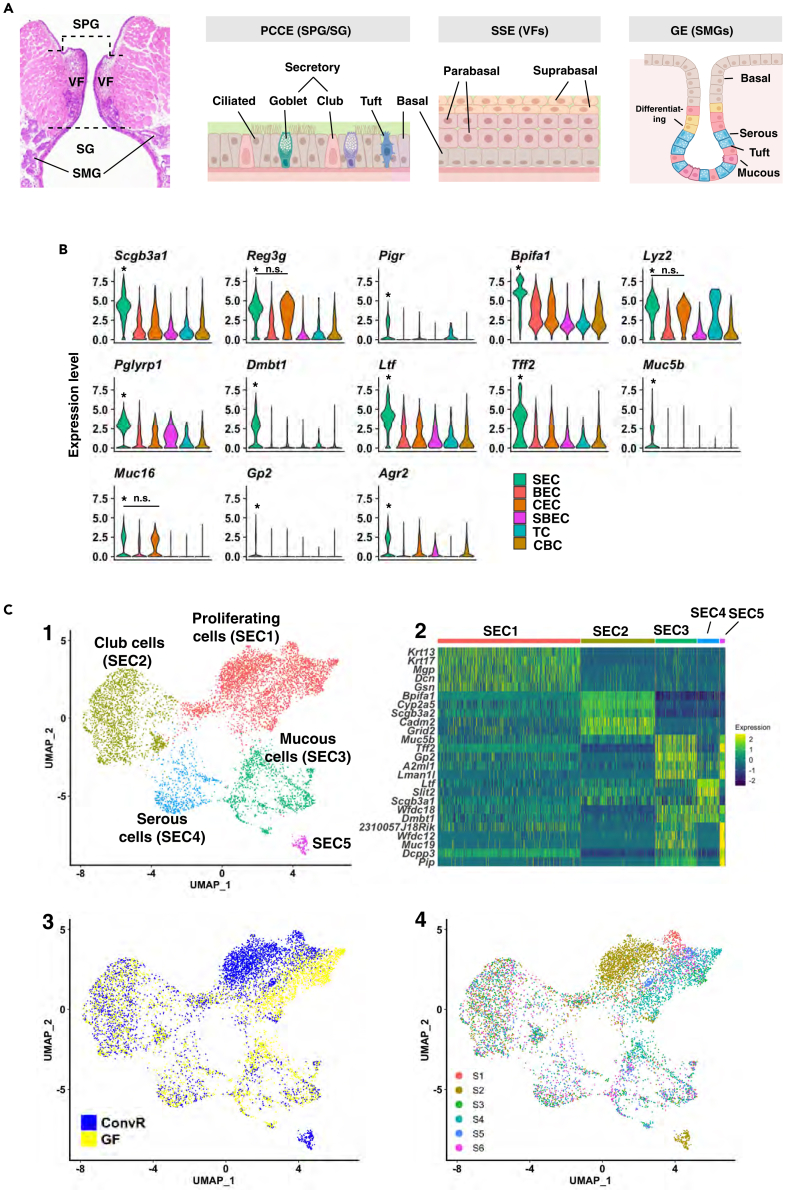
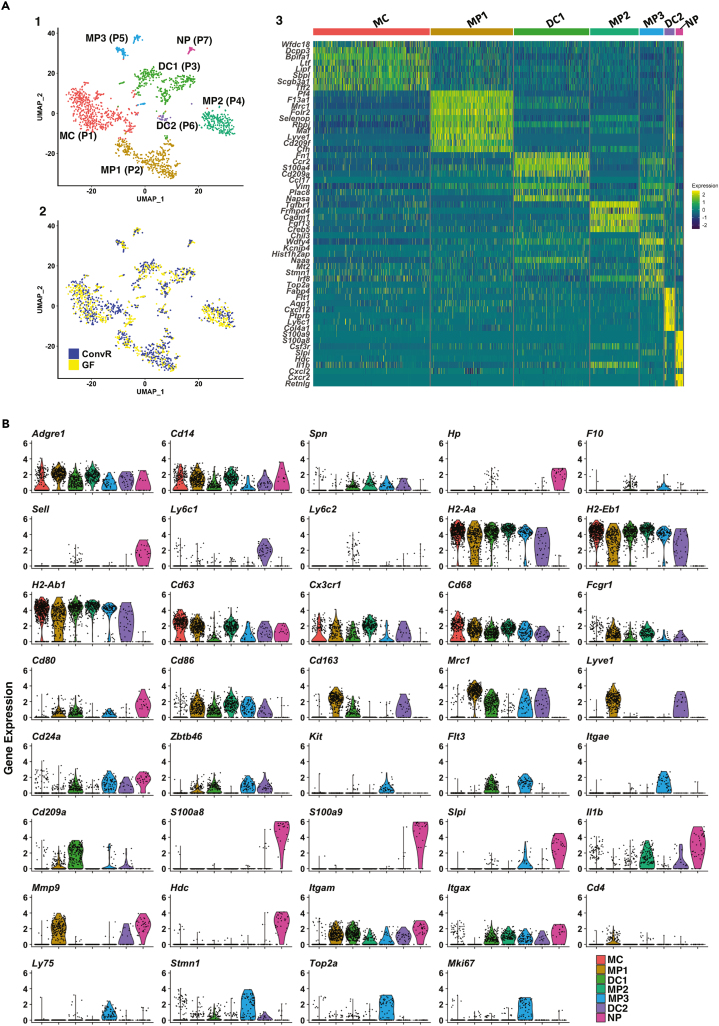
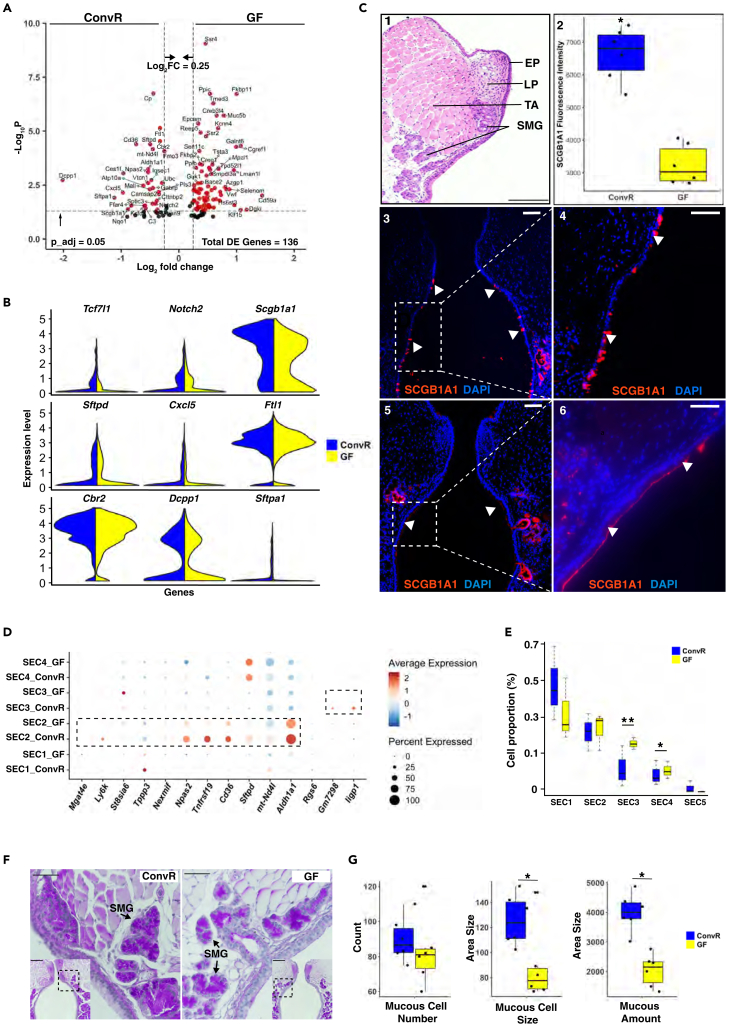
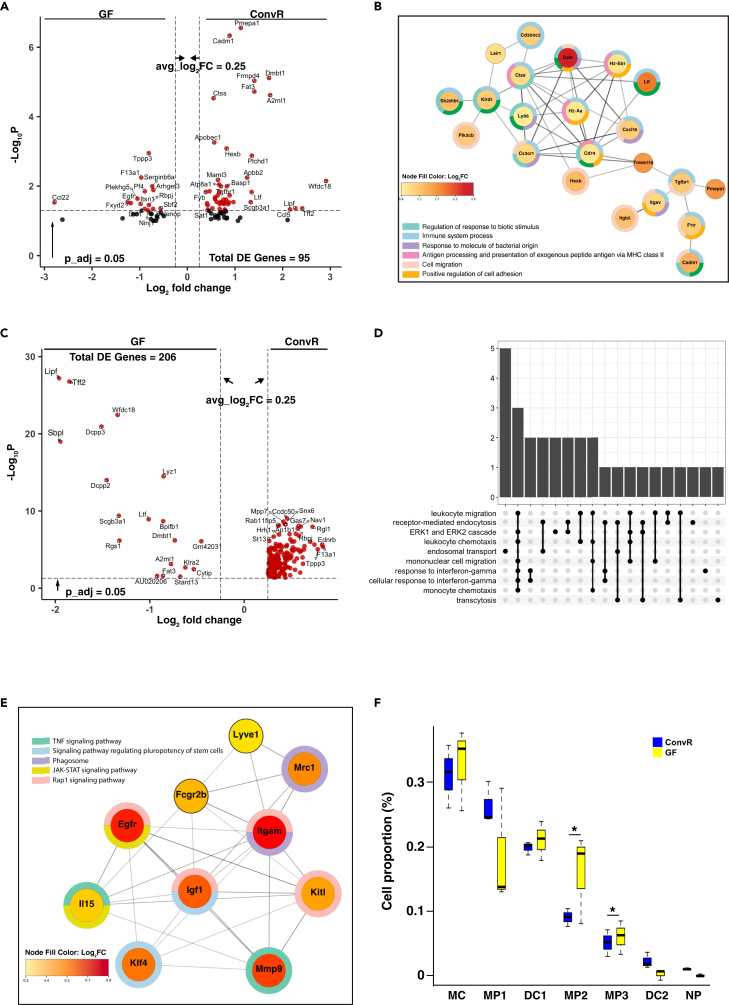
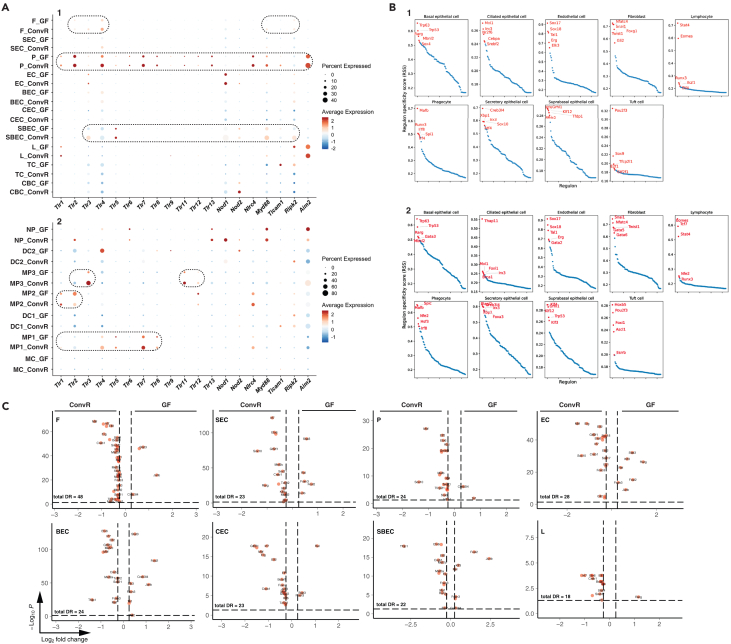
Microbiota play a critical role in the development and training of host innate and adaptive immunity. We present the cellular landscape of the upper airway, specifically the larynx, by establishing a reference single-cell atlas, while dissecting the role of microbiota in cell development and function at single-cell resolution. We highlight the larynx's cellular heterogeneity with the identification of 16 cell types and 34 distinct subclusters. Our data demonstrate that commensal microbiota have extensive impact on the laryngeal immune system by regulating cell differentiation, increasing the expression of genes associated with host defense, and altering gene regulatory networks. We uncover macrophages, innate lymphoid cells, and multiple secretory epithelial cells, whose cell proportions and expressions vary with microbial exposure. These cell types play pivotal roles in maintaining laryngeal and upper airway health and provide specific guidance into understanding the mechanism of immune system regulation by microbiota in laryngeal health and disease.

Keywords: Immunity; Microbiome; Transcriptomics.


Conflict of interest statement

The authors declare no competing interests.

Figures

None
Graphical abstract
Figure 1
Figure 1
Laryngeal cell types in ConvR and GF mice (A and B) UMAP plots of 15 laryngeal cell types found in ConvR and GF merged (A) and ConvR and GF mice (B). F, SEC, P, EC, BEC, CEC, SBEC, L, TC, CBC, LEC, SkMC, SMC, TFC, N, and SC represent fibroblast, secretory epithelial cell, phagocyte, endothelial cell, basal epithelial cell, ciliated epithelial cell, suprabasal epithelial cell, lymphocyte, tuft cell, cycling basal cell, lymphatic endothelial cell, skeletal muscle cell, smooth muscle cell, thyroid follicular cell, neuron, and Schwann cell, respectively. (C) Averaged gene expression heatmap of top 5 differentially expressed (DE) genes in the larynx, ranked by average log2 fold change for each major cell type for merged dataset. Color scale: red, high expression; blue, low expression. F, SEC, P, EC, BEC, CEC, SBEC, L, TC, and CBC represent fibroblast, secretory epithelial cell, phagocyte, endothelial cell, basal epithelial cell, ciliated epithelial cell, suprabasal epithelial cell, lymphocyte, tuft cell, and cycling basal cell, respectively.
Figure 2
Figure 2
Epithelial cell heterogeneity in the mouse larynx (A) Scheme of distribution of epithelial cell types in the coronal section of vocal folds. GE, SMGs, SPG, VF, SG, PCCE, and SSE represent glandular epithelium, submucosal glands, supraglottis, vocal folds, subglottis, pseudostratified columnar ciliated epithelium, and stratified squamous epithelium, respectively. (B) Expression of antimicrobial and mucus related genes across four epithelial cell types. Asterisk indicates statistical significance of DE genes across cell types (average log2 fold change >0.25, adjusted p-value <0.05), unless specified as non-significant (n.s.) between designated cell types, for merged data. SEC, BEC, CEC, SBEC, TC, and CBC represent secretory epithelial cell, basal epithelial cell, ciliated epithelial cell, suprabasal epithelial cell, tuft cell, and cycling basal cell, respectively. (C) 1) UMAPs of SEC subtypes identified in merged data; 2) Gene expression heatmap of top 5 differentially expressed (DE) genes (ranked by average log2 fold change) in each SEC subtype; 3) & 4) SEC subtype distribution across mouse groups (3) and biological replicates (4). SEC1-SEC5 represent secretory epithelial cell subtype 1–5. S1-S6 represent ConvR1, ConvR2, GF1, GF2, ConvR3, and GF3 samples, respectively.
Figure 3
Figure 3
Phagocyte heterogeneity in the mouse larynx (A) 1) & 2) UMAPs of the distribution of phagocyte subtypes in merged dataset (1) and across mouse groups (2); 3) Expression heatmap of phagocyte subtype markers based on top 5 differentially expressed (DE) genes (ranked by average log2 fold change) in merged dataset. MC, MP1-3, DC1-2, and NP represent monocyte, macrophage subtype 1–3, dendritic cell subtype 1–2, and neutrophil, respectively. P1-P7 represent phagocyte subtype 1–7. (B) Violin plots of phagocyte canonical markers across subtypes in merged dataset. MC, DC, MP, and NP represent monocyte, dendritic cell, macrophage, and neutrophil, respectively.
Figure 4
Figure 4
Secretory Epithelial Cell (SEC) differential gene expression in ConvR and GF mice larynges (A) Volcano plot of differentially expressed (DE) genes in SEC of ConvR and GF mouse larynges (average log2 fold change >0.25, adjusted p-value <0.05). (B) Expression of host defense associated DE genes in SEC of ConvR versus GF larynges (average log2 fold change >0.25, adjusted p-value <0.05). (C) Antibody staining of SCGB1A1 in paraffin-embedded vocal fold coronal sections for ConvR and GF mice. 1) Hematoxylin and Eosin stained vocal fold coronal sections demonstrating morphology of vocal fold (VF) mucosa; EP, LP, TA, and SMG represent epithelium, lamina propria, thyroarytenoid muscle, and submucosal glands, respectively; 2) Quantification of SCGB1A1 fluorescence intensity in immunostained images; Asterisk indicates that SCGB1A1 fluorescence intensity was significantly higher in ConvR based on a two tailed t-test with equal variance (p-value <0.05); the horizontal black line in the center of the box represents the median value, the top and bottom whiskers represent maximum and minimum value, the upper and lower lines of the box represent the upper and lower quartile values; confidence interval 95%; 3) & 4) Antibody staining of SCGB1A1 in ConvR (3) and GF (4) vocal folds; 5) & 6) Magnification of the regions in white dotted rectangles in panels 3) and 4). SCGB1A1 protein and DAPI (nucleus) were stained in red and blue, respectively. Scale bar in 1 = 250 μm; scale bars in panels 3 and 4 = 500 μm; scale bars in panels 5 and 6 = 100 μm; white arrows indicate the location of cells with high SCGB1A1 protein expression; white dotted rectangles indicate the magnified regions in 5) and 6). (D) Dotplot of DE genes between ConvR and GF larynges for SEC subtypes. SEC1-SEC4 represent SEC subtypes 1–4. Genes upregulated in each subtype of ConvR mice were framed in dotted rectangles. Color scale - red, high expression; blue, low expression. (E) Proportions of SEC subtypes (SEC1-SEC5) in ConvR and GF larynges. Asterisk indicates significant difference in cell proportion between ConvR and GF according to scCODA analysis at FDR = 0.1 (∗∗) and FDR = 0.3 (∗). The horizontal black line in the center of the box represents the median value, the top and bottom whiskers represent maximum and minimum value, the upper and lower lines of the box represent the upper and lower quartile values; confidence interval 95%. (F) Periodic acid – Schiff staining of mucus and mucus producing cells in paraffin-embedded sections of ConvR (left) and GF (right) mouse larynx (magnification = 40x); scale bar = 500 μm. Black dotted rectangles indicate zoomed-in regions with higher magnification; magnification in zoomed-out images = 20x, scale bar = 500 μm. Black arrows denote submucosal glands (SMG). (G) Quantification of mucous cell number, size, and mucus amount in submucosal glands; asterisk indicates significant difference between mouse groups according to a two-tailed Student’s t test with equal variance (p-value <0.05). The horizontal black line in the center of the box represents the median value, the top and bottom whiskers represent maximum and minimum value, the upper and lower lines of the box represent the upper and lower quartile values; confidence interval 95%.
Figure 5
Figure 5
Functional analysis of differentially expressed (DE) genes in macrophages of ConvR mice larynges (A) Volcano plots of DE genes in phagocytes between ConvR and GF mouse groups (average log2 fold change >0.25, adjusted p-value <0.05). (B) Largest protein-protein interaction (PPI) network found among the DE genes of phagocytes significantly upregulated in ConvR larynges. GO biological process-based enrichment analysis of the StringDB PPI revealed 6 significantly enriched biological processes shown as split donut of different colors enclosing nodes. Each node represents a gene. Black line linking two nodes represents the known or predicted interaction between the two genes. Color of a node indicate average log2 fold change of the gene. (C) Volcano plots of DE genes in combined macrophage subsets (P2,4,5) between ConvR and GF mice groups (average log2 fold change >0.25, adjusted p-value <0.05). (D) Upset plot of top 10 enriched terms for macrophages in ConvR mice based on their top 50 DE genes (average log2 fold change >0.25, adjusted p < 0.05). Gray bars indicate the number of genes associated with GO terms; black connected dots indicate the associated GO terms. (E) Top 10 PPI hub genes identified by the Maximal Clique Centrality algorithm using cytoHubba plugin of Cytoscape software, demonstrating the most interactive 10 genes found within the DE genes upregulated in macrophages of ConvR larynges. KEGG pathway-based enrichment analysis of the StringDB PPI revealed 5 innate inflammation associated pathways as indicated by split donut of different colors enclosing nodes. Each node represents a gene. Black line linking two nodes represents the known or predicted interaction between the two genes. Color of a node indicate average log2 fold change of the gene. (F) Comparison of macrophage subtype proportions between ConvR and GF mice; asterisk indicate significant difference in cell proportion between mouse groups based on scCODA analysis (FDR = 0.4). The horizontal black line in the center of the box represents the median value, the top and bottom whiskers represent maximum and minimum value, the upper and lower lines of the box represent the upper and lower quartile values; confidence interval 95%.
Figure 6
Figure 6
Expression of pattern recognition receptors (PRRs) and their adapters and regulon activity in ConvR and GF mice larynges (A) Dotplot of average expression of PRRs and their adapters across major cell types of ConvR and GF mice larynges. Dot size represent the percent of cells expressed in a cell type; Color scale: red, high expression; blue, low expression. Genes that have higher average expression in ConvR were framed in dotted rounded rectangles. (B) Dotplot of top 5 regulon in major laryngeal cell types of ConvR (top) and GF (bottom) ranked by regulon specificity score (RSS). (C) Volcano plot of significant differentially expressed regulons in major laryngeal cell types of ConvR and GF mice (average log2 fold change >0.25, adjusted p-value <0.05). F, SEC, P, EC, BEC, CEC, SBEC, and L represent fibroblast, secretory epithelial cell, phagocyte, endothelial cell, basal epithelial cell, ciliated epithelial cell, suprabasal epithelial cell, and lymphocyte, respectively.

Similar articles

Cited by

References

    1. Levendoski E.E., Leydon C., Thibeault S.L. Vocal Fold Epithelial Barrier in Health and Injury: A Research Review. J. Speech Lang. Hear. Res. 2014;57:1679–1691. doi: 10.1044/2014_JSLHR-S-13-0283. - DOI - PMC - PubMed
    1. Bhattacharyya N. The prevalence of voice problems among adults in the United States. Laryngoscope. 2014;124:2359–2362. doi: 10.1002/LARY.24740. - DOI - PubMed
    1. Cohen S.M., Kim J., Roy N., Asche C., Courey M. Direct health care costs of laryngeal diseases and disorders. Laryngoscope. 2012;122:1582–1588. doi: 10.1002/LARY.23189. - DOI - PubMed
    1. Belkaid Y., Hand T.W. Role of the microbiota in immunity and inflammation. Cell. 2014;157:121–141. doi: 10.1016/j.cell.2014.03.011. - DOI - PMC - PubMed
    1. Thibeault S.L., Rees L., Pazmany L., Birchall M.A. At the crossroads: Mucosal immunology of the larynx. Mucosal Immunol. 2009;2:122–128. doi: 10.1038/mi.2008.82. - DOI - PMC - PubMed

LinkOut - more resources