. 2024 May 28;27(6):110138.
doi: 10.1016/j.isci.2024.110138. eCollection 2024 Jun 21.

Evolution of protective SARS-CoV-2-specific B and T cell responses upon vaccination and Omicron breakthrough infection

Affiliations

Evolution of protective SARS-CoV-2-specific B and T cell responses upon vaccination and Omicron breakthrough infection

Mohamed I M Ahmed et al. iScience. .

Abstract

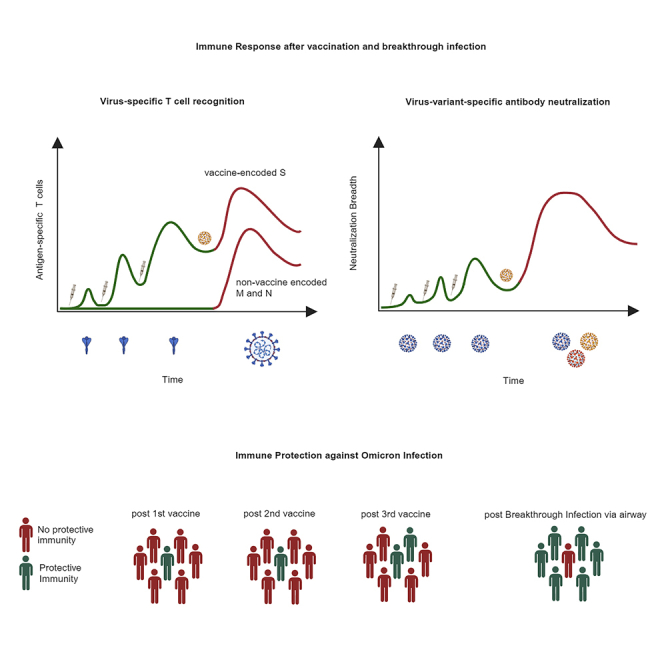
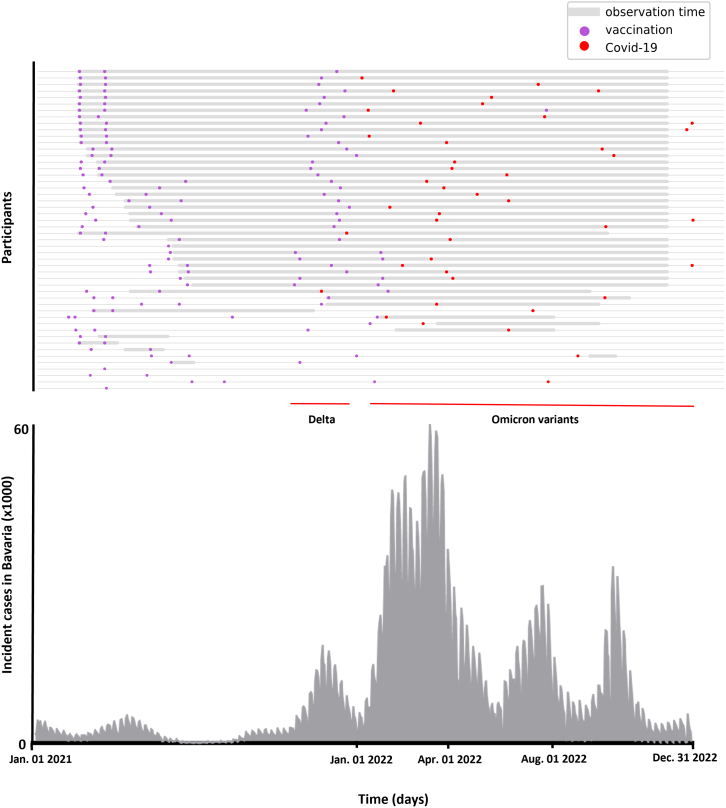
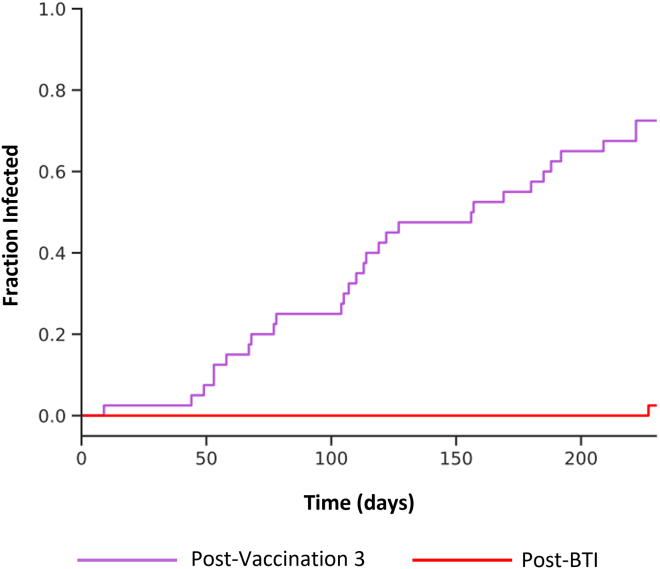
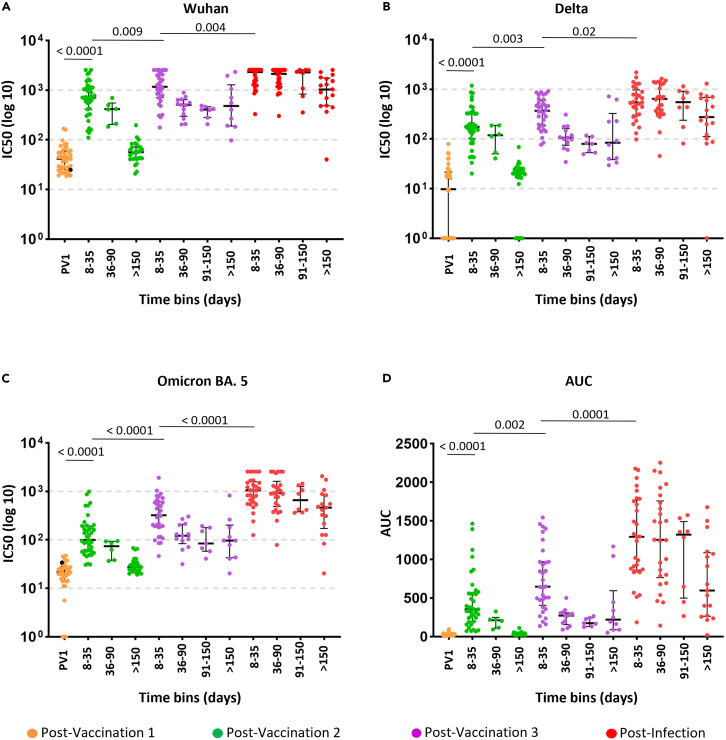
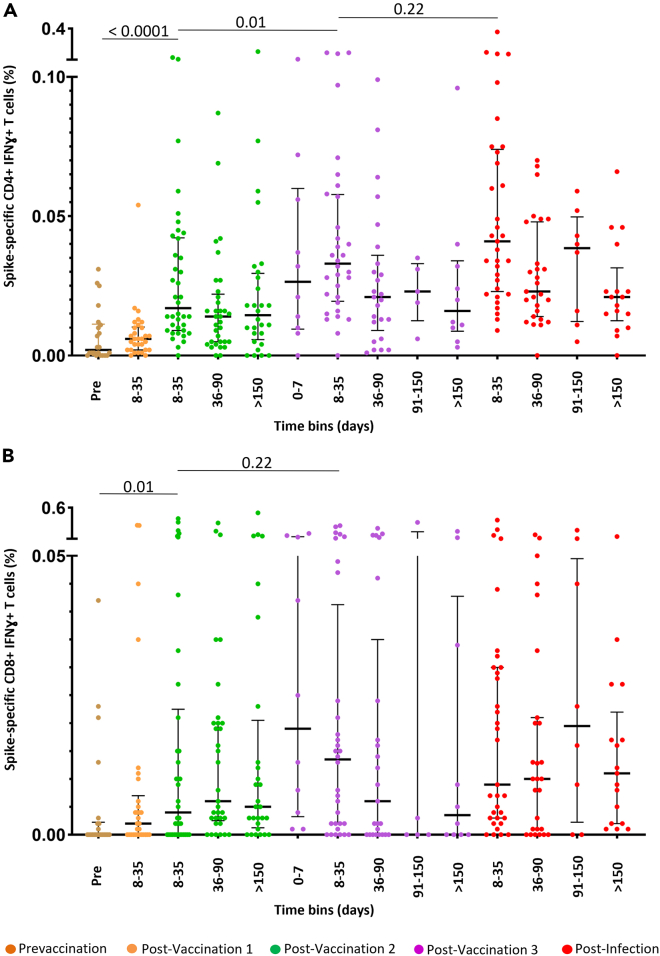
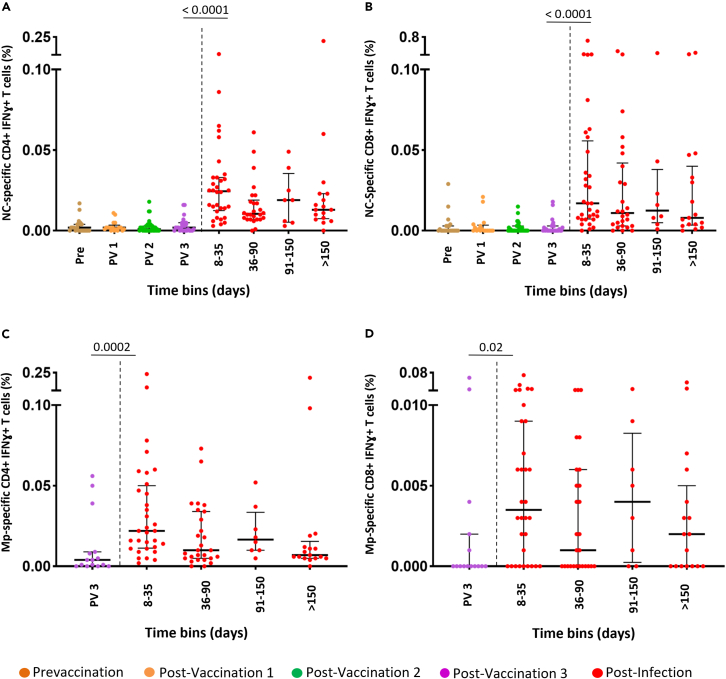
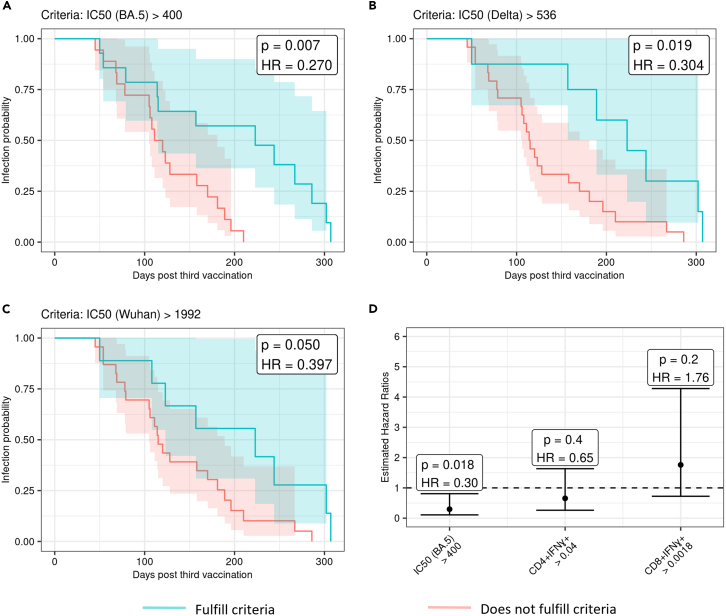
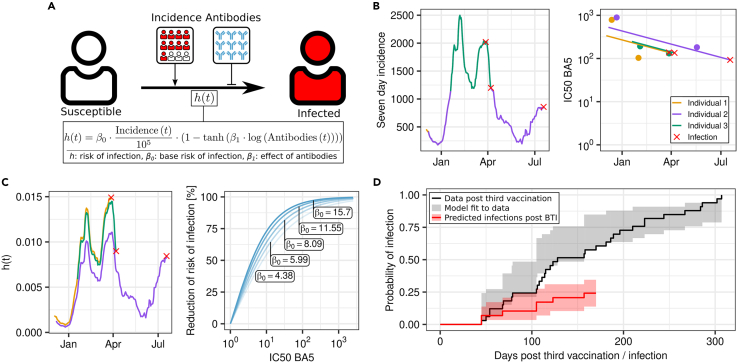
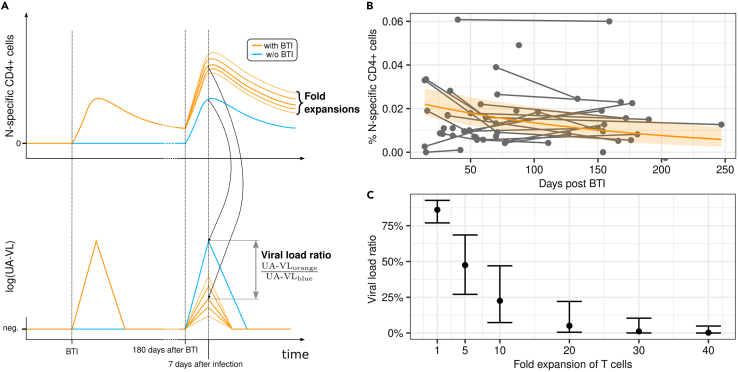
Severe acute respiratory syndrome coronavirus 2 (SARS-CoV-2) Omicron breakthrough infection (BTI) induced better protection than triple vaccination. To address the underlying immunological mechanisms, we studied antibody and T cell response dynamics during vaccination and after BTI. Each vaccination significantly increased peak neutralization titers with simultaneous increases in circulating spike-specific T cell frequencies. Neutralization titers significantly associated with a reduced hazard rate for SARS-CoV-2 infection. Yet, 97% of triple vaccinees became SARS-CoV-2 infected. BTI further boosted neutralization magnitude and breadth, broadened virus-specific T cell responses to non-vaccine-encoded antigens, and protected with an efficiency of 88% from further infections by December 2022. This effect was then assessed by utilizing mathematical modeling, which accounted for time-dependent infection risk, the antibody, and T cell concentration at any time point after BTI. Our findings suggest that cross-variant protective hybrid immunity induced by vaccination and BTI was an important contributor to the reduced virus transmission observed in Bavaria in late 2022 and thereafter.

Keywords: immunology; microbiology; virology.


Conflict of interest statement

The authors declare no competing interests.

Figures

None
Graphical abstract
Figure 1
Figure 1
Overview of the study observation period, vaccination, and infection events for each study participant Each line represents events for one participant from February 2021 until December 2022. The thicker gray lines indicate the study observation period, where there was active blood sampling, with vaccination dates (purple) and SARS-CoV-2 infection dates (red) indicated by dots (upper panel). SARS-CoV-2 incidence (x1000) in the study area (Bavaria, Germany) plotted over time (lower panel) for the same time period, with the delta and omicron waves indicated (www.lgl.bayern.de). A flowchart of the blood sampling process is shown in Figure S7.
Figure 2
Figure 2
Cumulative incidence of SARS-CoV-2 infections after 3 vaccinations and after breakthrough infection Kaplan-Meier survival analysis of incident (re-)infections was performed for 230 days after receiving the third vaccine dose (purple line, n = 32) and after the first BTI (red line, n = 18). Only subjects who have been observed for at least 230 days post 3rd vaccination or BTI were included in the plot. The limit of 230 days shown in the figure was set to retain sufficient number of subjects in the BTI group. Until 31st of December 2022, an additional 13 incident infections after third vaccination and 3 re-infections in the BTI group were recorded after 230 days and are not shown.
Figure 3
Figure 3
Dynamics of antibody neutralization during vaccination and after breakthrough infection Neutralization was tested for original Wuhan (A), Delta (B), and Omicron BA.5 (C) strains using a lentiviral pseudovirus neutralization assay at post-vaccination 1 (PV1, orange), post-vaccination 2 (green), post-vaccination 3 (purple), and BTI (red). The area under the curve (AUC) was calculated for the neutralization of the three variants to determine the neutralization breadth for each time point (D). If multiple samples were available within one time frame, the highest IC50 value was reported for the peak response at 8–35 days after vaccination or infection. For the other time points, a mean IC50 value was calculated if more than one data point was present. The upper limit of detection was an IC50 value of 2,560, while the lower cutoff was 20. Statistical analyses were performed using the Mann-Whitney test. Median values, interquartile range, and p values below 0.05 are indicated.
Figure 4
Figure 4
Dynamics of SARS-CoV-2-specific T cell responses against vaccine-encoded spike protein The frequency of S-specific IFNɣ+ CD4+ (A) and CD8+ (B) T cells before vaccination (Pre, brown), post-vaccination 1 (orange), post-vaccination 2 (green), post-vaccination 3 (purple), and after BTI (red). The time bins after each vaccination and BTI are shown on the x axis. The median and interquartile range are shown; whiskers extend up to the last point inside 1.5 × (IQ3–IQ1) range (Tukey definition). The Mann-Whitney test was used for statistical analyses. p values below 0.05 are indicated.
Figure 5
Figure 5
Dynamics of SARS-CoV-2-specific T cell responses against non-vaccine-encoded antigens The frequency of N-specific IFNɣ+ CD4+ (A) and CD8+ (B) and membrane-specific IFNɣ+ CD4+ (C) and CD8+ (D) T cells before vaccination (Pre, brown), post-vaccination 1 (PV1, orange), post-vaccination 2 (PV2, green), post-vaccination 3 (PV3, purple), and after BTI (red). The time bins after each vaccination and BTI are shown on the x axis. The median and interquartile range are shown; whiskers extend up to the last point inside 1.5∗(IQ3–IQ1) range (Tukey definition). The Mann-Whitney test was used for statistical analyses. p values below 0.05 are indicated.
Figure 6
Figure 6
Survival analysis of infections in triple-vaccinated participants in relation to neutralizing antibody The estimated survival probability after three vaccinations (n = 32) depending on the level of antibodies between day 8 and 35 after the vaccination for those above (green) and those below (red) the IC50 cutoff are shown for Omicron BA.5 (A), Delta (B), and the original Wuhan strain (C). The respective cutoff criteria are indicated above each graph. Events are BTI and time is measured in days after vaccination. (D) Displays the corresponding hazard ratios and confidence intervals estimated from a Cox regression model.
Figure 7
Figure 7
Reduction of infection risk through neutralizing antibodies A schematic representation of the model with a susceptible person (S) that becomes infected (I) is shown in (A). This model shows the risk of infection (h(t)), which is dependent on the seven-day incidence per 100,000 inhabitants in Munich (Incidence(t)) and the neutralizing antibody titers (Antibodies(t)), where a high incidence increases the infection risk (h(t)) and vice versa for the antibodies. Different parameter values for the Omicron variant baseline infection risk β0 were obtained from literature.,,, The effect of the antibodies is represented by β1 and was estimated from the data of this study. The current seven-day incidence in Munich (B, left panel) and IC50 neutralizing antibody titers (B, right panel) are shown for three representative individuals after their third vaccination until the time of infection. The antibody level is estimated from a linear mixed-effects model. The hazard rate for the different individuals is shown in (C) (left panel) for β0 ≈ 11.55 and β1 ≈ 0.36. Different base infection risk parameters were utilized to present the reduction in the infection risk via the IC50 antibody neutralizing titers (C, right panel). In (D), we show the distribution of infections from data of this study (black line), our model fit to the data (gray shaded area), and results of a simulation study in which individuals become infected after their BTI (red). Given our estimate of β0 and β1 from (C, left panel), seven-day incidence in Munich and measurements of antibody levels after BTI, samples were drawn from the estimated cumulative distribution function after BTI up to 180 days after infection (limit of reported incidence at time of analysis). The shaded areas indicate the 2.5%–97.5% simulation quantiles. The red solid line indicates the media simulation values.
Figure 8
Figure 8
Theoretical reduction of viral load through pre-existing nucleocapsid-specific CD4+IFNɣ+ T cells (A) shows theoretical trajectories of N-specific CD4+IFNɣ+ T cells and upper airway viral (UA-VL) load after BTI and after an additional infection at 180 days after BTI. Trajectory of an individual who experienced a BTI (orange) and who has not experienced the BTI (blue); both are subsequently infected at 180 days after BTI time point. Measured nucleocapsid CD4+IFNɣ+ T cells after BTI with a fitted exponential decay model are displayed in (B, orange line). The orange-shaded area represents the 95% confidence interval for the estimated fixed effect parameters. Using the level of N-specific CD4+IFNɣ+ T cells at 180 days after BTI and different cell expansion factors, we can estimate the approximate T cell level at 7 days after secondary infection and compare it to measurements from individuals without previous infection. The difference (displayed as a ratio) in viral load of individuals with and without pre-existing T cells derived from a linear mixed-effects model based on Eser et al. is shown in (C).

References

    1. Flechsler J., Eberle U., Dangel A., Hepner S., Wimmer C., Lutmayr J., Konrad R., Berger C., Weise L., Sprenger A., et al. Molecular SARS-CoV-2 surveillance in Bavaria shows no Omicron transmission before the end of November 2021. Infection. 2022;50:761–766. doi: 10.1007/s15010-022-01767-1. - DOI - PMC - PubMed
    1. Taylor L. Covid-19: Omicron drives weekly record high in global infections. BMJ. 2022;376 doi: 10.1136/bmj.o66. - DOI - PubMed
    1. Maier B.F., Wiedermann M., Burdinski A., Klamser P.P., Jenny M.A., Betsch C., Brockmann D. Germany's fourth COVID-19 wave was mainly driven by the unvaccinated. Commun. Med. 2022;2:116. doi: 10.1038/s43856-022-00176-7. - DOI - PMC - PubMed
    1. Varianten bei COVID-19 Patienten in Bayern. 2022. https://www.bay-voc.lmu.de/surveillance.xhtml
    1. Petrone D., Mateo-Urdiales A., Sacco C., Riccardo F., Bella A., Ambrosio L., Lo Presti A., Di Martino A., Ceccarelli E., Del Manso M., et al. Reduction of the risk of severe COVID-19 due to Omicron compared to Delta variant in Italy (November 2021 - February 2022) Int. J. Infect. Dis. 2023;129:135–141. doi: 10.1016/j.ijid.2023.01.027. - DOI - PMC - PubMed

LinkOut - more resources