

Pro-inflammatory diets promote the formation of hyperuricemia
- PMID: 38974578
- PMCID: PMC11224156
- DOI: 10.3389/fendo.2024.1398917
Pro-inflammatory diets promote the formation of hyperuricemia
Abstract
Background: Hyperuricemia, as a very prevalent chronic metabolic disease with increasing prevalence year by year, poses a significant burden on individual patients as well as on the global health care and disease burden, and there is growing evidence that it is associated with other underlying diseases such as hypertension and cardiovascular disease. The association between hyperuricemia and dietary inflammatory index (DII) scores was investigated in this study.
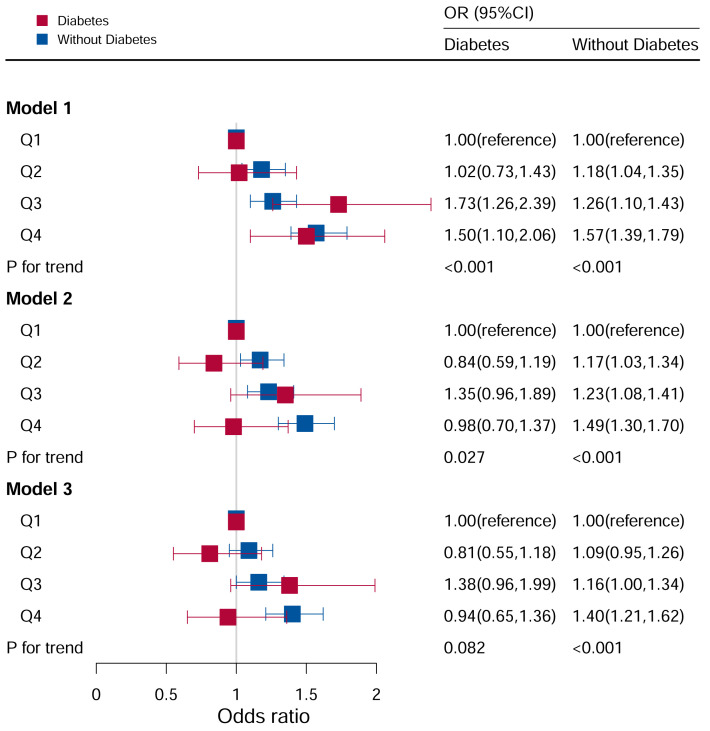
Methods: This study enrolled 13, 040 adult subjects (aged ≥ 20 years) from the US National Health and Nutrition Survey from 2003 to 2018. The inflammatory potential of the diet was assessed by the DII score, and logistic regression was performed to evaluate the relationship between the DII score and the development of hyperuricemia; subgroup analyses were used to discuss the influence of other factors on the relationship.
Results: Participants in the other quartiles had an increased risk of hyperuricemia compared to those in the lowest quartile of DII scores. Stratification analyses stratified by body mass index (BMI), sex, hypertension, drinking, diabetes, education level and albumin-creatinine-ratio (ACR) revealed that the DII score was also associated with the risk of hyperuricemia (P<0.05). There was an interaction in subgroup analysis stratified by sex, age, and hypertension (P for interaction <0.05). The results showed a linear-like relationship between DII and hyperuricemia, with a relatively low risk of developing hyperuricemia at lower DII scores and an increased risk of developing hyperuricemia as DII scores increased.
Conclusions: This study showed that the risk of hyperuricemia increased at slightly higher DII scores (i.e., with pro-inflammatory diets), but not significantly at lower levels (i.e., with anti-inflammatory diets). The contribution of the DII score to the development of hyperuricemia increased with higher scores. The relationship between inflammatory diets and hyperuricemia requires more research on inflammation, and this study alerts the public that pro-inflammatory diets may increase the risk of developing hyperuricemia.
Keywords: NHANES; diabetes; dietary inflammatory index; drinking; hypertension; hyperuricemia.
Copyright © 2024 Liu, Chen, Gao, Shi, Yin, Yu and Zhang.
Conflict of interest statement
The authors declare that the research was conducted in the absence of any commercial or financial relationships that could be construed as a potential conflict of interest.
Figures


Similar articles
-
Dietary Inflammatory Index and the Risk of Hyperuricemia: A Cross-Sectional Study in Chinese Adult Residents.Nutrients. 2021 Dec 16;13(12):4504. doi: 10.3390/nu13124504. Nutrients. 2021. PMID: 34960057 Free PMC article.
-
Greater Dietary Inflammatory Index score is associated with higher likelihood of chronic kidney disease.Br J Nutr. 2018 Jul;120(2):204-209. doi: 10.1017/S0007114518001071. Br J Nutr. 2018. PMID: 29947319
-
The correlation between dietary inflammatory index and risk of hyperuricemia in the U.S. population.Medicine (Baltimore). 2023 May 19;102(20):e33374. doi: 10.1097/MD.0000000000033374. Medicine (Baltimore). 2023. PMID: 37335705 Free PMC article.
-
Demographic risk factors of pro-inflammatory diet: a narrative review.Front Nutr. 2024 Oct 17;11:1448806. doi: 10.3389/fnut.2024.1448806. eCollection 2024. Front Nutr. 2024. PMID: 39483779 Free PMC article. Review.
-
What is the link between the dietary inflammatory index and the gut microbiome? A systematic review.Eur J Nutr. 2024 Oct;63(7):2407-2419. doi: 10.1007/s00394-024-03470-3. Epub 2024 Jul 28. Eur J Nutr. 2024. PMID: 39069586
Cited by
-
Soy Protein and Safflower-Seed Oil Attenuate Inflammation and Immune Dysfunction in Rats with Hyperuricemia.Int J Mol Sci. 2024 Dec 3;25(23):12977. doi: 10.3390/ijms252312977. Int J Mol Sci. 2024. PMID: 39684690 Free PMC article.
-
Association between the dietary inflammatory index and allergic rhinitis results from the National health and nutrition examination survey (2005-2006).J Health Popul Nutr. 2025 May 29;44(1):179. doi: 10.1186/s41043-025-00932-0. J Health Popul Nutr. 2025. PMID: 40442763 Free PMC article.
-
The relationship between dietary index for gut microbiota and hyperuricemia: a cross-sectional study using NHANES data.Front Nutr. 2025 May 26;12:1580122. doi: 10.3389/fnut.2025.1580122. eCollection 2025. Front Nutr. 2025. PMID: 40491589 Free PMC article.
-
Innovative modeling: a diet-induced quail model for progressive pathological changes in uric acid metabolism disorders.Front Nutr. 2025 Jul 23;12:1612479. doi: 10.3389/fnut.2025.1612479. eCollection 2025. Front Nutr. 2025. PMID: 40771212 Free PMC article.
-
Meat-Carbohydrate Dietary Pattern and Elevated Serum Uric Acid in Children and Adolescents: Mediating Role of Obesity in a Cross-Sectional Study.Nutrients. 2025 Jun 24;17(13):2090. doi: 10.3390/nu17132090. Nutrients. 2025. PMID: 40647195 Free PMC article.
References
MeSH terms
Substances
LinkOut - more resources
Full Text Sources