. 2024 Jun 3;35(3):102234.
doi: 10.1016/j.omtn.2024.102234. eCollection 2024 Sep 10.

CircHTT(2,3,4,5,6) - co-evolving with the HTT CAG-repeat tract - modulates Huntington's disease phenotypes

Affiliations

CircHTT(2,3,4,5,6) - co-evolving with the HTT CAG-repeat tract - modulates Huntington's disease phenotypes

Jasmin Morandell et al. Mol Ther Nucleic Acids. .

Abstract

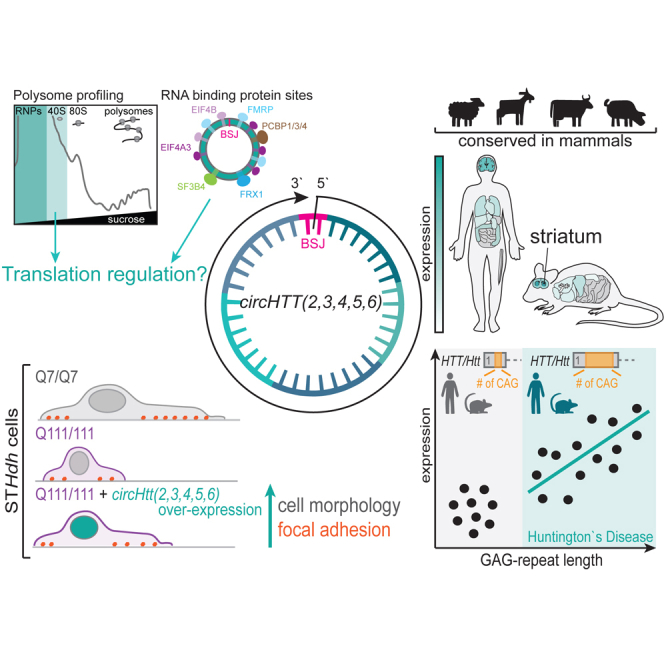
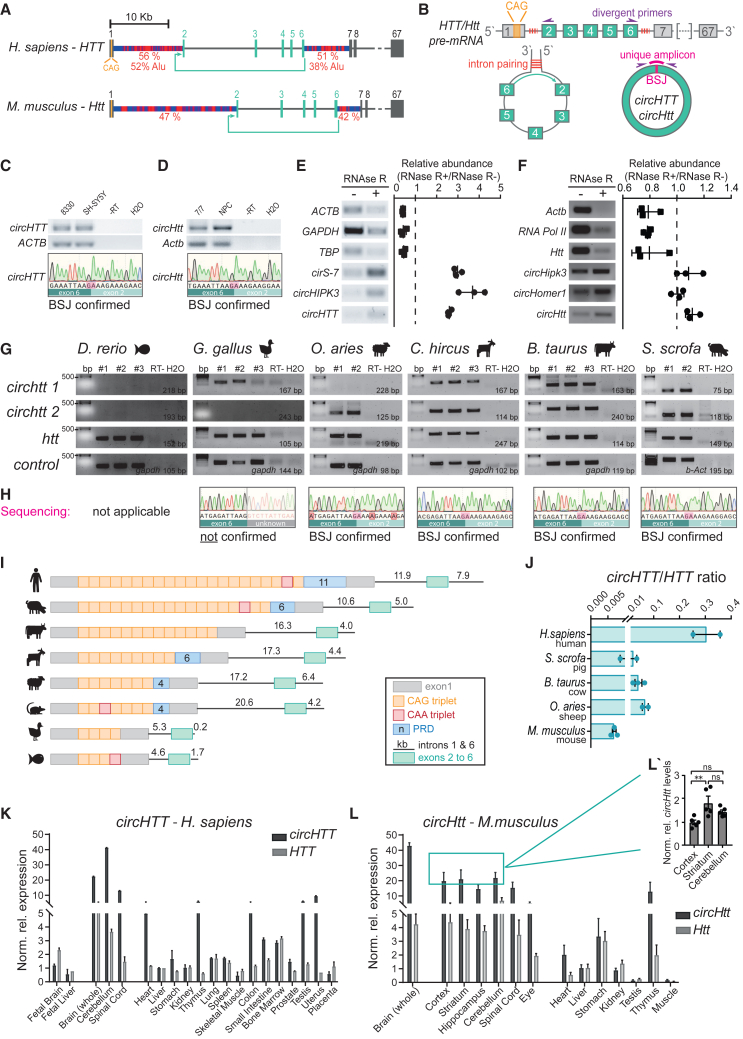
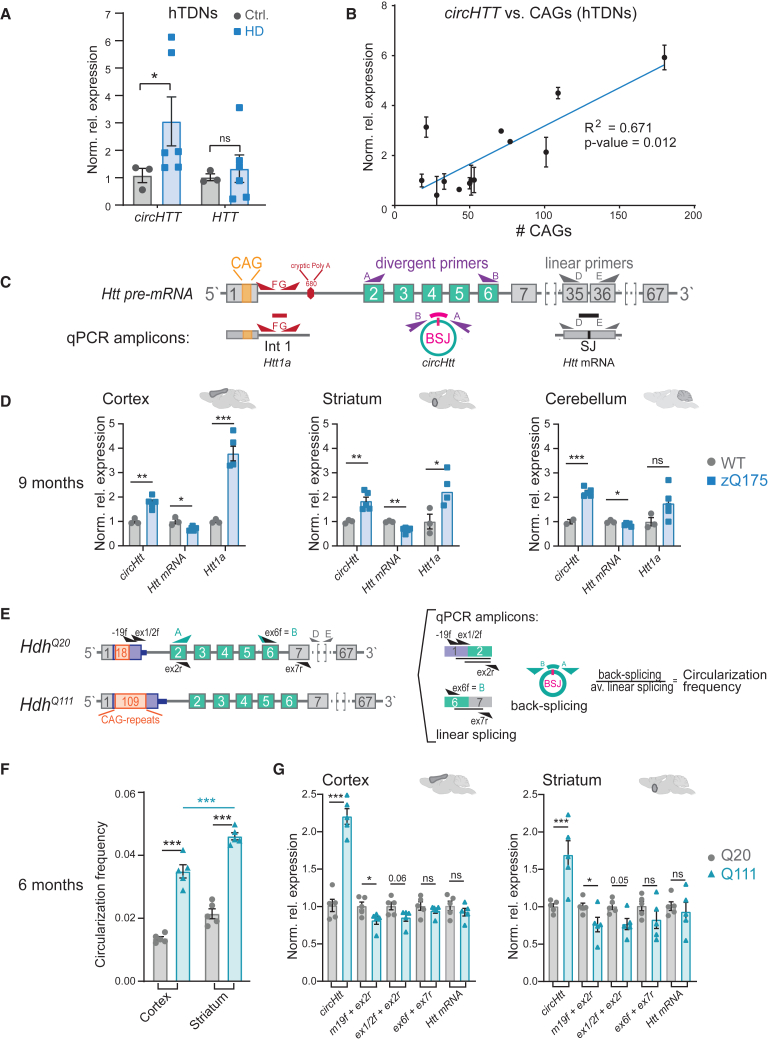
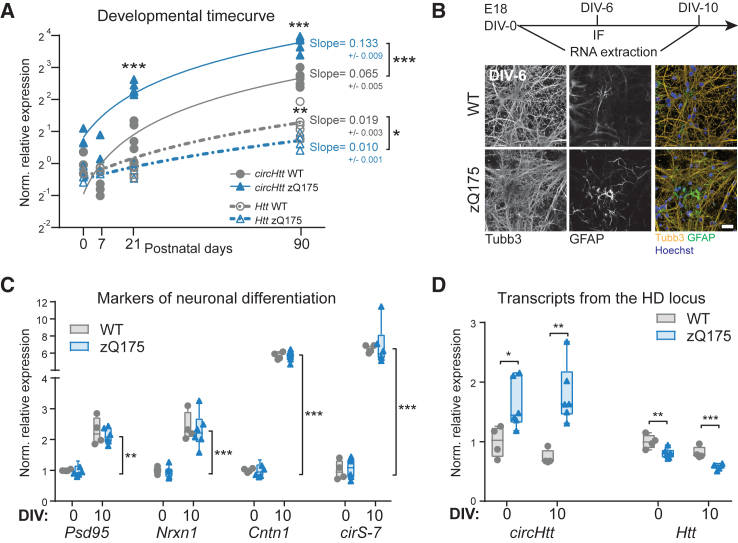
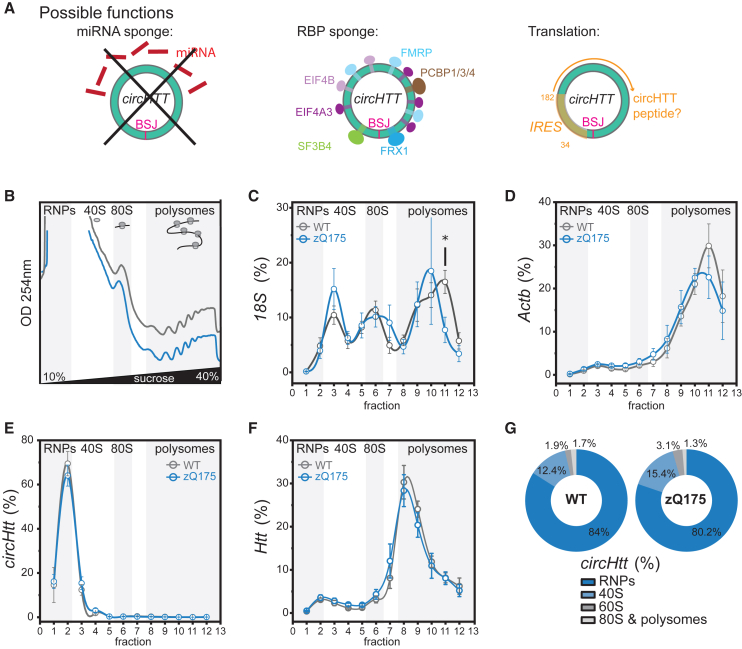
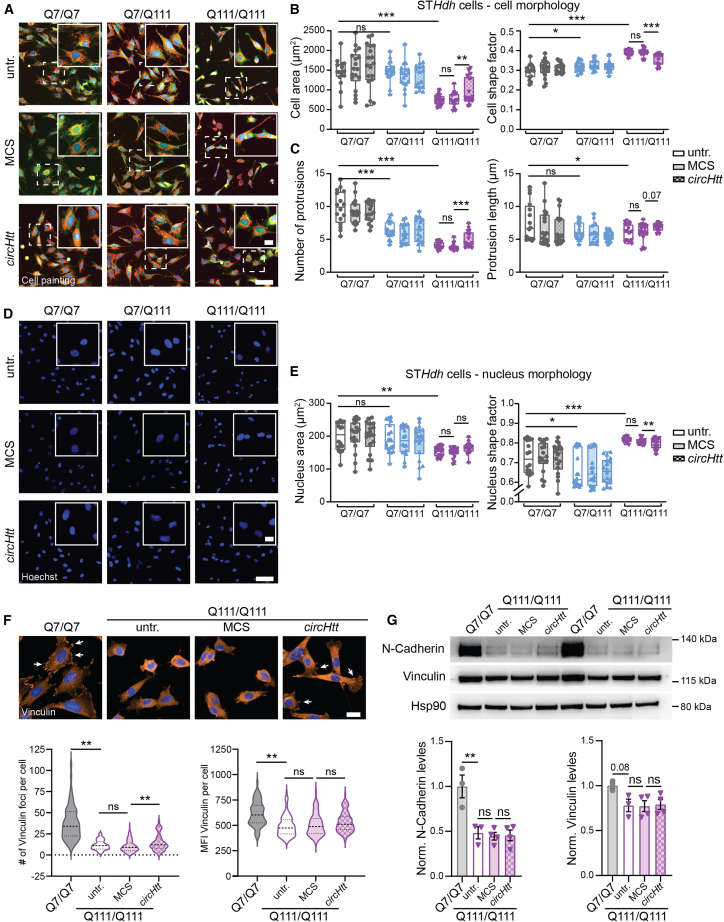
Circular RNA (circRNA) molecules have critical functions during brain development and in brain-related disorders. Here, we identified and validated a circRNA, circHTT(2,3,4,5,6), stemming from the Huntington's disease (HD) gene locus that is most abundant in the central nervous system (CNS). We uncovered its evolutionary conservation in diverse mammalian species, and a correlation between circHTT(2,3,4,5,6) levels and the length of the CAG-repeat tract in exon-1 of HTT in human and mouse HD model systems. The mouse orthologue, circHtt(2,3,4,5,6), is expressed during embryogenesis, increases during nervous system development, and is aberrantly upregulated in the presence of the expanded CAG tract. While an IRES-like motif was predicted in circH TT (2,3,4,5,6), the circRNA does not appear to be translated in adult mouse brain tissue. Nonetheless, a modest, but consistent fraction of circHtt(2,3,4,5,6) associates with the 40S ribosomal subunit, suggesting a possible role in the regulation of protein translation. Finally, circHtt(2,3,4,5,6) overexpression experiments in HD-relevant STHdh striatal cells revealed its ability to modulate CAG expansion-driven cellular defects in cell-to-substrate adhesion, thus uncovering an unconventional modifier of HD pathology.

Keywords: CAG-repeat expansion; Huntington's disease; MT: Non-coding RNAs; Neurodegeneration; back-splicing; circRNA.


Conflict of interest statement

J.E.W. serves as a consultant for Laronde. V.C.W. was a founding scientific advisory board member with financial interest in Triplet Therapeutics Inc. Her financial interests were reviewed and are managed by Massachusetts General Hospital and Mass General Brigham in accordance with their conflict-of-interest policies. She is a scientific advisory board member of LoQus23 Therapeutics Ltd. and has provided paid consulting services to Acadia Pharmaceuticals Inc., Alnylam Inc., Biogen Inc., Passage Bio, and Rgenta Therapeutics. She has received research support from Pfizer Inc.

Figures

None
Graphical abstract
Figure 1
Figure 1
Identification and validation of the evolutionary conserved circHTT(2,3,4,5,6) (A) Schematic representation of the Huntington’s disease gene locus in humans and mice. Circularized exons in turquoise; CircHTT(2,3,4,5,6)/circHtt(2,3,4,5,6): 484 nt, exons 2–6; % of nucleotides accounting for repetitive sequences in flanking introns in red. (B) Schematic of putative circHTT(2,3,4,5,6)/circHtt(2,3,4,5,6) biogenesis and amplification of the back-splice junction (BSJ) using divergent primers. (C and D) Representative images of gel electrophoresis after PCR amplification (top) and electropherograms after sequencing (bottom) of the human (hiPSC-derived neural progenitors 8330-8, and neuroblastoma SH-SY5Y cells) and mouse (neuro-progenitor and striatal StHdh Q7/7 cells) amplicons, spanning the BSJ. (E and F) RNase R (+) and buffer only (−) treated total RNA was purified and used for cDNA synthesis, followed by endpoint PCR for linear and circRNA targets and gel electrophoresis; left: representative gel images; right: quantification of relative abundance (n = 3 biological replicates in E and F, respectively, data are plotted as mean ± standard error of the mean (SEM). (G) Gel electrophoresis of amplicons from endpoint PCR on cDNA synthetized from total RNA of brain samples of different vertebrate species. Two divergent primer pairs were designed targeting the predicted circHTT(2,3,4,5,6) orthologue sequences (top) of each selected species, as well as primers against linear HTT and housekeeping gene orthologues (GAPDH or ACTB) (n = 2/3 biological replicates per species). (H) Gel extraction and Sanger sequencing of the longer amplicons from predicted circHTT(2,3,4,5,6) orthologues in (G). (I) Schematic representation of the CAG tract of HTT exon 1 as well as the length of introns 1 and 6 (flanking exons 2 and 6) of the selected species. (J) RT-qPCR analysis of circHTT(2,3,4,5,6) orthologue expression levels reported as a ratio from the linear HTT orthologue RNA levels in brain samples (circHTT/HTT ratio was calculated upon normalization to GAPDH housekeeping gene). Species are organized according to the length of their CAG tract (decreasing order, n = 2/3 brain samples per species, data are plotted as mean ± SEM). (K and L) Total RNA from the human tissue panel (K, Ambion, #AM6000) and adult wild-type (C57BL6J) mouse tissues/body district (L, n = 3 mice) was analyzed by qPCR for circHTT(2,3,4,5,6) and HTT, and circHtt(2,3,4,5,6), Htt levels respectively (human transcripts were normalized on NONO, mouse transcripts on Pgk1 levels and shown relative to transcript expression levels in liver, data are plotted as mean ± SEM). (L′) Direct comparison between circHtt(2,3,4,5,6) expression levels in the adult cortex, cerebellum, and striatum (n = 5 mice, one-way ANOVA with multiple comparisons testing, ∗∗p < 0.01, data are plotted as mean ± SEM).
Figure 2
Figure 2
Correlation between circHTT (2,3,4,5,6)/circHtt(2,3,4,5,6) levels and CAG trinucleotide repeat number (A and B) CircHTT(2,3,4,5,6) expression levels assessed by RT-qPCR on induced pluripotent stem cell (iPSC)-derived terminal differentiated cortical neurons (hTDNs) from controls (n = 3) and HD patients (n = 6/8, Mann-Whitney test in (A), ∗∗p < 0.01. (B) Results of a linear regression; data are plotted as mean ± SEM). (C) Scheme of qRT-PCR strategy to assess expression levels of different transcripts (i.e., toxic fragment Htt1a, circHtt(2,3,4,5,6) and linear Htt mRNA) from the Htt locus in the brains of wild-type and the zQ175 knockin mouse model for HD. (D) RT-qPCR on brain samples from indicated brain regions (cortex, striatum, cerebellum) of 9-month-old wild-type and zQ175 mice (n = 3 wild-type and 5 zQ175 biological replicates per tissue, one-way ANOVA with Sidak's multiple comparisons testing, ∗∗∗p < 0.001, ∗∗p < 0.01, ∗p < 0.05; data are plotted as mean ± SEM). (E) Experimental strategy to test circHtt(2,3,4,5,6) back-splicing frequency-schematic representation of the binding sites of the employed primer pairs (top). CircHtt fw primer, indicated with letter B in the scheme, can also be used to detect linear Htt when combined with ex7 rv primer. (F) Circularization frequency in cortical, striatal, and cerebellar samples of 6-month-old Q20 (n = 5) and Q111 (n = 5) mice (the relative level of expression of circHtt(2,3,4,5,6) and linear isoforms was first calculated normalizing on the Pgk1 housekeeping gene and subsequently the circularization frequency—as ratio between back-splicing and linear splicing—was computed; one-way ANOVA with Sidak's multiple comparisons testing, ∗∗∗p < 0.001; data are plotted as mean ± SEM). (G) Normalized relative expression of individual primer sets used to calculate circularization frequencies in 6-month Q20 and Q111 mouse tissues (2−DDCt values, unpaired two-sided t tests for each primer set individually, ∗∗∗p < 0.001, ∗∗p < 0.01, ∗p < 0.05, ns = not significant).
Figure 3
Figure 3
In vivo and in vitro developmental trajectory of circHtt(2,3,4,5,6) abundance in the zQ175 HD mouse model (A) RT-qPCR analysis across postnatal (P) development in the wild-type and zQ175 mouse striatum (A, n(P0) = 3 per genotype, n(P7) = 3 wild-type/2 zQ175, n(P21) = 5 per genotype, n(P90) = 5 per genotype; transcript levels normalized to the geometric mean of three housekeeping genes, Pgk1, Tfrc, and Actb, and to the wild-type levels at P0; two-way ANOVAs followed by Tukey's multiple comparisons test, and simple linear regression to calculate expression trajectory slopes, ∗∗∗p < 0.001, ∗∗p < 0.01, ∗p < 0.05). (B) Primary neuronal culture experimental layout from wild-type and zQ175 E18 embryos (top). Representative images of primary cortical neurons at 6 days in vitro (DIV), stained for Tubb3+ differentiating neurons and GFAP+ astrocytes (bottom), scale bar, 25 μm; (C and D) RT-qPCR results on cDNA from total RNA of cultured neurons at 0 and 10 DIV; neuronal maturation markers Psd95, Nrxn1, Cntn1, and the circular RNA cirS-7 (C); circHtt(2,3,4,5,6) and Htt mRNA levels in the zQ175 derived neurons at 0 DIV and 10 DIV (D) (n(embryos) = 4 wild-type and 5 zQ175; transcript levels normalized to the geometric mean of three housekeeping genes, Pgk1, Tfrc, and Actb, and to the wild-type levels at DIV-0; two-way ANOVA followed by Tukey's multiple comparisons test, ∗∗∗p < 0.001, ∗∗p < 0.01, ∗p < 0.05; data are plotted as mean ± SEM).
Figure 4
Figure 4
CircHTT(2,3,4,5,6) has predicted binding sites for RNA-binding proteins (RBPs) and associates with the 40S ribosomal subunit (A) Sequence analysis of circHTT(2,3,4,5,6) reveals no enrichment in miRNA binding sites (left); however, binding sites for multiple RBPs (middle, Table S2, width visualizes number of nucleotides in binding motive), as well as an IRES sequence (right, localized between nucleotides 31 and 128), followed by a predicted open reading frame of 186 aa. (B) Representative sucrose gradient absorbance profiles of polysome fractionation of cytoplasmic lysates from wild-type (WT) (gray) and zQ175 (blue) brain samples at 6–7 months of age. (C–F) Relative distribution of 18S, Actb, circHtt(2,3,4,5,6), and Htt RNAs along polysome profile in WT (gray line) and zQ175 (blue line) (data are plotted as mean ± SEM of n = 5 independent biological replicates). (G) Doughnut plots reporting the relative percentages of circHtt(2,3,4,5,6) co-sedimentation with RNPs, 40S, 60S, 80S, and polysomes.
Figure 5
Figure 5
Overexpression of circHtt(2,3,4,5,6) ameliorates cellular phenotypes of the STHdh Q111/Q111 striatal cell model system for HD (A) Representative images of the high-throughput cell painting assay using Calcein-AM (green), MitoTracker (red), and Hoechst (blue) live-cell staining to assess cellular features of the untransfected (untr.) control STHdh Q7/Q7, Q7/Q111, and Q111/Q111 cell lines, as well as MCS and circHtt(2,3,4,5,6) overexpressing cells of all genotypes (composite merged image of the three channels is shown in A, close ups of the dash-boxed cells in the upper right corner). (B) Average cell area in μm2 (left) and cell shape factor (0 = flat, 1 = perfect circle, right) are reported. (C) Average number (left) and length (right) of cellular protrusions. (D) Representative images of Hoechst nuclear staining. (E) Average nuclear cell area in μm2 (left), and shape factor (0 = flat, 1 = perfect circle, right); (parameters as calculated upon segmentation of Calcein-AM and Hoechst signal by the Custom Module extension of MetaXpress (6.7.2.290) are reported; (A–E, n(cells) = 8,000–10,000 cells per genotype and condition over three biological replicates, each dot represents the average value of all cells from the individual replica wells; outliers were removed using the ROUT (Q = 1%) method, followed by one-way ANOVA with Sidak's multiple comparisons testing (parametric data) and Kruskal-Wallis with Dunn's multiple comparisons testing (nonparametric data), ∗∗∗p < 0.001, ∗∗p < 0.01, ∗p < 0.05, scale bars indicate 100 μm in overview and 25 μm in close ups; data are plotted as mean ± SEM). (F) Immunofluorescence staining of Q7/Q7 wild-type control and Q111/Q111 untransfected, MCS, and circHtt(2,3,4,5,6) overexpressing cells for Vinculin (orange) and Hoechst (blue) (top). The average number of Vinculin foci per cell (bottom left) and average Vinculin fluorescence intensity (bottom right) as quantified by an automated cell segmentation and analysis Macro in Fiji (n(technical replicates) = 3, with n(cells) = 69 Q7/Q7, 102 Q111/Q111 untransfected, 134 Q111/111 MCS, and 95 Q111/Q111 circHtt(2,3,4,5,6) overexpressing; outliers were removed using the ROUT (Q = 1%) method, followed by Kruskal-Wallis with Dunn's multiple comparisons testing [nonparametric data], ∗∗p < 0.01, ns = not significant, scale bars indicate 20 μm; data are presented with violin plots, central line indicates median, dotted line quartiles). (G) Representative western blots of N-Cadherin and Vinculin levels in Q7/Q7 wild-type control and Q111/Q111 untransfected, MCS, and circHtt(2,3,4,5,6) overexpressing cells (top) and quantifications normalized to Hsp90 (bottom) (n(biological replicates) = 3–4 per genotype and condition, one-way ANOVA with Sidak's multiple comparisons testing, ∗∗p < 0.01, ns = not significant; data are plotted as mean ± SEM).

References

    1. McClung C.A., Nestler E.J. Neuroplasticity Mediated by Altered Gene Expression. Neuropsychopharmacology. 2008;33:3–17. doi: 10.1038/sj.npp.1301544. - DOI - PubMed
    1. Blair J.D., Hockemeyer D., Doudna J.A., Bateup H.S., Floor S.N. Widespread Translational Remodeling during Human Neuronal Differentiation. Cell Rep. 2017;21:2005–2016. doi: 10.1016/j.celrep.2017.10.095. - DOI - PMC - PubMed
    1. Li Q., Lee J.-A., Black D.L. Neuronal regulation of alternative pre-mRNA splicing. Nat. Rev. Neurosci. 2007;8:819–831. doi: 10.1038/nrn2237. - DOI - PubMed
    1. Su C.-H., D D., Tarn W.-Y. Alternative Splicing in Neurogenesis and Brain Development. Front. Mol. Biosci. 2018;5:12. doi: 10.3389/fmolb.2018.00012. - DOI - PMC - PubMed
    1. Raj B., Blencowe B.J. Alternative Splicing in the Mammalian Nervous System: Recent Insights into Mechanisms and Functional Roles. Neuron. 2015;87:14–27. doi: 10.1016/j.neuron.2015.05.004. - DOI - PubMed

LinkOut - more resources