Review
. 2024 Jun 8;10(12):e32546.
doi: 10.1016/j.heliyon.2024.e32546. eCollection 2024 Jun 30.

Inspiring a convergent engineering approach to measure and model the tissue microenvironment

Affiliations
Review

Inspiring a convergent engineering approach to measure and model the tissue microenvironment

Rishyashring R Iyer et al. Heliyon. .

Abstract

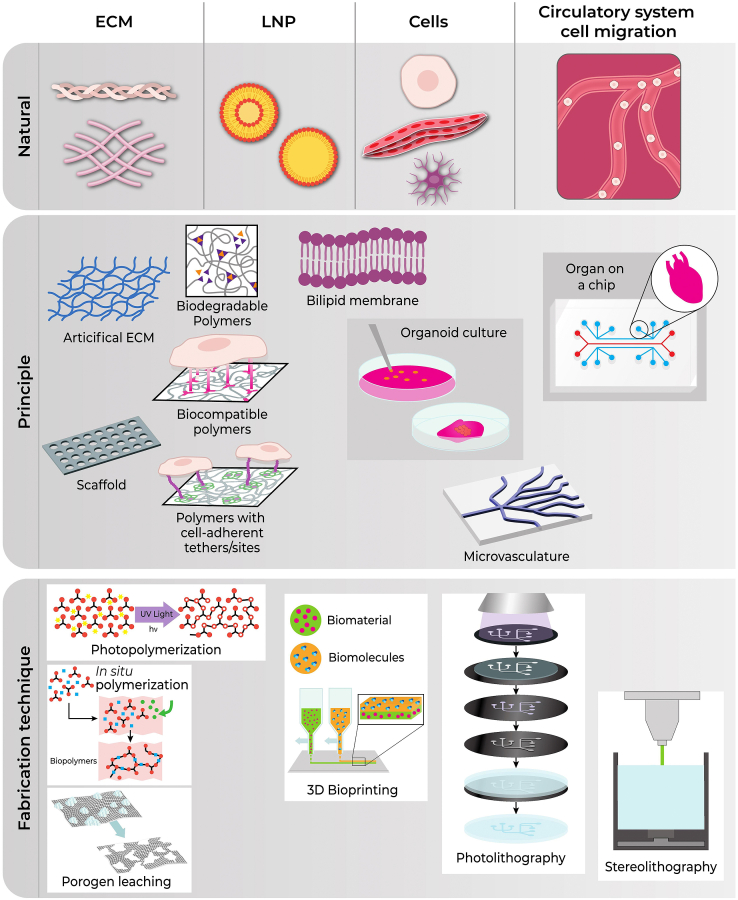
Understanding the molecular and physical complexity of the tissue microenvironment (TiME) in the context of its spatiotemporal organization has remained an enduring challenge. Recent advances in engineering and data science are now promising the ability to study the structure, functions, and dynamics of the TiME in unprecedented detail; however, many advances still occur in silos that rarely integrate information to study the TiME in its full detail. This review provides an integrative overview of the engineering principles underlying chemical, optical, electrical, mechanical, and computational science to probe, sense, model, and fabricate the TiME. In individual sections, we first summarize the underlying principles, capabilities, and scope of emerging technologies, the breakthrough discoveries enabled by each technology and recent, promising innovations. We provide perspectives on the potential of these advances in answering critical questions about the TiME and its role in various disease and developmental processes. Finally, we present an integrative view that appreciates the major scientific and educational aspects in the study of the TiME.

Keywords: Bioengineering; Bioimaging; Biomaterials; Biomedical devices; Biosensing; Biotechnology; Computational biology; Interdisciplinary research.


Conflict of interest statement

The authors declare that they have no known competing financial interests or personal relationships that could have appeared to influence the work reported in this paper.

Figures

Image 1
Graphical abstract
Fig. 1
Fig. 1
An integrated framework to study the tissue microenvironment. We organize integrated studies into 3 broad fields. First, probing and sensing technologies focus on harnessing recent advances in microelectronics optics and fabrication to provide unprecedented level of detail and amount of data. Second, recent advances in microfabrication and manufacturing offer new opportunities to model and make representative versions of the TiME. Finally, the enormous increase in capability of computing, storage and communication resources in recent years makes it feasible to utilize the data from model systems under a large variety of conditions. Together, these three trends allow for a convergent approach to study the TiME. a-b. Here we present an overview of selected, key technologies that can be used in the same overall framework to study the role of the TiME in (left) physiologic neuronal responses, and (right) in cancer progression.
Fig. 2
Fig. 2
Length scales of the tissue microenvironment processes and methodologies. The different rows describe the components of the tissue microenvironment at their approximate spatial scales, and biological phenomena broadly categorized as mechanical, electrical, or chemical processes from the top to the bottom. Among the mechanical phenomena, the cytoskeletal tension from actin (dark orange) and microtubules (light orange) which are 5–25 nm thick, the adherens junctions between epithelial cells (200–800 nm long, 20–50 nm wide) tethered by the actin molecules (orange filaments), the extracellular matrix (ECM) constituent proteins such as collagen (green strands) that constitute the tissue bulk on the microscale (10–100 μm), and the muscle cells and fibres that can span several millimetres are described from the left to right. Among the electrical phenomena, the ion channels (<0.2 nm) that allow K+, Na+, Ca2+ transmission on a millisecond-scale, neural synapse with synaptic vesicles (<50 nm) and the neural cleft (the gap in the junction, 20–40 nm), a neural cell with a long axon wrapped in myelin (cyan), the round soma, and the dendritic projections (top), and a neural circuit with interconnected neurons (orange) and supporting glial cells (cyan) are illustrated from the left to right. Among the chemical phenomena, the molecular vibrations on a sub-nanometre scale, the molecular cycle of ATP-ADP that happens inside a mitochondrion (500–1000 nm), biochemical signalling through a transmembrane receptor, and endocrine signalling that happens across several meters through the vascular pathway are illustrated. (For interpretation of the references to colour in this figure legend, the reader is referred to the Web version of this article.)
Fig. 3
Fig. 3
Overview of the approach and example results of the techniques for probing and sensing TiME properties. (Centre) Increasing length scales of the components of TiME from top left corner to the bottom right corner encompassing characterization of chemical, optical, electrical, and mechanical properties. a. Chemical characterization: (Top) Approach of Raman spectroscopy describing the electron transition diagrams (Jablonski diagram) for Stokes and anti-Stokes Raman scattering where the absorption of a photon induces the electron to transition to a virtual electronic state before falling to the ground state. The accompanying system diagram describes a typical Raman spectroscopy setup in epi detection mode. The accompanying images show its application in breast-cancer detection, adapted from Ref. [1]. (Bottom) Approach of FTIR spectroscopy showing the system setup for interferometric detection of absorbance, typical signals in the TiME domain for each pixel and the extraction of the spectroscopic characteristics by a time-to-frequency Fourier transform. The images on the right show a typical H&E image typically used in histopathology reregistered with the FTIR image at two selected wavelengths for a sample of prostate cancer. The graph shows the average spectra from selected regions in the sample corresponding to epithelium, stroma, and stone. Based on the spectra and spatial features, FTIR can be used to detect and classify different components of TiME. Adapted from Ref. [2]. The box contains a few biochemical probes for targeted labelling of tissues using the ubiquitous antibody conjugated fluorescence proteins, quantum dots that enhance the fluorescence of typical fluorophores, chemiluminescent probes for live whole-body imaging, and plasmonic heating for localized thermal excitation. b. Optical characterization: (Top) Approach of phase imaging describing a typical setup capture the self-interference at different phase shifts, corresponding images before and after interference at four different phase shifts 90° apart. The example results depict an image of neuronal cells grown on a coverslip captured by GLIM at four phase shifts and reconstruction of quantitative optical phase from these images, adapted from Ref. [3]. Scale bar: 50 μm. (Bottom) Electron transition diagram for various nonlinear light-matter interactions and the relationship between excitation and emission frequencies. Typical system setup of multiphoton microscopy showing an ultrafast NIR light source (centred around 700–1200 nm, 20–50 nm bandwidth, <200 fs), dichroic mirrors and filters, high-numerical objective lenses (>0.8 NA), and single photon detectors (such as photomultiplier tubes, hybrid photodetectors, electron-multiplied charged coupled devices, or avalanche photodiodes). The image on the right shows the multimodal nonlinear label-free image of a breast tumour in rats captured in vivo in a multiphoton setup with four multiplexed detectors excited with a 60-fs source centred at 1110 nm capable of imaging signals from NAD(P)H (3-photon excitation fluorescence or 3PEF), FAD (2-photon excitation fluorescence or 2PEF), collagen (second harmonic generation or SHG), and bilipid interfaces (third harmonic generator or THG) simultaneously, which are found in various components of TiME, adapted from Ref. [4]. Scale bar: 100 μm. c. Mechanical characterization: Approach of ultrasound localization microscopy where microbubbles used as exogenous contrast agents into blood vessels are imaged with ultrasound microscopy for enhanced contrast and localization by the decorrelation of highly reflective microbubbles within microvasculature. A representative image of ultrasound super-resolution localization microscopy of mouse brain and corresponding doppler image showing the velocity of blood flow through the microvasculature, adapted from Ref. [5]. Scale bar: 100 μm. The box contains approaches for exerting stress (left) and measuring the strain (right) for probing the mechanical properties of biological samples. Nanoindentation with optical deflection comprises atomic force microscopy; optical pressure, ultrasound, or magnetomotive forces with low coherence interferometry comprise photonic force, acoustic radiation force, or magnetomotive optical coherence elastography techniques; ultrasound or air-puff excitation with ultrasonic detection comprises ultrasound elastography. d. Electrical characterization: (Top) Approach of using fluorescent tags for imaging ion flux or membrane potential differences into a cell, typically a neuron at millisecond-to-seconds scale, where the fluorescent molecule undergoes conformational changes upon binding to Ca2+ ions and becomes fluorescent upon excitation with visible light. The images on the right show the average fluorescence from GCaMP6s frames of a neural cell culture with traces from certain regions in the sample [6]. (Bottom). Approach of fMRI to capture the vascular dynamics resulting from neural activity in certain regions in the sample by harnessing the differences in the magnetism of oxygenated and deoxygenated blood creating contrast when imaged serially using MRI using a technique called Blood-oxygen-level-dependent imaging. The images on the right correspond to fMRI images captured for different learners for a task at different depths in the brain, adapted from Ref. [7]. The box contains schematics for patch clamp electrophysiology (traditional method to measure the electrical activity of neurons) and neural microarrays that can be implanted in the skull semi-permanently to continuously monitor electrical signals over a region along the brain surface and transmit data wirelessly.
Fig. 4
Fig. 4
Overview of the approach and example results of the techniques for modelling and fabricating TiME components categorized by the underlying engineering principles. The top row illustrates natural TiME components in ascending length scales from the left to right. The middle row illustrates artificial equivalents for the natural TiME components. The bottom row lists a few techniques used to fabricate the components in Row 2.
Fig. 5
Fig. 5
The role of computational analysis in a convergent approach to studying TiME highlighting seven applications- (from the top) image-to-image translation [83,[274], [275], [276], [277], [278]], disease diagnostics [[279], [280], [281], [282]], denoising [[283], [284], [285], [286], [287]], quantification [[288], [289], [290], [291]], reconstruction and enhancement [[292], [293], [294], [295], [296]], simulation [[297], [298], [299], [300]], and systems biology [[301], [302], [303]].

References

    1. Kong K., Rowlands C.J., Varma S., Perkins W., Leach I.H., Koloydenko A.A., Williams H.C., Notingher I. Diagnosis of tumors during tissue-conserving surgery with integrated autofluorescence and Raman scattering microscopy. Proc. Natl. Acad. Sci. U.S.A. 2013;110:15189–15194. doi: 10.1073/pnas.1311289110. - DOI - PMC - PubMed
    1. Bhargava R. Towards a practical Fourier transform infrared chemical imaging protocol for cancer histopathology. Anal. Bioanal. Chem. 2007;389:1155–1169. doi: 10.1007/s00216-007-1511-9. - DOI - PubMed
    1. Park Y., Depeursinge C., Popescu G. Quantitative phase imaging in biomedicine. Nature Photon. 2018;12:578–589. doi: 10.1038/s41566-018-0253-x. - DOI
    1. You S., et al. Intravital imaging by simultaneous label-free autofluorescence-multiharmonic microscopy. Nat. Commun. 2018;9:2125. doi: 10.1038/s41467-018-04470-8. - DOI - PMC - PubMed
    1. Huang C., et al. Short acquisition time super-resolution ultrasound microvessel imaging via microbubble separation. Sci. Rep. 2020;10:6007. doi: 10.1038/s41598-020-62898-9. - DOI - PMC - PubMed

LinkOut - more resources