. 2024 Nov 1;14(11):2122-2134.
doi: 10.1158/2159-8290.CD-24-0740.

A Classical Epithelial State Drives Acute Resistance to KRAS Inhibition in Pancreatic Cancer

Affiliations

A Classical Epithelial State Drives Acute Resistance to KRAS Inhibition in Pancreatic Cancer

Anupriya Singhal et al. Cancer Discov. .

Abstract

Intratumoral heterogeneity in pancreatic ductal adenocarcinoma (PDAC) is characterized by a balance between basal and classical epithelial cancer cell states, with basal dominance associating with chemoresistance and a dismal prognosis. Targeting oncogenic KRAS, the primary driver of pancreatic cancer, shows early promise in clinical trials, but efficacy is limited by acquired resistance. Using genetically engineered mouse models and patient-derived xenografts, we find that basal PDAC cells are highly sensitive to KRAS inhibitors. Employing fluorescent and bioluminescent reporter systems, we longitudinally track cell-state dynamics in vivo and reveal a rapid, KRAS inhibitor-induced enrichment of the classical state. Lineage tracing uncovers that these enriched classical PDAC cells are a reservoir for disease relapse. Genetic or chemotherapy-mediated ablation of the classical cell state is synergistic with KRAS inhibition, providing a preclinical proof of concept for this therapeutic strategy. Our findings motivate combining classical state-directed therapies with KRAS inhibitors to deepen responses and counteract resistance in pancreatic cancer. Significance: KRAS inhibitors hold promise in pancreatic cancer, but responses are limited by acquired resistance. We find that a classical epithelial cancer cell state is acutely resistant to KRAS inhibition and serves as a reservoir for disease relapse. Targeting the classical state alongside KRAS inhibition deepens responses, revealing a potent therapeutic strategy. See related commentary by Marasco and Misale, p. 2018.


Figures

Figure 1.
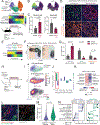
Figure 1.. KRAS inhibition enriches for a classical epithelial state in PDAC.
(A) (top) UMAP embedding of autochthonous PDAC cell transcriptomes, classified as classical (purple), basal (green), or mesenchymal (orange) cancer cell populations, from Pitter et al. (12) (middle) Expression of previously described human classical, basal, and mesenchymal expression signatures projected along the pseudotemporal axis (13,46) (bottom). Experimental design for investigating KRAS(G12D) inhibition in autochthonous KPCT PDAC tumors using the KRAS(G12D) inhibitor MRTX1133. (B) UMAP projection of Lgals4 (left) and Krt-17 (right) gene expression. (C) Quantification of classical tumor states [galectin-4+/pan-cytokeratin+] and basal tumor states [Krt-17+/pan-cytokeratin+] with 7 days on MRTX1133 or vehicle control (n = 5 in each group). (D) Representative images of immunofluorescent staining for galectin-4 (red), KRT17 (green), and pan-cytokeratin (orange) in an autochthonous KPT PDAC tumor treated with MRTX1133 vs vehicle. Scale bar: 100 μm. (E) Expression of Epcam and CD44 along pseudotemporal classical-basal-mesenchymal axis. Expression of markers segregates classical, basal, and mesenchymal PDAC cell states. (F) Representative flow cytometry plots of cancer cells (tdTomato+/CD45/CD31/CD11b/F480/TER119/DAPI) depicting expression of Epcam (x-axis) and CD44 (y-axis) in PDAC tumors from KPCT GEMMs after MRTX1133 (7 days) compared with vehicle control. (G) Quantification of the proportion of classical, basal, and mesenchymal states using flow cytometry after MRTX1133 compared with vehicle control, n = 5 mice/group. (H) Experimental design to investigate KRAS(G12D) inhibition in orthotopic KRAS(G12D);P;Rosa26-mTmG PDAC tumors. (I) Principal component analysis (PCA) of (tdTomato+/CD45/CD31/CD11b/F480/TER119/DAPI) single PDAC cell transcriptomes from MRTX1133-treated vs control tumors (n =3 tumor in each group; n = ~3000 cells per condition) (top). Unsupervised clustering of PDAC single cell transcriptomes, colored and annotated based on human gene signatures (13) (middle, bottom). Embedding density of MRTX1133 vs. vehicle treated tumors within PCA plot. (J) Pearson correlation of gene weights within each principal component (PC) with their presence in human classical/basal gene signatures (13). (K) Heatmap depicting the difference in gene signature scores between MRTX1133-treated orthotopic KP tumors, as compared with vehicle-treated tumors. Classical and basal signatures drawn from four independent human data sets (–16). Difference calculated with the average signature score over all single-cell transcriptomes per condition; n = 3 tumors/condition; ~3000 cells/condition. Statistical significance is assessed over all single-cell transcriptomes between treatments by a two-sided Wilcoxon rank-sum test. (L) Representative image of immunofluorescent staining for phospho-ERK across galectin-4+ (classical) states and Keratin-17+ (basal) states in an untreated KPT GEMM PDAC tumor. Scale bar: 40 μm (M) Quantification of phospho-ERK intensity in classical (galectin-4+) and basal (KRT17+) cells (n = >2000 cells/group; n = 3 tumors) from unperturbed KPT GEMM PDAC tumors. Dark line represents mean value, and dashed lines the interquartile value. Statistical significance was assessed using an unpaired t-test. (N) Hallmark transcriptional gene sets significantly enriched or depleted in (left) MRTX1133-treated resistant classical cells vs. vehicle-treated classical cells, and in (right) MRTX1133-treated resistant basal cells vs. vehicle-treated basal cells. The normalized enrichment score from gene set enrichment analysis (GSEA) is shown on the x-axis. Unpaired t tests were used to test significance compared to vehicle in (C), (G). Error bars indicate standard deviation.
Figure 2.
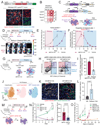
Figure 2.. Classical cells in PDAC give rise to relapsed disease, and classical state cytoablation enhances response to KRAS inhibition.
(A) Genetic Lgals4-MACD reporter enabling visualization (mScarlet), non-invasive longitudinal tracking (AkaLuc), lineage tracing (CreER) and ablation (DTR) of classical KP PDAC cells. Frt-Stop-Frt-mScarlet-Akaluc-CreERT2-DTR reporter construct knocked in in-frame after exon 10 of Lgals4. Endogenous mScarlet signal expressed from Lgals4-MACD reporter labels classical states and aligns closely with galectin-4 immunofluorescence (green, lower right). The lentiviral reporter (described in C) labels all tumor cells with iRFP670 (cyan). Scale bar, 100 μm. (B) Classical marker gene expression in mScarlet cells (high, dim) as compared with mScarlet negative cells, isolated by flow cytometry from orthotopic Lgals4-MACD PDAC tumors. n = 3 biological replicates from independent tumors per cell population. One-way ANOVA was used to test for statistical significance between mScarlet and mScarlet+ (dim, high) populations. (C) PGK-GLuc-miRFP-EFS-lox-BFP-lox lentiviral lineage-tracing vector was introduced into Lgals4 -MACD reporter cells. This vector enables tumor burden measurements via secreted Gaussia luciferase (GLuc). Lineage-tracing of classical Lgals4+ cells occurs following a tamoxifen pulse, which triggers BFP expression. The ratio of AkaLuc/GLuc, tracked over time, indicates changes in the proportion of classical states in the tumor. (lower right) After lineage tracing, cells that retain the BFP mark, but are no longer mScarlet+, arise through cell state transitions. (D) (top) Outline of experimental design to investigate Lgals4+ classical states during and following withdrawal of KRAS(G12D) inhibition in orthotopic KP; Lgals4-MACD PDAC tumors using bioluminescence imaging (BLI; for AkaLuc+ classical states) and serum measurements (GLuc; for tumor burden) at the indicated time points. (bottom) In vivo AkaLuc luciferase imaging (classical state) of mice with orthotopic Lgals4-MACD pancreas tumors subjected to vehicle or MRTX1133 before, ON (7, 10 days), and OFF (15, 25 days) treatment. (E) Tumor burden measured by Gaussia princeps luciferase (GLuc) luminescence in response to MRTX1133 therapy over time in orthotopic Lgals4-MACD tumors, treated with MRTX1133 vs vehicle (on drug), followed by relapse (off drug), n = 8–12 mice/group. Error bars indicate SEM. (F) Quantification of bioluminescence from Lgals4: : AkaLuc normalized to tumor burden (GLuc), expressed as a fold-change from baseline, during MRTX1133 treatment and after relapse; n = 8–12 tumors/group. (G) Outline of experimental design to lineage trace Lgals4+ classical cells on and after MRTX1133 treatment vs. vehicle control in orthotopic Lgals4-MACD tumors. (H) Representative flow cytometry plots of cancer cells (miRFP760+/ CD45/CD31/CD11b/TER119/DAPI); depicting expression of mScarlet (x-axis; classical identity) and BFP (y-axis; lineage-traced cells) from orthotopic tumors (Lgals4-MACD) on treatment with MRTX1133 (Day 7) as compared with time of relapse (Day 21). (I) Quantification of the fraction of classical lineage-traced states (mScarlet+/BFP+) as compared with all lineage-traced states (BFP+; history of classical identity at the time of nadir) from orthotopic tumors (Lgals4-MACD) on treatment with MRTX1133 (Day 7) as compared with time of relapse (Day 21). Note that samples for each group were collected during independent experiments with the same experimental design. (J) Single PDAC cell transcriptomes from tumors at 14 days of relapse, after lineage-tracing classical states at nadir (left) Unsupervised clustering of cells (miRFP760+/ CD45/CD31/CD11b/TER119/DAPI), annotated based on (12) (middle) gene expression of Lgals4 projected into UMAP (right) lineage-traced cells (BFP+) projected onto UMAP; arrows indicates the transdifferentiation of classical cells at treatment-nadir into other PDAC cell states at relapse. (K) Representative images of BFP and mScarlet immunofluorescence in KP; Lgals4-MACD reporter tumors on MRTX1133 (left) or at 14 days relapse (right). Note labeling of BFP+/mScarlet+ cells (white arrowheads) on MRTX-1133 and an increase of transdifferentiated classical cells (BFP+/mScarlet-; yellow arrowheads) during relapse. Scale bar, 100 μm. (L) Percentage of lineage-traced cells (BFP+) as quantified by flow cytometry in Lgals4-MACD orthotopic tumors that underwent treatment with MRTX1133 followed by relapse, as compared with vehicle. (M) Outline of experimental design to test ablation of Lgals4-MACD+ cells via diphtheria toxin (DT) in the context of MRTX1133 treatment vs vehicle control in orthotopic tumors. (N) Tumor burden measured by Gaussia luciferase in MRTX1133-treated, MRTX1133+DT-treated, DT-treated, or vehicle-treated orthotopic Lgals4-MACD tumors, n = 5–12 mice/group. (O) Tumor burden measured by Gaussia luciferase in vehicle-treated, gemcitabine/nab-paclitaxel-treated, MRTX1133-treated, or MRTX1133+ gemcitabine/nab-paclitaxel-treated mice in orthotopic Lgals4-MACD tumors, n = 4–8 mice/group
Figure 3.
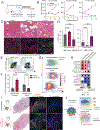
Figure 3.. KRAS inhibition enriches for the classical epithelial state in human PDAC
(A) Experimental design to investigate KRAS(G12D) inhibition in human PDAC PDX models using MRTX1133. (B) Tumor volume in response to MRTX1133 treatment (n = 7–8 mice/group). Error bars indicate SEM. (C) Immunofluorescence of classical (GATA6+) and basal (S100A2+) states in PDX PC106 after 14 days of MRTX1133 or FOLFIRI treatment. Note glandular features and intracellular mucin in MRTX1133-treated tumors. Scale bar, 100 μm (D) Quantification of classical (GATA6+) and basal (S100A2+) states in treated tumors. (n = 3–4 tumors/group). One-way ANOVA was used to test for statistical significance. Error bars indicate SD. (E) Representative flow cytometry plots of human PDX cells (mouse H-2Kd/mouse CD45/human CD45/mouse CD31/mouse CD11b/mouse TER119/DAPI); depicting expression of TSPAN8 (x-axis; classical) and CD44 (y-axis; basal) in PDAC tumors from PDX PC69 after MRTX1133 compared with vehicle control. (F) Quantification of the proportion of classical/basal states using flow cytometry after MRTX1133 compared with vehicle control, n = 3 mice/group. Unpaired t tests were used to test significance. Error bars indicate SD. (G) Principal component analysis (PCA) of human PDX cells (PC69) from MRTX1133-treated vs control tumors (n =3 in each group, n = >2000 cells per condition). Unsupervised clustering of PDAC single cell transcriptomes, colored and annotated based on human gene signatures (13). (H) Heatmap depicting the difference in gene signature scores between MRTX1133-treated tumors, as compared with vehicle-treated tumors, for each PDX model. Classical and basal signatures drawn from four independent human data sets (–15). Difference calculated with the average signature score over all single-cell transcriptomes per condition; n = 3 tumors/condition; ~2000 cells/condition. Statistical significance assessed over all single-cell transcriptomes between treatments by a two-sided Wilcoxon rank-sum test. (I) Immunofluorescence of classical marker genes (galectin-4, GATA6, and TFF-1) in a longitudinal tumor tissue biopsy obtained from a liver metastasis in a human patient harboring KRAS G12C PDAC prior to and on adagrasib therapy. Note increase in TFF-1 (classical) expression on treatment. Scale bar, 200 μm. (J) Schematic summary of key findings.

References

    1. Bekaii-Saab TS, Yaeger R, Spira AI, Pelster MS, Sabari JK, Hafez N, et al. Adagrasib in Advanced Solid Tumors Harboring a KRASG12C Mutation. J Clin Oncol 2023;41(25):4097–106 doi 10.1200/JCO.23.00434. - DOI - PMC - PubMed
    1. Strickler JH, Satake H, George TJ, Yaeger R, Hollebecque A, Garrido-Laguna I, et al. Sotorasib in KRAS p.G12C-Mutated Advanced Pancreatic Cancer. N Engl J Med 2023;388(1):33–43 doi 10.1056/NEJMoa2208470. - DOI - PMC - PubMed
    1. Arbour KC, Punekar S, Garrido-Laguna I, Hong DS, Wolpin B, Pelster MS, et al. 652O Preliminary clinical activity of RMC-6236, a first-in-class, RAS-selective, tri-complex RAS-MULTI(ON) inhibitor in patients with KRAS mutant pancreatic ductal adenocarcinoma (PDAC) and non-small cell lung cancer (NSCLC). Annals of Oncology 2023;34:S458 doi 10.1016/j.annonc.2023.09.1838. - DOI
    1. Hallin J, Bowcut V, Calinisan A, Briere DM, Hargis L, Engstrom LD, et al. Anti-tumor efficacy of a potent and selective non-covalent KRASG12D inhibitor. Nat Med 2022;28(10):2171–82 doi 10.1038/s41591-022-02007-7. - DOI - PubMed
    1. Sacher A, LoRusso P, Patel MR, Miller WH, Garralda E, Forster MD, et al. Single-Agent Divarasib (GDC-6036) in Solid Tumors with a KRAS G12C Mutation. The New England Journal of Medicine 2023;389(8):710–21 doi 10.1056/NEJMoa2303810. - DOI - PubMed

MeSH terms

Substances