. 2024 Jul 8:12:RP93052.
doi: 10.7554/eLife.93052.

Sex-specific resilience of neocortex to food restriction

Affiliations

Sex-specific resilience of neocortex to food restriction

Zahid Padamsey et al. Elife. .

Abstract

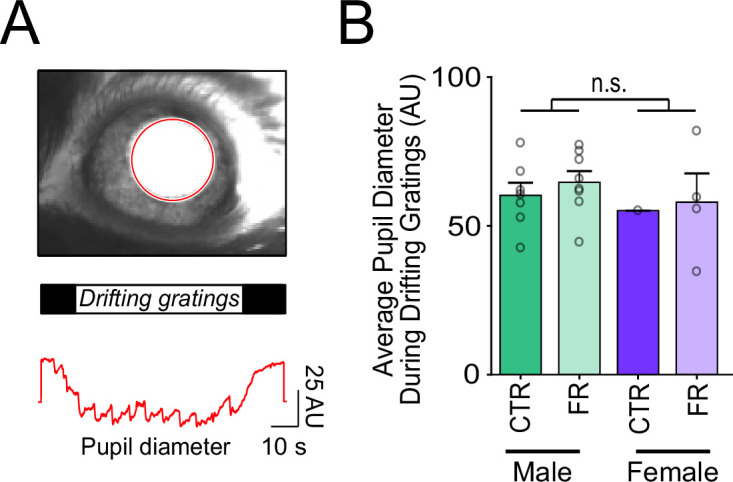
Mammals have evolved sex-specific adaptations to reduce energy usage in times of food scarcity. These adaptations are well described for peripheral tissue, though much less is known about how the energy-expensive brain adapts to food restriction, and how such adaptations differ across the sexes. Here, we examined how food restriction impacts energy usage and function in the primary visual cortex (V1) of adult male and female mice. Molecular analysis and RNA sequencing in V1 revealed that in males, but not in females, food restriction significantly modulated canonical, energy-regulating pathways, including pathways associated waith AMP-activated protein kinase, peroxisome proliferator-activated receptor alpha, mammalian target of rapamycin, and oxidative phosphorylation. Moreover, we found that in contrast to males, food restriction in females did not significantly affect V1 ATP usage or visual coding precision (assessed by orientation selectivity). Decreased serum leptin is known to be necessary for triggering energy-saving changes in V1 during food restriction. Consistent with this, we found significantly decreased serum leptin in food-restricted males but no significant change in food-restricted females. Collectively, our findings demonstrate that cortical function and energy usage in female mice are more resilient to food restriction than in males. The neocortex, therefore, contributes to sex-specific, energy-saving adaptations in response to food restriction.

Keywords: ATP; female; food restriction; leptin; mouse; neuroscience; sex-specificity; visual cortex.


Conflict of interest statement

ZP, DK, PM, MR, EO, NR No competing interests declared

Figures

Figure 1.
Figure 1.. Sex-specific impact of food restriction on weight loss and serum leptin.
(A) Animal weight across time. (B) Daily food intake (two-way analysis of variance [ANOVA]: CTR male vs. FR male; t = 4.81; df = 25; p < 0.0001; CTR male vs. CTR female; t = 0.013; df = 25; p = 0.99; CTR female vs. FR female; t = 6.59; df = 25; p < 0.0001; FR male vs. FR female; t = 1.93; df = 25; p = 0.07; n = 8 CTR males, 8 FR males, 7 CTR females, and 7 FR females). Percent reduction of food intake for food restriction is shown in red for each sex. (C) Animal weight (two-way ANOVA: CTR male vs. FR male; t = 11.36; df = 25; p < 0.0001; CTR female vs. FR female; t = 8.36; df = 25; p < 0.0001; n = 17 CTR males and 19 FR males; 23 CTR females and 11 FR females). (D) Serum leptin levels (two-way ANOVA: CTR male vs. FR male; t = 4.58; df = 66; p < 0.0001; CTR females vs. FR females; t = 1.00; df = 66; p = 0.32; n = 17 CTR males and 19 FR males; 23 CTR females and 11 FR females). (E) Left: AMP-activated protein kinase (AMPK) Thr172 phosphorylation, normalized by total AMPK, in primary visual cortex (V1) tissue (two-way ANOVA: CTR male vs. FR male; t = 2.28; df = 39; p = 0.022; CTR female vs. FR female; t = 0.64; df = 39; p = 0.11; n = 11 CTR males, 15 FR males, 11 CTR females, and 6 FR females). Right: Peroxisome proliferator-activated receptor alpha (PPARα) activity in V1 tissue, as assessed by levels of DNA binding, normalized to protein level (two-way ANOVA: CTR male vs. FR male; t = 4.81; df = 30; p = 0.013; CTR female vs. FR female; t = 0.0016; df = 30; p = 0.99; n = 5 CTR males, 11 FR males, n = 9 CTR females, and 9 FR females). ***p < 0.0001; *p < 0.05; n.s. = not significant. Error bars are standard error of the mean (SEM).
Figure 2.
Figure 2.. Cellular energy-regulating pathways are more robustly impacted by food restriction in males than in females.
(A) Schema of RNA sequencing of V1 tissue. (B) Volcano plot of fold change expression with food restriction vs. significance for all analysed genes; broken horizontal line denotes adjusted p < 0.1 significance level, below which non-significantly regulated expressed genes are marked by grey. Inset: Venn diagram showing the number of significantly differentially expressed genes with food restriction in males and females. (C) Gene Set Enrichment Analysis using Hallmark Gene Sets, depicted using a volcano plot of Enrichment Score vs. significance for males (left) and females (right); broken horizontal lines denotes adjusted p < 0.05 significance level. Inset: Venn diagram showing the number of significantly regulated gene sets with food restriction in males and females. (D) Complete list of significantly enriched gene sets by food restriction in males and females for analysis in C. Gene sets of interest are denoted by a box (oxidative phosphorylation: male; t = 0.48; p < 0.0001; female; t = −0.17; p = 0.96; mTORC1 signalling: male; t = 0.46; p < 0.0001; female; t = −0.18; p = 0.98; fatty acid metabolism: male; t = 0.43; p < 0.0001; t = 0.2; p = 0.88; PI3K/AKT/mammalian target of rapamycin (mTOR) signalling: male; t = 0.34; p = 0.027; female; t = 0.17; p = 0.98). All data from four CTR males, four FR males, four CTR females, and four FR females.
Figure 3.
Figure 3.. ATP usage and orientation selectivity in V1 are more robustly decreased by food restriction in males than in females.
(A) Schemata of ATP imaging experiment. Top: Example field of view of V1 layer 2/3 neurons in the ATeam1.03YEMK transgenic mouse (scale bar: 10 μm). Bottom: ATP synthesis inhibitors were used to isolate ATP usage, recorded as a decrease in FRET signal during presentation of natural, outdoor scenes. (B) Normalized ATeam1.03YEMK FRET signal in males and during presentation of natural, outdoor scenes. ATP synthesis inhibitors (arrow) were added to isolate ATP usage. Inset: Time to 50% decay of the ATeam1.03YEMK FRET signal (two-way analysis of variance [ANOVA]: t = 2.87; df = 37; p = 0. 0067; n = 11 CTR males and 10 FR males). (C) As in (B) but for females (inset: two-way ANOVA: t = 1.36; df = 37; p = 0.18; n = 12 CTR females and n = 8 FR females). (D) Top: Schema of two-photon imaging and sample field of view of V1 layer 2/3 neurons expressing GCaMP6s (scale bar: 10 μm). Bottom: Sample fluorescent signals (grey) from a selected neuron (black circle) in response to 6 drifting gratings of varying orientations. Trial averages are in black. Horizontal bar denotes 2 s grating presentation. (E) Mean orientation tuning curves normalized to the response to the preferred orientation for CTR and FR males (data from Padamsey et al., 2022). Note that −90° and +90° conditions correspond to the same visual stimulus. Inset: Orientation selectivity index (OSI; two-way ANOVA: t = 3.75; df = 27; p = 0.0009; n = 8 CTR and 8 FR males). (F) As in (E) but for females (Inset: two-way ANOVA: t = 1.90; df = 27; p = 0.08; n = 7 CTR females and 9 FR females). **p < 0.01; ***p < 0.001; n.s. = not significant. Error bars are standard error of the mean (SEM). Data from male mice are from a previously published dataset obtained under similar conditions (Padamsey et al., 2022).
Figure 3—figure supplement 1.
Figure 3—figure supplement 1.. ATP usage in visual cortex is not affected by food restriction in the absence of visual stimulation.
(A) Schemata of ATP imaging experiment in the absence of visual stimulation (dark screen). Top: Example field of view of V1 layer 2/3 neurons in the ATeam1.03YEMK transgenic mouse (scale bar: 10 μm). Bottom: ATP synthesis inhibitors were used to isolate ATP usage, recorded as a decrease in FRET signal. (B) Normalized ATeam1.03YEMK FRET signal in males in the absence of visual stimulation (dark screen). ATP synthesis inhibitors (arrow) were added to isolate ATP usage. Inset: Time to 50% decay of the ATeam1.03YEMK FRET signal (two-way analysis of variance [ANOVA]: t = 0.14; df = 24; p = 0.89; n = 8 CTR males and 6 FR males). (C) As in (B) but for females (inset: two-way ANOVA: t = 0.64; df = 37; p = 0.52; n = 8 CTR females and n = 8 FR females). n.s. = not significant. Error bars are standard error of the mean (SEM).
Figure 3—figure supplement 2.
Figure 3—figure supplement 2.. Pupil diameter during visual stimulation is not affected by sex or food restriction.
(A) Top: Sample camera image of pupil (red outline) during visual stimulation. Bottom: Pupil diameter during the presentation of drifting gratings. (B) Pupil diameter was comparable across sex and diet. To assess significance across sex, pupil data within a sex was pooled (across diet) (t-test: male vs. female; t = 0.82; df = 18; p = 0.42; n = 7 CTR males, 8 FR females, 1 CTR female, and 4 FR females). n.s. = not significant. Error bars are standard error of the mean (SEM). Data from male mice are from a previously published dataset obtained under similar conditions (Padamsey et al., 2022).
Figure 3—figure supplement 3.
Figure 3—figure supplement 3.. Bayes factor analysis reveals statistically robust impact of metabolic stress on V1 energy usage and visual coding in males, but not in females.
Bayes factor (BF10) along with quantified effect size and 95% confidence intervals (CIs) are shown for males (green) and females (purple). Across parameters, BF10 and effect sizes are greater for males than females, meaning that food restriction induces a more robust effect on visual cortical function and energy usage in males than females.

Update of

  • doi: 10.1101/2023.10.06.561185
  • doi: 10.7554/eLife.93052.1
  • doi: 10.7554/eLife.93052.2

Similar articles

References

    1. Ahima RS, Prabakaran D, Mantzoros C, Qu D, Lowell B, Maratos-Flier E, Flier JS. Role of leptin in the neuroendocrine response to fasting. Nature. 1996;382:250–252. doi: 10.1038/382250a0. - DOI - PubMed
    1. Andersson B, Xu XF, Rebuffé-Scrive M, Terning K, Krotkiewski M, Björntorp P. The effects of exercise, training on body composition and metabolism in men and women. International Journal of Obesity. 1991;15:75–81. - PubMed
    1. Attwell D, Laughlin SB. An energy budget for signaling in the grey matter of the brain. Journal of Cerebral Blood Flow & Metabolism. 2001;21:1133–1145. doi: 10.1097/00004647-200110000-00001. - DOI - PubMed
    1. Baar EL, Carbajal KA, Ong IM, Lamming DW. Sex‐ and tissue‐specific changes in mTOR signaling with age in C57BL/6J mice. Aging Cell. 2016;15:155–166. doi: 10.1111/acel.12425. - DOI - PMC - PubMed
    1. Baeza-Lehnert F, Saab AS, Gutiérrez R, Larenas V, Díaz E, Horn M, Vargas M, Hösli L, Stobart J, Hirrlinger J, Weber B, Barros LF. Non-canonical control of neuronal energy status by the Na+ Pump. Cell Metabolism. 2019;29:668–680. doi: 10.1016/j.cmet.2018.11.005. - DOI - PubMed

Associated data