. 2024 Sep;11(35):e2400063.
doi: 10.1002/advs.202400063. Epub 2024 Jul 8.

Tissue Mechanics and Hedgehog Signaling Crosstalk as a Key Epithelial-Stromal Interplay in Cancer Development

Affiliations

Tissue Mechanics and Hedgehog Signaling Crosstalk as a Key Epithelial-Stromal Interplay in Cancer Development

Shanika Karunasagara et al. Adv Sci (Weinh). 2024 Sep.

Abstract

Epithelial-stromal interplay through chemomechanical cues from cells and matrix propels cancer progression. Elevated tissue stiffness in potentially malignant tissues suggests a link between matrix stiffness and enhanced tumor growth. In this study, employing chronic oral/esophageal injury and cancer models, it is demonstrated that epithelial-stromal interplay through matrix stiffness and Hedgehog (Hh) signaling is key in compounding cancer development. Epithelial cells actively interact with fibroblasts, exchanging mechanoresponsive signals during the precancerous stage. Specifically, epithelial cells release Sonic Hh, activating fibroblasts to produce matrix proteins and remodeling enzymes, resulting in tissue stiffening. Subsequently, basal epithelial cells adjacent to the stiffened tissue become proliferative and undergo epithelial-to-mesenchymal transition, acquiring migratory and invasive properties, thereby promoting invasive tumor growth. Notably, transcriptomic programs of oncogenic GLI2, mechano-activated by actin cytoskeletal tension, govern this process, elucidating the crucial role of non-canonical GLI2 activation in orchestrating the proliferation and mesenchymal transition of epithelial cells. Furthermore, pharmacological intervention targeting tissue stiffening proves highly effective in slowing cancer progression. These findings underscore the impact of epithelial-stromal interplay through chemo-mechanical (Hh-stiffness) signaling in cancer development, and suggest that targeting tissue stiffness holds promise as a strategy to disrupt chemo-mechanical feedback, enabling effective cancer treatment.

Keywords: cancer development; chemomechanical cues; epithelial–stroma interplay; hedgehog; tissue stiffness.


Conflict of interest statement

The authors declare no conflict of interest.

Figures
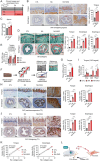
Figure 1
Figure 1
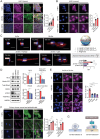
Hedgehog (Hh) signaling increases matrix stiffness which, in turn, activates epithelial YAP and GLI2 during chronic tongue/esophageal injury. A) The in vivo study design and timeline consisted of 8 weeks of exposure to 4‐NQO and arecoline (NA) in drinking water with (n = 5) or without (n = 6) 3 weeks of additional treatment with Smoothened agonist (SAG, 25 mg kg−1 day−1, twice a week, n = 5) via oral gavage. Age and sex‐matched mice (n = 3) that consumed plain water throughout the experimental period were used as the control (“CTL”) group. B) Immunohistochemistry (IHC) for Sonic Hedgehog (SHH) in the tongue and esophagus of CTL, NA, and NA+SAG‐treated mice. The average percentages of SHH‐expressing (SHH+) epithelial cells were quantified. Scale bars = 50 µm (tongue), 200 µm (esophagus), 20 µm (inset). (C) Serum levels of SHH in the mice. D) Sirius red (SR) staining and quantification of the relative collagen area in the tongue and esophageal tissue sections of CTL, NA, and NA+SAG groups. Scale bar = 200 µm. E) qRT‐PCR analysis for Lox and Loxl2 genes in the tongue. F) Stiffness measurement procedure of mouse tongue specimens using nanoindentation. The measurement was performed on stromal regions identified using reference SR‐stained sections. G) The stiffness of mouse tongue tissues expressed in kilopascals (kPa). H) IHC for the presence of nuclear YAP‐expressing (YAP+) epithelial cells in the tongue and esophagus. The average percentage of nuclear YAP+ epithelial cells were quantified. Scale bars = 200 µm, 20 µm (inset). TF, transcription factor. I) qRT‐PCR analysis for the expression of YAP target genes (Areg, Ctgf, Ptgs2) in the tongue. J) IHC for nuclear GLI2‐expressing (GLI2+) epithelial cells in the tongue and esophagus. The average percentage of nuclear GLI2+ epithelial cells was quantified. Scale bars = 50 µm (tongue), 200 µm (esophagus), 20 µm (inset). The data are expressed as the mean ± standard error of mean (s.e.m.) from all individuals in each group. Statistical analysis involved one‐way analysis of variance (ANOVA) followed by post hoc Tukey's or Dunnett's test. Statistical significance was indicated by p‐values< 0.05, with varying numbers of asterisks denoting the levels of significance (*p <  0.05; **p <  0.01; ***p  <  0.001; and ****p <  0.0001). Representative images are shown for SR, IHC, and IF. K) Scatter plots showing the correlation between the relative collagen area and the percentage of nuclear GLI2+ epithelial cells in tongue and esophagus. Simple regression analysis was employed. L) Active interactions between epithelial cells and fibroblasts in the precancerous condition, involving the reciprocal exchange of chemical and mechanical signals. The SHH signaling originating from epithelial cells triggers the activation of fibroblasts, prompting their transformation into myofibroblasts responsible for generating collagens and enzymes, such as LOX, which contribute to the stiffening of extracellular matrix (ECM). Simultaneously, epithelial cells are responsive to the increased stiffness of the ECM, driving nuclear translocation of GLI2.
Figure 2
Figure 2
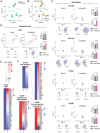
Increased matrix stiffness promotes GLI2 activation through RhoA/ROCK/p‐MLC axis‐mediated actin cytoskeletal tension. A) Representative confocal images depicting nuclei (blue), GLI2 (magenta), and F‐actin (green) in HSC3 cells cultured on soft (5 kPa), stiff (20 kPa) hydrogels, or glass (≈ GPa) substrate. The nuclear to cytoplasmic ratios (Nuc/Cyt) of GLI2 expression were quantified. Scale bar = 20 µm. B) Representative confocal images and quantification of GLI2 expression in iHOK cells cultured on 5 or 20 kPa hydrogels, or glass substrate. Scale bar = 20 µm. C) The nuclear flattening index (NFI) was calculated by dividing the length of the major axis (a) of a spheroid‐shaped nucleus by its height (c), where a higher NFI value signifies greater nuclear flattening. Representative images of HSC3 cells stained for F‐actin (red) and nuclei (blue) were shown under defined conditions. Scale bar = 20 µm. D) Immunoblots showing GLI2, RhoA‐GTP, total RhoA, ROCK, phosphorylated MLC (p‐MLC), total MLC, and GAPDH as a loading control in HSC3 cells treated with GANT61 or Y27632 compared to the vehicle (Veh). E) IF images of GLI2 (magenta) and DAPI (blue) staining in the presence of the inhibitors GANT61, Y27632 or LatA relative to the Veh. Scale bar = 20 µm. The mean ± s.e.m. results are presented. Statistical analysis involved one‐way ANOVA followed by post hoc Tukey's or Dunnett's test for multiple group comparisons (*p  <  0.05; **p  < 0.01; ***p <  0.001; and ****p  <  0.0001). F) Representative confocal images depicting GLI2 (magenta), F‐actin (green), and DAPI (blue) staining in primary oral epithelial cells isolated from human normal gingival mucosal tissues cultured on either 5 or 20 kPa hydrogels, or glass substrates. Analysis of GLI2 expression and nuclear flattening was conducted as illustrated above. Scale bar = 10 µm. G) Enhanced matrix stiffness promotes the nuclear translocation of GLI2 within epithelial cells through the orchestration of actin polymerization and activation of the Rho/ROCK/MLC signaling pathway. This activation results in heightened tension within the actomyosin cytoskeleton. The reinforcement of cell‐ECM adhesions plays an important role in sensing the elevated matrix stiffness and mediating the mechanotransduction.
Figure 3
Figure 3
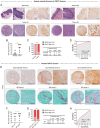
Epithelial cells acquire GLI2‐dependent proliferative and migratory capabilities during tongue/esophageal epithelial dysplasia. A) Confocal images and quantification of EdU (green) stained nuclei in HSC3 cells cultured on 5 or 20 kPa hydrogels, with or without GANT61 (15 × 10−6 m) treatment for 24 h. Scale bar = 20 µm. B) A schematic illustration demonstrating collective migration assay involving confined cell seeding on MeHA hydrogels with different stiffness levels. PDMS, polydimethylsiloxane. C) Brightfield images illustrating the migration of HSC3 cells on MeHA hydrogels with different stiffness levels, with or without GANT61 treatment. The images display the initial (green lines) and final (blue lines) positions of cells after 18 h of migration. The migration speed was measured for each condition and is represented as box and whisker plots, displaying all data points from the minimum to the maximum values. Scale bar = 100 µm. D) IHC for nuclear Ki67+ epithelial cells and the percentage in the tongue and esophagus of CTL, NA, and NA+SAG mice. Scale bar = 200 µm, 20 µm (inset). E) IHC for α‐SMA+ epithelial cells and the area in the tongue and esophagus of the mice. Scale bar = 200 µm, 20 µm (inset). qRT‐PCR analysis for the expression of F) proliferation markers (Pcna, Ccnd1) and G) mesenchymal markers (Vim, Acta2, Snail1, Zeb1). The mean ± s.e.m. results are displayed. Statistical analysis involved one‐way ANOVA followed by post hoc Tukey's or Dunnett's test for multiple group comparisons (*p  < 0.05; **p <  0.01; ***p <  0.001; and ****p  <  0.0001). Representative images are shown.
Figure 4
Figure 4
Spatial transcriptomics analysis reveals the mechanobiological dialogues between epithelial cells and fibroblasts during a precancerous condition in the human tongue. A) The diagram illustrates the workflow of the spatial transcriptomics analysis conducted on a cryosection of a leukoplakia lesion in the human tongue. B) The Visium array spots on the tissue section are color‐coded based on the number of normalized unique molecular identifiers (UMIs, left) or total genes (right) in the dataset. C) The Visium array spots are colored based on the clustering assignments generated from the dataset. A total of 11 clusters were identified, including E(K)1 and E(K2) (epithelial keratinocyte clusters 1 and 2, respectively), E(D)1 and E(D)2 (differentiating epithelial cell clusters 1 and 2), E(B) (basal epithelial cell cluster), F1 and F2 (fibroblast clusters 1 and 2), M1 and M2 (muscle cell clusters 1 and 2), and O1 and O2 (unspecified, others 1 and 2). D) The spatial transcriptomics spots are visualized using a UMAP embedding, with colors representing the cluster assignments. E) The average standardized expression of annotated genes associated with gene ontology (GO) terms exhibiting spatially coherent expression patterns within each cluster is displayed. The expression levels are depicted using a color gradient, ranging from low (blue) to high (red). F–H) Cell‐cell communication analysis reveals significant collagen and TGF‐β signaling between epithelial cells and fibroblasts in the dataset. F) The circle plot illustrates the communication score between interacting cell clusters, with line thickness indicating the strength of communication. G) The heatmap depicts the sender‐receiver interaction matrix, where rows and columns represent sources and targets, respectively. The bar plots on the right and top represent the total outgoing and incoming interaction scores, respectively. H) The relative contribution of ligand (L)–receptor (R) pairs involved in the communication is shown. SDC, syndecan; ITGA, integrin subunit alpha; ITGB, integrin subunit beta.
Figure 5
Figure 5
Single‐nucleus RNA sequencing (snRNA‐seq) shows that epithelial cells expressing GLI2 acquire specific gene expression patterns and alterations in molecular signatures associated with cancer. A) The integrated UMAP plot combines the snRNA‐seq datasets of normal and leukoplakia samples, displaying the cellular landscape in a reduced‐dimensional space. B) The snRNA‐seq cluster assignments are visualized in UMAP space, indicating the different cell clusters present in the dataset. C) The expression of myofibroblast‐related genes (ACTA2, COL1A1, LOXL1, TGFB1) is shown for fibroblast clusters (cluster 0 and 9) in the snRNA‐seq dataset. The pie charts represent the percentage of positive nuclei for each gene within the respective cluster. The bar plots indicate the mean rank± s.e.m. for gene expression. Statistical significance was determined using the Mann‐Whitney U test, with a p‐value threshold of less than 0.05. D) The expression of GLI2 is visualized in the epithelial cell clusters (cluster 1 and 5) in the snRNA‐seq dataset. E) The heatmap visualizes the different gene profiles between GLI2‐positive and GLI2‐negative epithelial cells in leukoplakia (p < 0.05). DEG, differentially expressed gene. F) Heatmaps depict the expression of genes associated with GO terms enriched in GLI2‐expressing epithelial cells. The color gradient represents the expression levels, ranging from downregulated (blue) to upregulated (red) expression specifically in GLI2‐expressing cells.
Figure 6
Figure 6
Extracellular matrix (ECM) softening by inhibiting collagen crosslinking reduces collagen contents and inhibits the activation of YAP and GLI2. A) The in vivo study design and timeline schematically illustrating a 16‐week exposure to NA with (n = 6) or without (n = 6) additional administration of BAPN (100 mg kg−1 day−1, twice a week), a LOX inhibitor, via intraperitoneal injection during the last 8 weeks, followed by a 10‐week developmental period without any further exposure to NA. The control (CTL) group consisted of age and sex‐matched mice (n = 3) that consumed plain water throughout the experimental period. B) qRT‐PCR for the Lox gene in the tongue of CTL, NA, and NA+BAPN mice. C) SR staining and quantification of the relative collagen area in the tongue and esophageal tissue sections of the mice. Scale bar = 200 µm, 20 µm (inset). D,E) IHC for nuclear YAP+ (D) and nuclear GLI2+ (E) epithelial cells in the tongue and esophagus of CTL, NA, and NA+BAPN mice. Scale bar = 200 µm, 20 µm (inset). TF, transcription factor. F) qRT‐PCR for the YAP target genes (Areg, Ptgs2, Ctgf), Gli2, and GLI2‐associated genes (Tgf‐β1, Tgfbr1, Rock1). The data presented represent the mean ± s.e.m. from all individuals within each group. Statistical analysis involved one‐way ANOVA followed by post hoc Tukey's or Dunnett's test (*p  <  0.05; **p <  0.01; ***p < 0.001; and ****p  <  0.0001). Representative images are shown for SR and IHC.
Figure 7
Figure 7
ECM softening slows the progression of tongue/esophageal SCC in mice. A) Hematoxylin and eosin (H&E) staining in the tongue and esophageal tissue sections of CTL, NA, and NA+BAPN mice. Scale bar = 200 µm. B) IHC for pan keratin in the tongue and esophageal tissue sections of the mice. Scale bar = 200 µm. IHC for C) Ki67 and D) α‐SMA and quantification of nuclear Ki67+ epithelial cells and α‐SMA+ epithelial cell area in the tongue and esophagus of the mice. Scale bars = 200 µm, 20 µm (inset). E,F) qRT‐PCR for the expression of E) proliferation marker genes (Pcna, Ccnb1, Ccnd1) and F) EMT‐related genes (Cdh1, Cdh2, Snai1, Zeb1, Acta2, Twist1, Vim) in the tongue of CTL, NA, and NA+BAPN mice. The data are expressed as mean ± s.e.m. (n = 3 or 6 mice per group). Statistical analysis involved one‐way ANOVA followed by post hoc Tukey's or Dunnett's test (*p < 0.05; **p  <  0.01; ***p  <  0.001; and ****p <  0.0001). Representative images are shown for H&E and IHC.
Figure 8
Figure 8
Nuclear GLI2 expression is closely associated with collagen accumulation in patients with OSCC. A) Representative images of H&E staining provided by TissueArray.Com. and IHC for GLI2 in tissue microarrays of human normal oral mucosal and OSCC tissues. B) The IHC scores for nuclear GLI2 expression, ranging from 0 to 9, for normal (n = 33) and tumor (n = 260) tissues. The mean mean ± s.e.m. results are displayed, and the Mann‐Whitney U test was conducted for statistics (****p <  0.0001). C) The proportions of tissue microarray cases grouped by low (≤ 4) or high (> 4) GLI2 expression in normal and tumor tissues. A table indicates the number of cases in each group. Chi‐square test was used for statistics (****p <  0.0001). D) ROC curves and the area under curve (AUC) value of high nuclear GLI2 expression for distinguishing OSCC tumors from normal tissues. E) Representative images of IHC for GLI2 or SR staining in serial sections of tissue microarrays of human OSCC tissues, showcasing varying GLI2 intensity scores (ranging from 0 to 3) and SR scores (ranging from 1 to 3). F) The IHC scores for nuclear GLI2 (ranging from 0 to 9) for OSCC tumor tissues with low SR scores (SR_low, ≤ 1) or high SR scores (SR_high, > 1). The mean ± s.e.m. results are displayed, and the Mann‐Whitney U test was performed (*p <  0.05). G) The proportions of tissue microarray cases grouped based on low (≤ 4) or high (> 4) GLI2 expression in cases with low SR scores (SR_low, ≤ 1) or high SR scores (SR_high, > 1). A table indicates the number of cases in each group. Chi‐square test was conducted (**p = 0.003). (H) The AUC of the ROC of high SR score in distinguishing OSCC tumors with high GLI2 expression from tumors with low GLI2 expression. Scale bars indicate the specified length (µm) under the bars.
Figure 9
Figure 9
Schematic diagram of the mechanism by which stiffened matrices promote carcinogenesis through non‐canonical Hedgehog signaling. The diagram highlights the key events and signaling interactions that contribute to the transition from premalignant lesions in mucosal tissues to malignant carcinoma. Injured epithelial cells release Sonic Hedgehog (SHH), which is a ligand of the Hh signaling pathway. SHH promotes the activation of myofibroblasts, which in turn produce collagen and collagen‐remodeling enzymes like LOX, resulting in increased extracellular matrix (ECM) stiffness. Basal epithelial cells sense the increased ECM stiffness and enhance the formation of cell‐ECM adhesions mediated by collagen receptors such as CD44, Syndecans, and integrins. These cell–ECM adhesions are closely associated with actin polymerization and actomyosin cytoskeletal contractility. Myosin light chain kinase (MLCK) is involved in the regulation of MLC phosphorylation, contributing to actomyosin contractility. Importantly, these processes facilitate the nuclear translocation of GLI2, an oncogenic transcription factor, in response to the stiffened matrix. Within the nucleus, GLI2 orchestrates transcriptomic programs that drive cancer‐like transformations in epithelial cells, including enhanced cell proliferation and epithelial‐to‐mesenchymal transition (EMT). Consequently, epithelial cells lose cell‐cell junctions and acquire migratory and invasive properties, promoting the growth of invasive carcinoma. The diagrams provide a comprehensive overview of the complex interactions and molecular events in the progression of carcinogenesis, shedding light on the role of matrix stiffness and non‐canonical Hh signaling in this process.

References

    1. a) Kalluri R., Nat. Rev. Cancer 2016, 16, 582; - PubMed
    2. b) Chen Y., McAndrews K. M., Kalluri R., Nat. Rev. Clin. Oncol. 2021, 18, 792. - PMC - PubMed
    1. Sahai E., Astsaturov I., Cukierman E., DeNardo D. G., Egeblad M., Evans R. M., Fearon D., Greten F. R., Hingorani S. R., Hunter T., Nat. Rev. Cancer 2020, 20, 174. - PMC - PubMed
    1. Walker C., Mojares E., del Río Hernández A., Int. J. Mol. Sci. 2018, 19, 3028. - PMC - PubMed
    1. a) Rybinski B., Franco‐Barraza J., Cukierman E., Physiol. Genomics 2014, 46, 223; - PMC - PubMed
    2. b) Affo S., Yu L. X., Schwabe R. F., Annu. Rev. Pathol. 2017, 12, 153; - PMC - PubMed
    3. c) Baglieri J., Brenner D. A., Kisseleva T., Int. J. Mol. Sci. 2019, 20, 1723; - PMC - PubMed
    4. d) Huang C., Iovanna J., Santofimia‐Castaño P., Int. J. Mol. Sci. 2021, 22, 4970; - PMC - PubMed
    5. e) Oya Y., Hayakawa Y., Koike K., Cancer Sci. 2020, 111, 2696. - PMC - PubMed
    1. a) Mazur A., Holthoff E., Vadali S., Kelly T., Post S. R., PLoS One 2016, 11, e0150287; - PMC - PubMed
    2. b) Perri R. T., Kay N. E., McCarthy J., Vessella R. L., Jacob H. S., Furcht L. T., Blood 1982, 60, 430; - PubMed
    3. c) Stahl M., Schupp J., Jäger B., Schmid M., Zissel G., Müller‐Quernheim J., Prasse A., PLoS One 2013, 8, e81382; - PMC - PubMed
    4. d) Jiang H., Hegde S., DeNardo D. G., Cancer Immunol. Immunother. 2017, 66, 1037. - PMC - PubMed

Substances

LinkOut - more resources