Dual species transcriptomics reveals conserved metabolic and immunologic processes in interactions between human neutrophils and Neisseria gonorrhoeae
- PMID: 38976720
- PMCID: PMC11257400
- DOI: 10.1371/journal.ppat.1012369
Dual species transcriptomics reveals conserved metabolic and immunologic processes in interactions between human neutrophils and Neisseria gonorrhoeae
Abstract
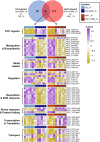
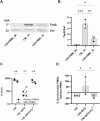
Neisseria gonorrhoeae (the gonococcus, Gc) causes the sexually transmitted infection gonorrhea. Gc is a prominent threat to human health by causing severe lifelong sequelae, including infertility and chronic pelvic pain, which is amplified by the emergence of "superbug" strains resistant to all current antibiotics. Gc is highly adapted to colonize human mucosal surfaces, where it survives despite initiating a robust inflammatory response and influx of polymorphonuclear leukocytes (PMNs, neutrophils) that typically clear bacteria. Here, dual-species RNA-sequencing was used to define Gc and PMN transcriptional profiles alone and after infection. Core host and bacterial responses were assessed for two strains of Gc and three human donors' PMNs. Comparative analysis of Gc transcripts revealed overlap between Gc responses to PMNs, iron, and hydrogen peroxide; 98 transcripts were differentially expressed across both Gc strains in response to PMN co-culture, including iron-responsive and oxidative stress response genes. We experimentally determined that the iron-dependent TbpB is suppressed by PMN co-culture, and iron-limited Gc have a survival advantage when cultured with PMNs. Analysis of PMN transcripts modulated by Gc infection revealed differential expression of genes driving cell adhesion, migration, inflammatory responses, and inflammation resolution pathways. Production of pro-inflammatory cytokines, including IL1B and IL8, the adhesion factor ICAM1, and prostaglandin PGE2 were induced in PMNs in response to Gc. Together, this study represents a comprehensive and experimentally validated dual-species transcriptomic analysis of two isolates of Gc and primary human PMNs that gives insight into how this bacterium survives innate immune onslaught to cause disease.
Copyright: © 2024 Potter et al. This is an open access article distributed under the terms of the Creative Commons Attribution License, which permits unrestricted use, distribution, and reproduction in any medium, provided the original author and source are credited.
Conflict of interest statement
The authors have declared that no competing interests exist.
Figures


Similar articles
-
Transcriptome-guided metabolic network analysis reveals rearrangements of carbon flux distribution in Neisseria gonorrhoeae during neutrophil co-culture.mSystems. 2023 Aug 31;8(4):e0126522. doi: 10.1128/msystems.01265-22. Epub 2023 Jun 30. mSystems. 2023. PMID: 37387581 Free PMC article.
-
Neisseria gonorrhoeae scavenges host sialic acid for Siglec-mediated, complement-independent suppression of neutrophil activation.mBio. 2024 May 8;15(5):e0011924. doi: 10.1128/mbio.00119-24. Epub 2024 Apr 9. mBio. 2024. PMID: 38587424 Free PMC article.
-
Neisseria gonorrhoeae metalloprotease NGO1686 is required for full piliation, and piliation is required for resistance to H2O2- and neutrophil-mediated killing.mBio. 2013 Jul 9;4(4):e00399-13. doi: 10.1128/mBio.00399-13. mBio. 2013. PMID: 23839218 Free PMC article.
-
Pathogenesis of Neisseria gonorrhoeae in the female reproductive tract: neutrophilic host response, sustained infection, and clinical sequelae.Curr Opin Hematol. 2018 Jan;25(1):13-21. doi: 10.1097/MOH.0000000000000394. Curr Opin Hematol. 2018. PMID: 29016383 Free PMC article. Review.
-
Antibiotics for treating gonorrhoea in pregnancy.Cochrane Database Syst Rev. 2018 Feb 21;2(2):CD011167. doi: 10.1002/14651858.CD011167.pub2. Cochrane Database Syst Rev. 2018. PMID: 29465747 Free PMC article.
Cited by
-
Dinner date: Neisseria gonorrhoeae central carbon metabolism and pathogenesis.Emerg Top Life Sci. 2024 Feb 22;8(1):15-28. doi: 10.1042/ETLS20220111. Emerg Top Life Sci. 2024. PMID: 37144661 Free PMC article. Review.
-
High-dimensional spectral flow cytometry of activation and phagocytosis by peripheral human polymorphonuclear leukocytes.bioRxiv [Preprint]. 2024 Dec 5:2024.12.01.626241. doi: 10.1101/2024.12.01.626241. bioRxiv. 2024. Update in: J Leukoc Biol. 2025 Apr 23;117(4):qiaf025. doi: 10.1093/jleuko/qiaf025. PMID: 39677791 Free PMC article. Updated. Preprint.
-
High-dimensional spectral flow cytometry of activation and phagocytosis by peripheral human polymorphonuclear leukocytes.J Leukoc Biol. 2025 Apr 23;117(4):qiaf025. doi: 10.1093/jleuko/qiaf025. J Leukoc Biol. 2025. PMID: 40036255
-
Transcriptome-guided metabolic network analysis reveals rearrangements of carbon flux distribution in Neisseria gonorrhoeae during neutrophil co-culture.mSystems. 2023 Aug 31;8(4):e0126522. doi: 10.1128/msystems.01265-22. Epub 2023 Jun 30. mSystems. 2023. PMID: 37387581 Free PMC article.
References
-
- CDC. Sexually Transmitted Disease Surveillance 2018. Atlanta: U.S.: 2019. doi: 10.15620/cdc.79370 - DOI
-
- WHO. Sexually transmitted infections (STIs). Available from: https://www.who.int/news-room/fact-sheets/detail/sexually-transmitted-in....
MeSH terms
Grants and funding
LinkOut - more resources
Full Text Sources
Medical
Molecular Biology Databases
Miscellaneous

