. 2024 Jul 16;121(29):e2321408121.
doi: 10.1073/pnas.2321408121. Epub 2024 Jul 8.

Mutant androgen receptor induces neurite loss and senescence independently of ARE binding in a neuronal model of SBMA

Affiliations

Mutant androgen receptor induces neurite loss and senescence independently of ARE binding in a neuronal model of SBMA

Jordyn Karliner et al. Proc Natl Acad Sci U S A. .

Abstract

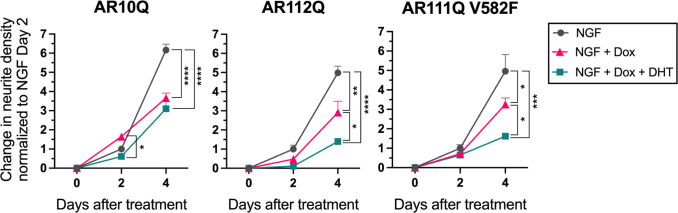
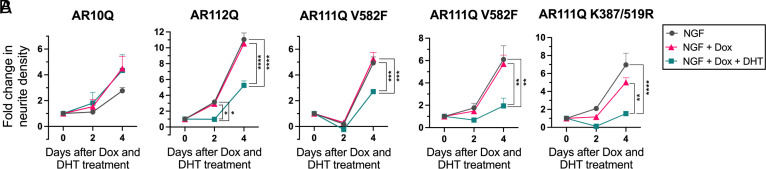
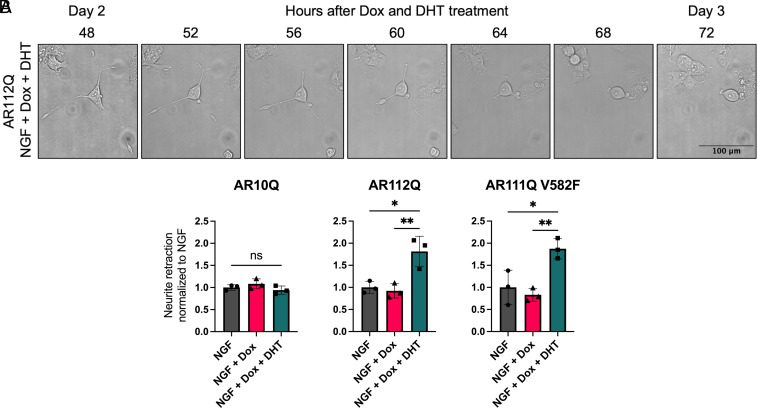
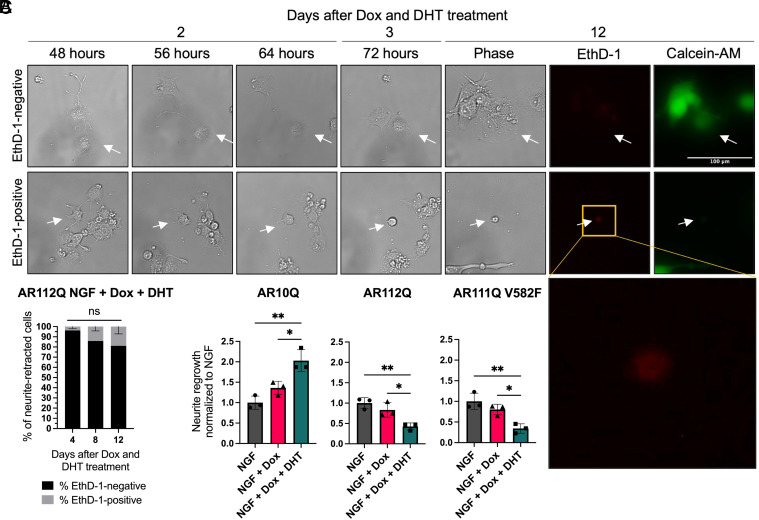
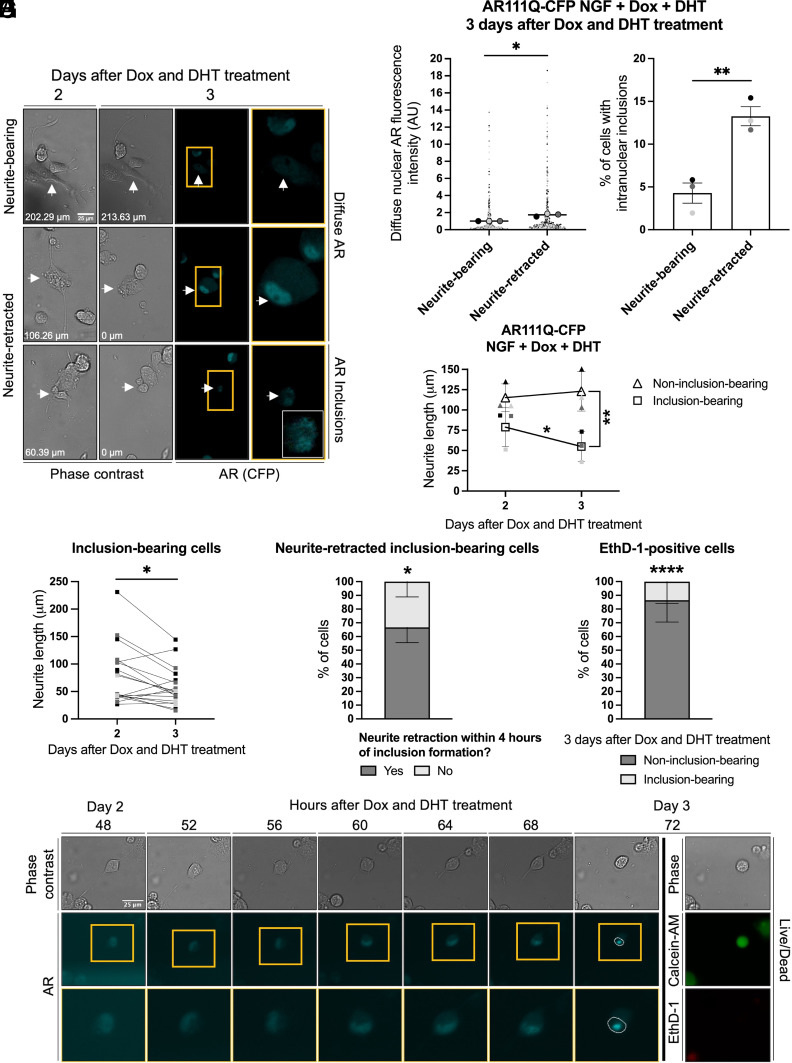
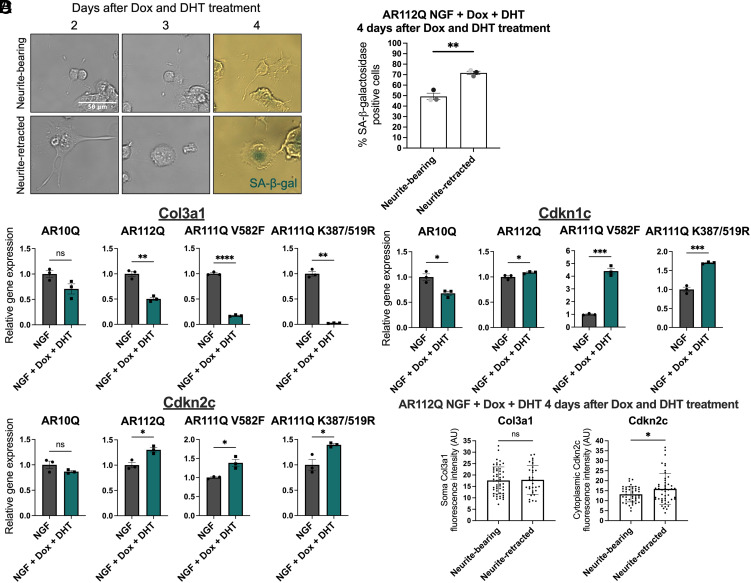
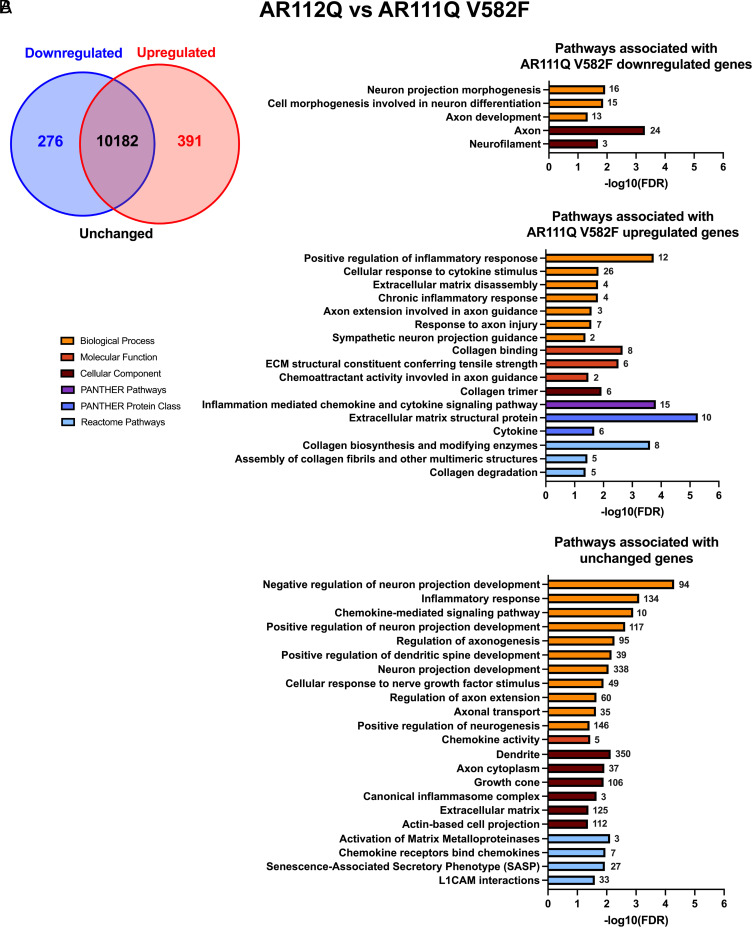
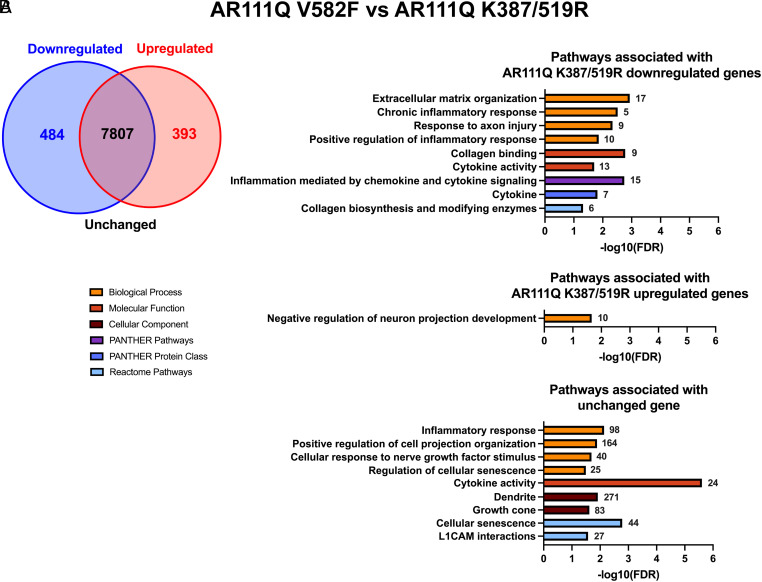
Spinal and bulbar muscular atrophy (SBMA) is a slowly progressing neuromuscular disease caused by a polyglutamine (polyQ)-encoding CAG trinucleotide repeat expansion in the androgen receptor (AR) gene, leading to AR aggregation, lower motor neuron death, and muscle atrophy. AR is a ligand-activated transcription factor that regulates neuronal architecture and promotes axon regeneration; however, whether AR transcriptional functions contribute to disease pathogenesis is not fully understood. Using a differentiated PC12 cell model of SBMA, we identified dysfunction of polyQ-expanded AR in its regulation of neurite growth and maintenance. Specifically, we found that in the presence of androgens, polyQ-expanded AR inhibited neurite outgrowth, induced neurite retraction, and inhibited neurite regrowth. This dysfunction was independent of polyQ-expanded AR transcriptional activity at androgen response elements (ARE). We further showed that the formation of polyQ-expanded AR intranuclear inclusions promoted neurite retraction, which coincided with reduced expression of the neuronal differentiation marker β-III-Tubulin. Finally, we revealed that cell death is not the primary outcome for cells undergoing neurite retraction; rather, these cells become senescent. Our findings reveal that mechanisms independent of AR canonical transcriptional activity underly neurite defects in a cell model of SBMA and identify senescence as a pathway implicated in this pathology. These findings suggest that in the absence of a role for AR canonical transcriptional activity in the SBMA pathologies described here, the development of SBMA therapeutics that preserve this activity may be desirable. This approach may be broadly applicable to other polyglutamine diseases such as Huntington's disease and spinocerebellar ataxias.

Keywords: SBMA; neurite; senescence; transcription.


Conflict of interest statement

Competing interests statement:The authors declare no competing interest.

Figures

Fig. 1.
Fig. 1.
Hormone-bound polyQ-expanded AR inhibits neurite outgrowth, independent of AR DNA binding. Change in neurite density from 0 to 4 d of NGF, Dox, and DHT treatment, normalized to NGF day 2 for AR10Q, AR112Q, and AR111Q V582F cell lines. Data represent mean ± SEM from three wells per treatment condition, representative of three independent experiments. *P < 0.05, **P < 0.01, ***P < 0.001, and ****P < 0.0001, two-way mixed model ANOVA with Tukey’s multiple comparison test.
Fig. 2.
Fig. 2.
Hormone-bound polyQ-expanded AR induces neurite loss, independent of AR DNA binding. (A) Fold change in neurite density from 0 to 4 d of Dox and DHT treatment of differentiated AR10Q, AR112Q, and AR111Q V582F cells. (B) Fold change in neurite density from 0 to 4 d of Dox and DHT treatment of differentiated AR111Q V582F and AR111Q K387/519R cells. Data are mean ± SEM from four wells per treatment condition for the AR10Q cell line, and three wells per treatment condition for all other cell lines (sample size determined by power analysis), representative of three independent experiments. *P < 0.05, **P < 0.01, ***P < 0.001, and ****P < 0.0001, two-way mixed model ANOVA with Tukey’s multiple comparison test.
Fig. 3.
Fig. 3.
Hormone-bound polyQ-expanded AR significantly increases neurite retraction, independent of AR DNA binding. (A) Representative phase-contrast images of a differentiated PC12 cell expressing hormone-bound AR112Q retracting its neurites over 24 h. (Scale bar, 100 µm.) (B) Quantification of neurite retraction normalized to NGF for AR10Q, AR112Q, and AR111Q V582F cell lines. Data represent mean ± SD from three wells per treatment condition, with an average of 41 cells analyzed per well, representative of three independent experiments. ns P > 0.05, *P < 0.05, and **P < 0.01, one-way ANOVA with Tukey’s multiple comparison test.
Fig. 4.
Fig. 4.
Hormone-bound polyQ-expanded AR does not induce significant cell death following neurite retraction but inhibits neurite regrowth, independent of AR DNA binding. (A and B) Survival analysis of hormone-bound AR112Q-expressing cells that retracted their neurites 3 d after Dox and DHT treatment. (A) Representative images of neurite-retracted hormone-bound AR112Q-expressing cells (white arrows) that were EthD-1-negative (Top) or EthD-1-positive (Bottom) 12 d after Dox and DHT treatment. The EthD-1-negative cell developed an enlarged and flattened morphology and stained positive for the live cell marker Calcein-AM. The gold box is an enlargement of the EthD-1 image. (Scale bar, 100 µm.) (B) Percentage of neurite-retracted hormone-bound AR112Q-expressing cells that were EthD-1-negative or EthD-1-positive 4 (n = 66), 8 (n = 44), and 12 (n = 29) d after Dox and DHT treatment. Data represent mean ± SEM from three wells for each time point. ns P > 0.05, 2-way ANOVA with Šídák’s multiple comparisons test. (C) Cells with retracted neurites 3 d after Dox and DHT treatment were tracked through live cell imaging for an additional 24 h. The percentage of cells that regrew their neurites by 4 d of Dox and DHT treatment was quantified and normalized to the NGF condition for each cell line. Data represent mean ± SD from three wells per treatment condition, with an average of 20 cells analyzed per well, representative of three independent experiments. *P < 0.05 and **P < 0.01, one-way ANOVA with Tukey’s multiple comparison test.
Fig. 5.
Fig. 5.
Increased diffuse nuclear AR and intranuclear inclusions are associated with neurite retraction. PC12 cells were differentiated, treated with Dox to induce expression of AR111Q-CFP and 10 nM DHT, and underwent live-cell imaging to analyze neurite retraction, nuclear AR fluorescence intensity, AR inclusions, and cell survival. (A) Representative phase-contrast images of neurite-bearing cells 2 d after Dox and DHT treatment with phase-contrast and fluorescence images (cyan, AR) of the same cells 24 h later. Total neurite lengths (µm) of the cells are shown. An enlarged and enhanced image with increased brightness and contrast of the CFP channel is included for the neurite-retracted, inclusion-bearing cell. (Scale bar, 25 µm.) (B) Diffuse nuclear AR fluorescence intensity (mean gray value; normalized to background) of neurite-bearing and neurite-retracted cells 3 d after Dox and DHT treatment. Each point represents a single cell (neurite-bearing, n = 405 cells; neurite-retracted, n = 353 cells), and each large circle (line at mean) represents the average fluorescence intensity from an individual experiment. Fluorescence intensities were normalized to the average fluorescence intensity in neurite-bearing cells. *P < 0.05, Welch’s t test. (C) Percentage of neurite-bearing and neurite-retracted cells with intranuclear inclusions 3 d after Dox and DHT treatment. Data represent mean ± SEM, and each point represents the average percentage from an individual experiment, with an average of 271 cells analyzed per experiment. **P < 0.01, independent samples t test. (D) Total neurite lengths (µm) of single inclusion-bearing (square, n = 18 cells) and non-inclusion-bearing (triangle, n = 244 cells) cells were quantified 2 and 3 d after Dox and DHT treatment. Small filled symbols represent the average neurite lengths quantified in an individual experiment; large open symbols represent mean ± SD from three independent experiments. *P < 0.05 and **P < 0.01, two-way repeated measures ANOVA with Šídák's multiple comparisons test. (E) Neurite lengths (µm) of single inclusion-bearing cells (n = 18 cells) 2 and 3 d after Dox and DHT treatment. Data are from three independent experiments. *P < 0.05, paired t test. (F) Percentage of cells that fully retracted their neurites within 4 h of forming AR inclusions. Data represent mean ± SD from three independent experiments, n = 27 cells. *P < 0.05, independent samples t test. (G) Percentage of EthD-1-positive cells 3 d after Dox and DHT treatment that were inclusion-bearing or non-inclusion-bearing. Data represent mean ± SD from two independent experiments, n = 71 cells. ****P < 0.0001, independent samples t test. (H) Representative images of a neurite-bearing hormone-bound AR111Q-CFP-expressing cell retracting its neurites (phase contrast image, Top row) and simultaneously developing an AR inclusion [cyan fluorescence image, Middle row (Bottom row = enlargement of image within gold box)] 3 d after Dox and DHT treatment. The white circle denotes the outline of the nucleus. At 3 d, the cell stained positive for the live cell marker Calcein-AM (green) but not the dead cell marker EthD-1 (red). (Scale bar, 25 µm.)
Fig. 6.
Fig. 6.
Hormone-bound polyQ-expanded AR induces senescence in differentiated PC12 cells. (A) Representative images of neurite-bearing and neurite-retracted AR112Q-expressing cells stained for SA-β-galactosidase (SA-β-gal, blue) 4 d after Dox and DHT treatment. (Scale bar, 50 µm.) (B) Percentage of SA-β-galactosidase-positive neurite-bearing and neurite-retracted cells 4 d after Dox and DHT treatment. Data represent mean ± SEM and each point represents the average percentage from an individual experiment, with an average of 103 cells analyzed per experiment. *P < 0.05, independent samples t test. (C) qRT-PCR analysis was performed to evaluate relative expression of the senescence-associated genes Col3a1, Cdkn1c, and Cdkn2c in differentiated PC12 cells expressing AR10Q, AR112Q, AR111Q V582F, or AR111Q K387/519R 8 d after Dox and DHT treatment. Data represent mean ± SEM from three replicates per cell line. ns P > 0.05, *P < 0.05, **P < 0.01, ***P < 0.001, and ****P < 0.0001, independent samples t test or Welch’s t test. (D) Quantification of soma Col3a1 and cytoplasmic Cdkn2c protein (mean gray value; normalized to background) in neurite-bearing and neurite-retracted cells expressing hormone-bound polyQ-expanded AR 4 d after Dox and DHT treatment. Each point represents a single cell (Col3a1: neurite-bearing, n = 53; neurite-retracted, n = 32; Cdkn2c: neurite-bearing, n = 45; neurite-retracted, n = 48). Data represent mean ± SD from three individual wells. ns P > 0.05, independent samples t test; *P < 0.05, Welch’s t test.
Fig. 7.
Fig. 7.
Enriched pathways related to neurite growth and senescence represented by differential and unchanged genes between AR112Q and AR111Q V582F cells. (A) Venn diagram depicting the number of down-regulated, up-regulated, and unchanged genes in AR111Q V582F samples compared to AR112Q samples. (B) Gene ontology (GO) analysis was conducted using down-regulated (absolute log2 fold change ≤−1), up-regulated (absolute log2 fold change ≥1), and unchanged (adjusted P > 0.05) gene sets and significant pathways related to neurite growth and senescence were selected and graphed by −log10(FDR). The number of down-regulated, up-regulated, or unchanged genes associated with each pathway is shown next to each bar.
Fig. 8.
Fig. 8.
Enriched pathways related to neurite growth and senescence represented by differential and unchanged genes between AR111Q V582F and AR111Q K387/519R cells. (A) Venn diagram depicting the number of down-regulated, up-regulated, and unchanged genes in AR111Q K387/519R samples compared to AR111Q V582F samples. (B) Gene ontology (GO) analysis was conducted using down-regulated (absolute log2 fold change ≤−1), up-regulated (absolute log2 fold change ≥1), and unchanged (adjusted P > 0.05) gene sets, and significant pathways related to neurite growth and senescence were selected and graphed by −log10(FDR). The number of down-regulated, up-regulated, or unchanged genes associated with each pathway is shown next to each bar.

Similar articles

Cited by

References

    1. Kennedy W. R., Alter M., Sung J. H., Progressive proximal spinal and bulbar muscular atrophy of late onset. A sex-linked recessive trait. Neurology 18, 671–680 (1968). - PubMed
    1. Harding A. E., et al. , X-linked recessive bulbospinal neuronopathy: A report of ten cases. J. Neurol. Neurosurg. Psychiatry 45, 1012–1019 (1982). - PMC - PubMed
    1. Chevalier-Larsen E. S., et al. , Castration restores function and neurofilament alterations of aged symptomatic males in a transgenic mouse model of spinal and bulbar muscular atrophy. J. Neurosci. 24, 4778–4786 (2004). - PMC - PubMed
    1. Katsuno M., et al. , Testosterone reduction prevents phenotypic expression in a transgenic mouse model of spinal and bulbar muscular atrophy. Neuron 35, 843–854 (2002). - PubMed
    1. Soraru G., et al. , Spinal and bulbar muscular atrophy: Skeletal muscle pathology in male patients and heterozygous females. J. Neurol. Sci. 264, 100–105 (2008). - PubMed