. 2024 Jul 16;121(29):e2400666121.
doi: 10.1073/pnas.2400666121. Epub 2024 Jul 8.

Insulin receptor orchestrates kidney antibacterial defenses

Affiliations

Insulin receptor orchestrates kidney antibacterial defenses

Laura Schwartz et al. Proc Natl Acad Sci U S A. .

Abstract

Urinary tract infection (UTI) commonly afflicts people with diabetes. This augmented infection risk is partly due to deregulated insulin receptor (IR) signaling in the kidney collecting duct. The collecting duct is composed of intercalated cells (ICs) and principal cells (PCs). Evidence suggests that ICs contribute to UTI defenses. Here, we interrogate how IR deletion in ICs impacts antibacterial defenses against uropathogenic Escherichia coli. We also explore how IR deletion affects immune responses in neighboring PCs with intact IR expression. To accomplish this objective, we profile the transcriptomes of IC and PC populations enriched from kidneys of wild-type and IC-specific IR knock-out mice that have increased UTI susceptibility. Transcriptomic analysis demonstrates that IR deletion suppresses IC-integrated stress responses and innate immune defenses. To define how IR shapes these immune defenses, we employ murine and human kidney cultures. When challenged with bacteria, murine ICs and human kidney cells with deregulated IR signaling cannot engage central components of the integrated stress response-including activating transcriptional factor 4 (ATF4). Silencing ATF4 impairs NFkB activation and promotes infection. In turn, NFkB silencing augments infection and suppresses antimicrobial peptide expression. In diabetic mice and people with diabetes, collecting duct cells show reduced IR expression, impaired integrated stress response engagement, and compromised immunity. Collectively, these translational data illustrate how IR orchestrates collecting duct antibacterial responses and the communication between ICs and PCs.

Keywords: NF-κB; collecting duct; insulin receptor; intercalated cells; pyelonephritis.


Conflict of interest statement

Competing interests statement:The authors declare no competing interest.

Figures

Fig. 1.
Fig. 1.
Systemic IR inhibition increases kidney bacterial burden. (A) Schematic showing how female C3H/HeOuJ were enterally administered vehicle or OSI-906 (60 mg/kg) prior to transurethral UPEC infection (strain CFT073). (B) Representative western blot probed for P-IR/IGF1R and GAPDH in kidneys from vehicle- or OSI-906-treated female mice. Each lane depicts protein expression in a separate mouse kidney. (C) Blood (Left) and urine (Right) glucose concentrations measured in a subset of mice subjected to transurethral UTI. Each point depicts glucose measurement in a unique mouse (n = 7 mice/cohort). Graphs show the mean values and SD. (D) Kidney UPEC titers enumerated 24 h after transurethral infection. Each point shows mean kidney pair UPEC burden from a separate mouse (n = 11 to 12 mice/cohort). The solid horizontal lines indicate the geometric means. The dotted horizontal line indicates the limit of detection. (C/D) Asterisks denote significance for the indicated pairwise comparison (Mann–Whitney U test). **P < 0.01 and ***P < 0.001.
Fig. 2.
Fig. 2.
IR deletion in ICs increases kidney bacterial burden. (A) Schematic of the breeding strategy to delete IR in murine ICs. (B) Blood glucose concentrations measured in IRflox and IRKO mice. Each point depicts the glucose measurement in a unique mouse 24 h after UTI. Graphs show the mean values and SD. (C) Kidney UPEC burden enumerated 24 h after direct bladder infection in IRflox and IRKO mice. Each point shows mean kidney pair UPEC burden from a separate mouse (n = 8 mice/cohort). The solid horizontal lines indicate the geometric means. The dotted horizontal line indicates the limit of detection. Asterisks denote significance for the indicated pairwise comparison (Mann–Whitney U test). ***P < 0.001.
Fig. 3.
Fig. 3.
Enrichment of ICs and PCs yields populations with unique expression signatures. (A) Schematic of V-ATPase-tdT (WT) and VATPase-IRKO-tdT (IRKO) mice and the approach to enrich IC and PC populations using FACS. (B) Immunofluorescent staining of kidney sections from WT (top row) and IRKO mice (bottom row) showing tdT expression in ICs (red) does not colocalize with aquaporin 2 (AQP2, green) or DBA labeled PCs (green). TdT colocalizes with IC-specific proteins AE1 and V-ATPase V1B1 (green). Nuclei are labeled with DAPI (blue). Magnification 60X. (Scale bars, 50 μm.) (C) Representative ethidium bromide agarose gel using FACS-enriched IRKO PCs and ICs shows a 488 base pair PCR product indicative of the IRflox allele in PC and IC populations and a 388 base pair product indicative of Insr deletion in IC populations. Gapdh served as a loading control. (D) Relative Insr mRNA transcript expression measured by qRT-PCR in FACS-enriched IC and PC populations from WT and IRKO mice. Graphs show the mean expression and SEM. The asterisk marks significance between genotypes (n = 6 samples/genotype; Mann–Whitney). **P < 0.01. (E) Principal component analysis showing linear dimensionality reduction in FACS-enriched IC and PC populations. Each point represents IC and PC populations enriched from a different mouse and the 95% confidence ellipses are graphed. (F) Heatmap of established IC and PC marker genes in enriched IC and PC populations from WT and IRKO mice. (G) Heatmap of the 1,000 most differentially expressed genes in ICs and PCs from WT and IRKO mice. (F and G) Columns are individual mice and rows are specific genes.
Fig. 4.
Fig. 4.
IR deletion in ICs suppresses integrated stress responses, NFkB signaling, and innate immune defenses. (A) Ingenuity pathway analysis showing the predicted canonical pathways that are suppressed (blue bars) or activated (red bars) in IRKO ICs compared to WT ICs (|Z-score| > 2). Gray bars indicate that no prediction could be made on pathway activation or suppression. (B) Metascape TRRUST analysis identifies transcription factors regulating differential gene expression in IRKO ICs. Blue bars indicate the transcription factors whose activity is predicted to be suppressed. (C) Heatmap showing changes in innate immune gene ontology term enrichment in IRKO ICs compared to WT ICs. (A–C) RNA-seq data analyses were performed on ICs enriched from WT and IRKO mouse kidneys as shown in Fig. 3. (D/E) Cultured WT and IRKO ICs (D) were challenged with UPEC. (E) Human medullary kidney cells were pretreated with OSI-906 (1 μM) and then challenged with UPEC. Shown is the percentage of bacteria attaching to the cellular surface (Left) or invading the cells (Right). Graphs show the mean and SEM. Results are from four (D) or six (E) independent experiments performed in triplicate. Asterisks denote significant P-values for the pairwise comparison (Student’s t test). *P < 0.05 and **P < 0.01. (F) WT and IRKO ICs were challenged with UPEC for 60 min. Antibacterial response RT-PCR arrays were performed (n = 4 samples/genotype) and a protein–protein interaction network was generated with STRING using the significantly suppressed genes identified by the arrays in SI Appendix, Table S2. Nodes represent gene products and edges indicate functional or physical interactions. Edge width corresponds to experimentally determined interaction score. Blue square nodes indicate gene targets of NFkB, and yellow circle nodes depict genes that have not been identified as targets of NFkB.
Fig. 5.
Fig. 5.
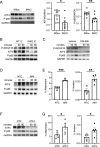
IR deletion or inhibition suppresses ATF4 and NFkB signaling. (A) Female IRKO and IRflox control mice were transurethrally infected with UPEC. Six hours after infection, ICs were enriched by MACS. Western blot (Left) showing that NFκB and ATF4 are suppressed in IRKO ICs. Each lane depicts ICs enriched from an individual mouse. This experiment was performed twice with 3 to 5 mice/genotype. Densitometry (Right) showing relative abundance of P-p65 NFκB (ser536) and ATF4 normalized to GAPDH from all mice subjected to UTI (n = 8/genotype). Graphs show the mean and SEM. (B/C) Cultured WT and IRKO ICs (B) were challenged with CFT073. (C) Human medullary kidney cells were pretreated with OSI-906 (1 μM) and then challenged with UPEC. (B/C) Representative western blots showing P-IR/IGF1R, ATF4, P-p65 NFkB (ser536), and GAPDH expression. (D-G) Murine ICs (D/E) or human medullary kidney cells (F/G) were transiently transfected with an ATF4 or a nontargeting control (NTC) siRNA pool. (D/F) Representative western blots showing ATF4, P-p65 NFkB (ser536), and GAPDH expression. (E/G) Murine ICs (E) or human medullary kidney cells (G) were challenged with UPEC. Shown is the percentage of bacteria attaching to the cellular surface (Left) or invading the cells (Right). Graphs show the mean and SEM. Results are from four or five independent experiments performed in quadruplicate (n = 4 to 5). (A, E, and G) Asterisks denote significant P-values for the pairwise comparison (Student’s t test). *P < 0.05, **P < 0.01, and ***< P < 0.001. (BD and F) Densitometry was performed to measure relative target abundance from three independent experiments and is shown in SI Appendix, Fig. S8.
Fig. 6.
Fig. 6.
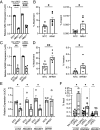
Silencing NFkB promotes UPEC infection and suppresses AMP expression. (A/B) Cultured murine ICs and (C/D) human kidney medullary epithelial cells were transiently transfected with a NFkB or nontargeting control (NTC) siRNA pool and challenged with UPEC. (A/C) qRT-PCR confirms NFkB silencing in noninfected and UPEC-infected cells. (B/D) Shown is the percentage of bacteria attaching to the cellular surface (Left) or invading the cells (Right). Graphs show the mean and SEM from six independent experiments performed in triplicate (n = 6). (E) qRT-PCR was performed to assess LCN2, RNASE4, RNASE7, and DEFB1 transcript expression in UPEC-infected human medullary epithelial cells transfected with a NFKB1 or NTC siRNA pool. Graphs show the mean expression and SEM from four independent experiments. (F) Chromatin immunoprecipitation was performed using noninfected and UPEC-challenged human kidney medullary epithelial cells. Binding of P65 NFkB to the promoters of LCN2, RNASE4, and RNASE7 was assessed by qPCR with immunoprecipitated DNA using primers specific to promoter regions of respective genes. Asterisks denote significant P values for the pairwise comparison (Student’s t test). *P < 0.05, **P < 0.01, ***P < 0.001, and ****P < 0.0001.
Fig. 7.
Fig. 7.
IR deletion in ICs suppresses immune responses in PCs. (A) Ingenuity pathway analysis revealing the predicted canonical pathways that are suppressed (blue bars) in IRKO PCs compared to WT PCs (|Z-score| > 2). Gray bars highlight no prediction could be made on pathway activation or suppression. (B) Metascape TRRUST prediction of transcription factors regulating the suppressed genes in IRKO PCs. Blue bars show the transcription factors whose activity is predicted to be suppressed. (A/B) Analyses of RNA-seq data were performed on PCs enriched from WT and IRKO mouse kidneys as shown in Fig. 3. (C) Representative western blot probed for IRβ, P-p65 NFkB (ser536), and GAPDH in noninfected and UPEC-infected PCs from WT and IRKO mice. Densitometry was performed to measure relative target abundance from four independent experiments and is shown in SI Appendix, Fig. S10.
Fig. 8.
Fig. 8.
ICs and PCs communicate to engage immune responses. (A) Concentrations of TNFα, IL-33, IL-17A, Lcn 2, and RNase 4 in conditioned media isolated from WT ICs (closed shapes) and IRKO ICs (open shapes) before and after UPEC infection. Graphs show the mean concentration and SEM. Asterisks denote significant P values for the pairwise comparison (Student’s t test). *P < 0.05, **P < 0.01, and ****P < 0.0001. (B) Representative western blot probed for P-p65 NFkB (ser536) and GAPDH in PCs stimulated for 5 min (Left) or 4 h (Right) with 5 ng/mL recombinant murine TNFα, IL-33, IL-17A, Lcn 2, or RNase 4. (C) Representative western blot probed for P-p65 NFkB (ser536) and GAPDH in noninfected PCs (control) or PCs incubated for 1 h in conditioned media isolated from noninfected WT and IRKO ICs (no UPEC) or UPEC-infected WT and IRKO ICs (UPEC).
Fig. 9.
Fig. 9.
The integrated stress response is suppressed in global diabetes. (A) Nondiabetic ob/+ and diabetic ob/ob female mice were transurethrally infected with UPEC. Twenty-four hours after infection, UPEC were enumerated in the kidneys. Each point shows mean kidney pair UPEC burden from a separate mouse (n = 11 mice/genotype). The solid horizontal lines indicate the geometric means of each group. The dotted horizontal line indicates the limit of detection. The asterisk denotes significance for the indicated pairwise comparison (Mann–Whitney U test). (B) Relative Insr, Nfkb1, and Eif2s1 expression in MACS-enriched ICs (Left) and PCs (Right) from noninfected female ob/+ and ob/ob mice (n = 10 mice/genotype). Graphs show the mean expression and SEM. Asterisks denote significant P values for the pairwise comparison (Student’s t test). *P < 0.05, **P < 0.01, and ****P < 0.0001. (C) Available kidney snRNA-seq and scRNA-seq data were accessed from three published studies of people with and without diabetes (–34). Violin plots (Left) and dot plots (Right) showing the expression of IR and integrated stress response genes in IC and PC clusters shown in SI Appendix, Fig. S12 from nondiabetic (control) and diabetic kidneys (DKD). Dot size indicates the percentage of cells expressing marker genes, and the color represents the average gene expression value (Right). Human subject information can be found in SI Appendix, Table S6. *P < 0.05, **P < 0.01, and ***P < 0.001.

Similar articles

Cited by

References

    1. Nitzan O., Elias M., Chazan B., Saliba W., Urinary tract infections in patients with type 2 diabetes mellitus: Review of prevalence, diagnosis, and management. Diabetes Metab. Syndr. Obes. 8, 129–136 (2015). - PMC - PubMed
    1. Shah B. R., Hux J. E., Quantifying the risk of infectious diseases for people with diabetes. Diabetes Care 26, 510–513 (2003). - PubMed
    1. Muller L. M., et al. , Increased risk of common infections in patients with type 1 and type 2 diabetes mellitus. Clin. Infect. Dis. 41, 281–288 (2005). - PubMed
    1. Kumar S., et al. , Acute pyelonephritis in diabetes mellitus: Single center experience. Indian J. Nephrol. 24, 367–371 (2014). - PMC - PubMed
    1. Kim B., et al. , Diabetes mellitus increases mortality in acute pyelonephritis patients: A population study based on the National Health Insurance Claim Data of South Korea for 2010–2014. Infection 48, 435–443 (2020). - PubMed

MeSH terms