. 2024 Jul 16;121(29):e2401834121.
doi: 10.1073/pnas.2401834121. Epub 2024 Jul 8.

SP1 undergoes phase separation and activates RGS20 expression through super-enhancers to promote lung adenocarcinoma progression

Affiliations

SP1 undergoes phase separation and activates RGS20 expression through super-enhancers to promote lung adenocarcinoma progression

Liying Shan et al. Proc Natl Acad Sci U S A. .

Erratum in

Abstract

Lung adenocarcinoma (LUAD) is the leading cause of cancer-related death worldwide, but the underlying molecular mechanisms remain largely unclear. The transcription factor (TF) specificity protein 1 (SP1) plays a crucial role in the development of various cancers, including LUAD. Recent studies have indicated that master TFs may form phase-separated macromolecular condensates to promote super-enhancer (SE) assembly and oncogene expression. In this study, we demonstrated that SP1 undergoes phase separation and that its zinc finger 3 in the DNA-binding domain is essential for this process. Through Cleavage Under Targets & Release Using Nuclease (CUT&RUN) using antibodies against SP1 and H3K27ac, we found a significant correlation between SP1 enrichment and SE elements, identified the regulator of the G protein signaling 20 (RGS20) gene as the most likely target regulated by SP1 through SE mechanisms, and verified this finding using different approaches. The oncogenic activity of SP1 relies on its phase separation ability and RGS20 gene activation, which can be abolished by glycogen synthase kinase J4 (GSK-J4), a demethylase inhibitor. Together, our findings provide evidence that SP1 regulates its target oncogene expression through phase separation and SE mechanisms, thereby promoting LUAD cell progression. This study also revealed an innovative target for LUAD therapies through intervening in SP1-mediated SE formation.

Keywords: RGS20; SP1; liquid–liquid phase separation; lung cancer; super-enhancer.


Conflict of interest statement

Competing interests statement:The authors declare no competing interest.

Figures
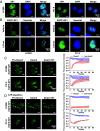
Fig. 1.
Fig. 1.
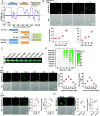
SP1 nuclear condensation and FRAP studies. (A) Immunofluorescence staining of endogenous SP1 protein in H1299 and PC-9 cells using an SP1 antibody. (B) EGFP-SP1 punctum formation in live H1299 and PC-9 cells treated with 5% 1,6-hex or vehicle. Nuclei were visualized by Hoechst staining. (C) FRAP studies of EGFP-SP1 puncta in H1299 and PC-9 cells. Red squares depict photobleached puncta, and green squares depict control puncta. FRAP quantification is shown on the Right. (D) Representative images of FRAP studies of EGFP-SP1 in H1299 and PC-9 cells under ATP depletion conditions. FRAP quantification is shown on the Right.
Fig. 2.
Fig. 2.
Analysis of IDRs of SP1 and examination of their droplet formation. (A) SP1 domain structure, IDR graph, and IDR mutants. The SP1 domain structure is shown in the Top panel. BTD: Buttonhead domain. The graph of IDRs in the SP1 protein (Middle) was analyzed using the PONDR algorithm. Scores > 0.5 indicate disorder. The black lines depict the predicted IDRs. In the Bottom panel, schematic diagrams of six EGFP-SP1 mutants are presented. SP1-N, M, and C contain amino acids 1 to 269, 266 to 530, and 515 to 785, respectively. (B) Representative fluorescence and differential interference contrast (DIC) images of EGFP-SP1-C droplets at different protein concentrations in a buffer containing 125 mM NaCl and 10% PEG-8000 (the same conditions are used hereafter, if not specified). The quantification of droplet numbers and areas is shown in the Bottom panel. (C) Turbidity visualization of EGFP-SP1-C droplet formation. Tubes containing EGFP-SP1-C (10 μM, the same concentration hereafter, if not specified) in the buffer containing PEGs with increasing molecular weights. (D) Phase diagram of turbidity changes of EGFP-SP1-C droplet formation in buffers containing different PEGs. The absorbance was measured at 600 nm. (E) Representative fluorescence and DIC images of EGFP-SP1-C droplets at different NaCl concentrations. The quantification of droplet numbers and areas is shown in the Right panel. (F and G) EGFP-SP1-C droplet formation at different temperatures (F) and in the presence or absence of 5% 1,6-hex (G). Quantification is shown in the Right panel. In F and G, the data are presented as the mean ± SD, and the statistical significance was calculated by one-way ANOVA with Tukey’s post hoc test (F) or Student’s t test (G). *P < 0.05, **P < 0.01, and ***P < 0.001.
Fig. 3.
Fig. 3.
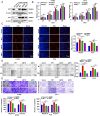
Effects of different SP1 deletions on its biological functions. (A) Expression of SP1 deletion mutants in H1299 and PC-9 cells with simultaneous endogenous SP1 knockdown. A lentivirus carrying sh-SP1 targeting the 3′-UTR of the SP1 mRNA (sh-SP1-3UTR) was used to knock down endogenous SP1, and exogenous SP1 WT and mutants were also generated by lentiviral infection. Western blotting was used to analyze endogenous and exogenous SP1 expression. (B) Viability analyses of H1299 or PC-9 cells expressing WT or mutant SP1 with endogenous SP1 knockdown. CCK-8 assays were used to determine cell survival. (C) Cell proliferation analyses using EdU in H1299 or PC-9 cells expressing WT or mutant SP1 with endogenous SP1 knockdown. (D) Wound healing assays were performed in cells expressing WT or mutant SP1 with endogenous SP1 knockdown. The quantification is shown in the Right panel. (E) Transwell assays were used to evaluate the migration (Top) and invasion (Bottom) of H1299 or PC-9 cells with endogenous SP1 knockdown expressing WT or mutant SP1. The quantification is shown in the Bottom panel. In BE, the data are presented as the mean ± SD and were compared by one-way ANOVA with Tukey’s post hoc test. *P < 0.05, **P < 0.01, ***P < 0.001, ns: not significant.
Fig. 4.
Fig. 4.
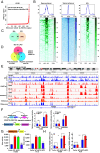
Analysis of the correlation of SP1 with enhancer formation and identification of RGS20 as a target gene through the SE mechanism. (A) Hockey stick plots based on the input-normalized H3K27ac signals in H1299 cells. SEs were defined as those located above the inflection point of the curve, while the remaining enhancers were considered typical enhancers. (B) Heatmaps for genes with differential expression between SE, typical enhancer, and SP1 based on the signals of their closest H3K27ac and SP1 peaks. (C) Venn diagram showing overlapping genes between the SP1 and SE peaks based on CUT&RUN data obtained from H1299 cells. (D) Venn diagram of genes/mRNAs containing LUAD-specific SEs, genes associated with unfavorable clinical outcomes of LUAD patients, and genes overexpressed in LUAD samples. (E) Schematic view across the RGS20 gene locus (chr 8: 53797807–54018308) with genomic and epigenetic information. Graphical active regulatory regions were generated using the ENCODE database. The red box on the RGS20 gene represents an enhancer. (F) Reporter assays to examine the effects of a potential enhancer on RGS20 promoter activity. The 1,511 bp enhancer sequence was subcloned downstream of the RGS20 promoter and luciferase coding sequence to create an enhancer reporter vector. In the Left panel, the relative genomic positions of the RGS20 promoter and potential enhancer and a schematic diagram of the enhancer reporter are presented. A control reporter was generated using a DNA fragment of the same length upstream of the TSS to replace the enhancer. The enhancer reporter and control vectors were cotransfected with the SP1 expression plasmid into H1299 and PC-9 cells, and luciferase activity was subsequently measured (Right). (G and H) The effects of SP1 mutations on RGS20 promoter activity were evaluated. In G, the RGS20 promoter reporter was constructed by inserting the Gaussia luciferase (Gluc)-encoding sequence downstream of the RGS20 promoter. The RGS20 reporter and pCMV-SEAP vectors were cotransfected with the SP1 WT and mutant vectors into H1299 (Left) and PC-9 (Right) cells in triplicate in 24-well plates. Gluc activity in each well was measured and normalized against SEAP activity. In H, the SP1 WT and mutant vectors were transfected into H1299 (Left) and PC-9 (Right) cells with simultaneous knockdown of endogenous SP1 by sh-SP1-3UTR, followed by RT–qPCR to quantify RGS20 mRNA levels, with GAPDH as a control. In FH, the data are presented as the mean ± SD, and the statistical significance was calculated by one-way ANOVA with Tukey’s post hoc test. *P < 0.05, **P < 0.01, ***P < 0.001, ns: not significant.
Fig. 5.
Fig. 5.
Evaluation of the role of SP1-mediated RGS20 expression in promoting LUAD cell malignancy. In AE, H1299 and PC-9 cells were infected with lentivirus carrying sh-SP1 to knock down endogenous SP1 without or with ectopic RGS20 expression, and the cells were analyzed for SP1 and RGS20 expression by western blot (A), cell viability (B), DNA synthesis activity based on EdU incorporation (C), cell migration by wound healing assay (D), and cell migration and invasion by Transwell assay (E). In BE, the data are presented as the mean ± SD and were compared by one-way ANOVA with Tukey’s post hoc test. *P < 0.05, **P < 0.01, ***P < 0.001, ns: not significant.
Fig. 6.
Fig. 6.
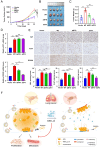
Mouse model study to examine the effects of BTD and ZF3 deletion on SP1-promoted xenograft tumor formation. (AC) Xenograft tumor growth curves (A), excised tumor images (B), and weights (C). PC-9 cells with endogenous SP1 silenced by sh-SP1-3UTR and infected with lentivirus carrying an empty vector, SP1 WT, SP1ΔBTD or SP1ΔZF3 were used for implantation into the right axillary area of nude mice. Tumor size was measured every 2 d after tumor cell implantation, and tumor growth curves were plotted at 8-d intervals (A). Tumors were excised on the 32nd day and photographed (B). Tumor weight was measured (C). (D) Determination of SP1 and RGS20 levels in xenograft tumors using RT–qPCR. (E) IHC analyses of SP1, RGS20, and Ki67 expression in xenograft tumor samples. The IHC images are shown in the Top panel, while the quantification of the staining is presented in the Bottom panel. (F) A schematic diagram showing how SP1 activates RGS20 expression through phase separation and SE mechanisms and subsequently promotes LUAD development. Various transcriptional coactivators can be recruited to SP1-mediated nuclear condensates, which can be disrupted by GSK-J4 to impede LUAD progression. In A, C, D, and E, the data are presented as the mean ± SD and were compared by one-way ANOVA with Tukey’s post hoc test. *P < 0.05, **P < 0.01, ***P < 0.001. ns: not significant.

References

    1. Siegel R. L., Miller K. D., Wagle N. S., Jemal A., Cancer statistics, 2023. CA Cancer J. Clin. 73, 17–48 (2023). - PubMed
    1. Seguin L., Durandy M., Feral C. C., Lung adenocarcinoma tumor origin: A guide for personalized medicine. Cancers 14, 1759 (2022). - PMC - PubMed
    1. Bai Q., Wang J., Zhou X., EGFR exon20 insertion mutations in non-small cell lung cancer: Clinical implications and recent advances in targeted therapies. Cancer Treat Rev. 120, 102605 (2023). - PubMed
    1. Alberti S., Gladfelter A., Mittag T., Considerations and challenges in studying liquid-liquid phase separation and biomolecular condensates. Cell 176, 419–434 (2019). - PMC - PubMed
    1. Jiang S., Fagman J. B., Chen C. Y., Alberti S., Liu B. D., Protein phase separation and its role in tumorigenesis. Elife 9, e60264 (2020). - PMC - PubMed