. 2024 Sep;633(8029):426-432.
doi: 10.1038/s41586-024-07766-6. Epub 2024 Jul 8.

Pathogenicity and transmissibility of bovine H5N1 influenza virus

Affiliations

Pathogenicity and transmissibility of bovine H5N1 influenza virus

Amie J Eisfeld et al. Nature. 2024 Sep.

Abstract

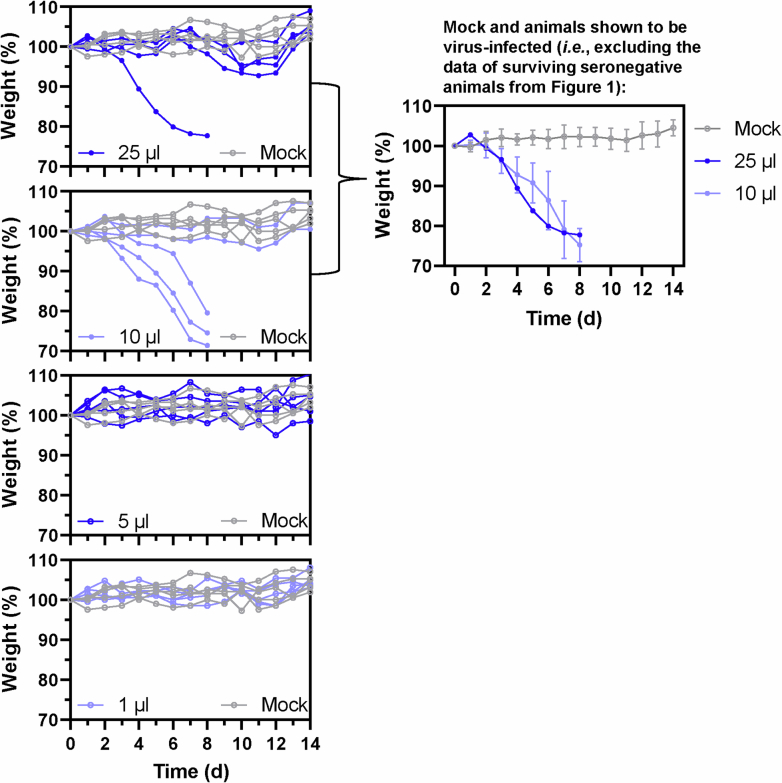
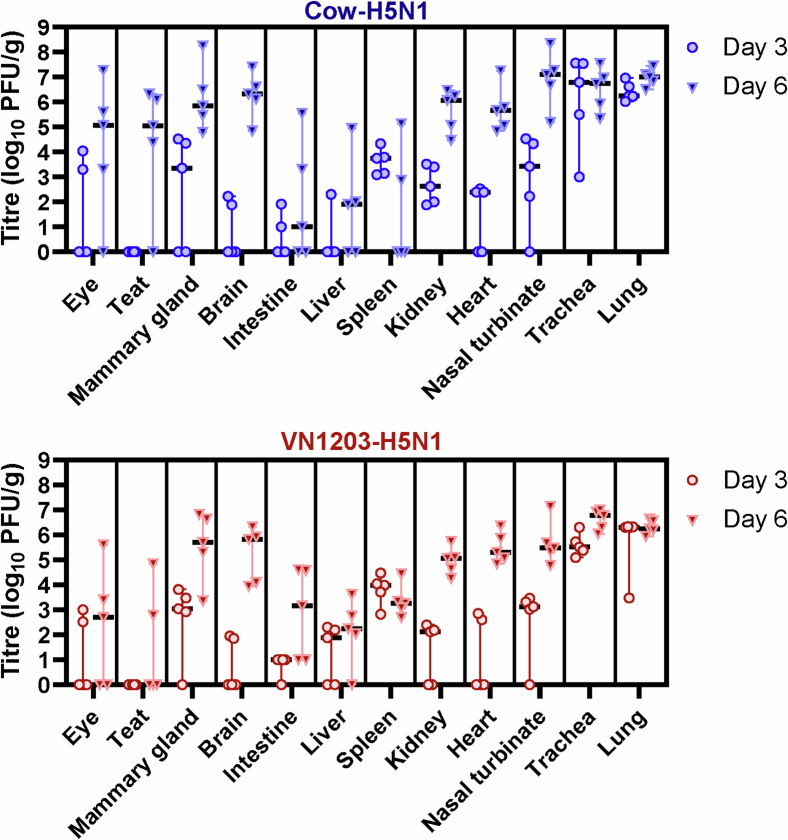
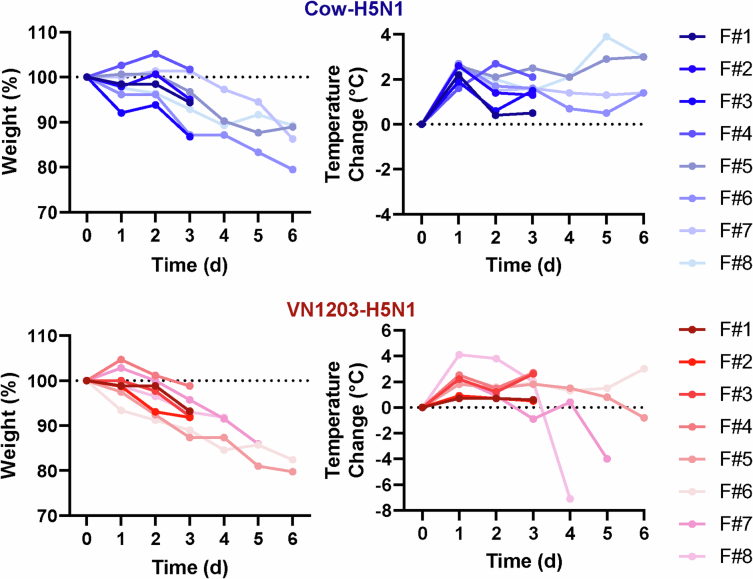
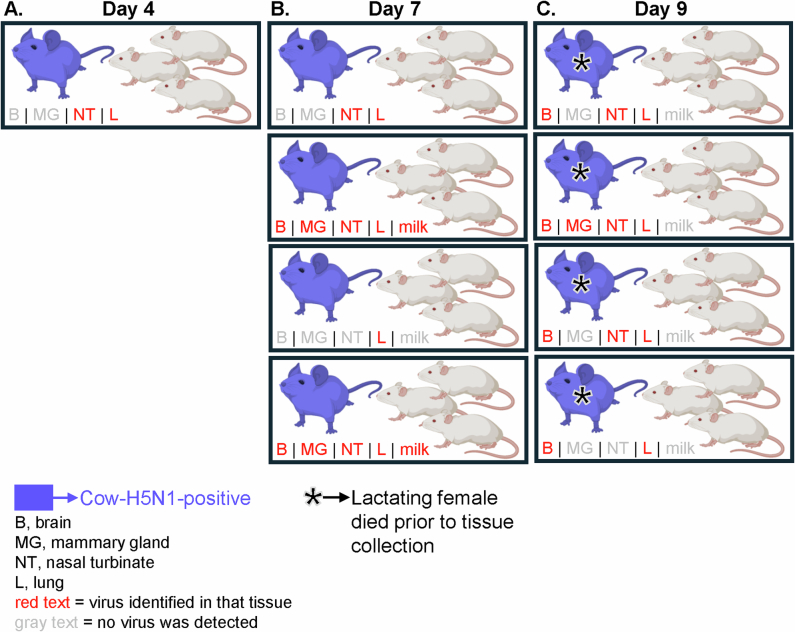
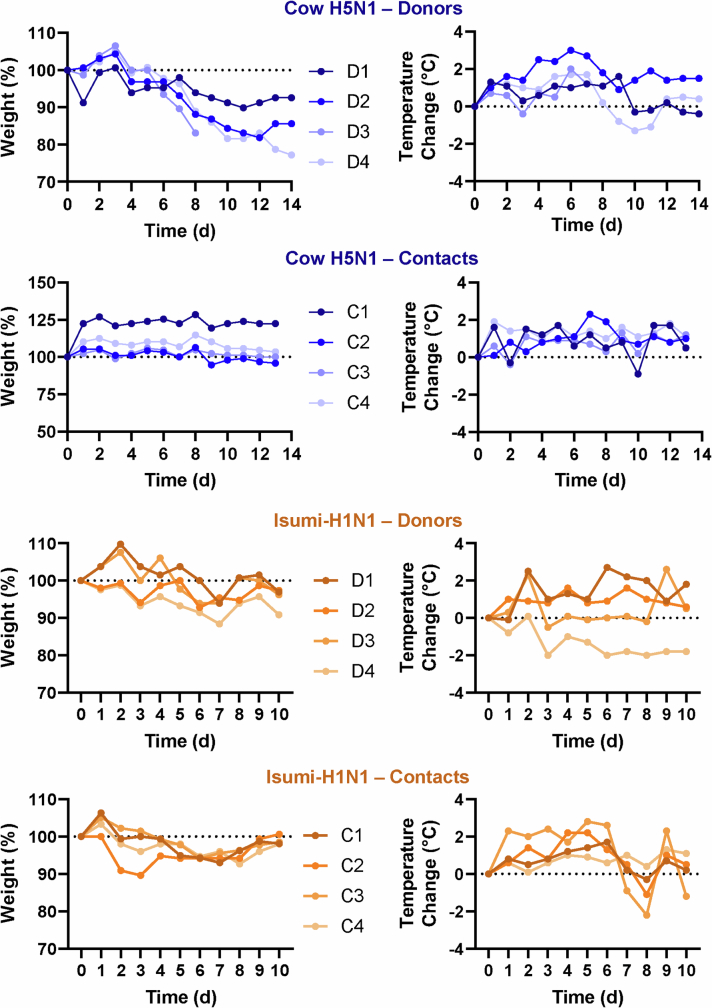
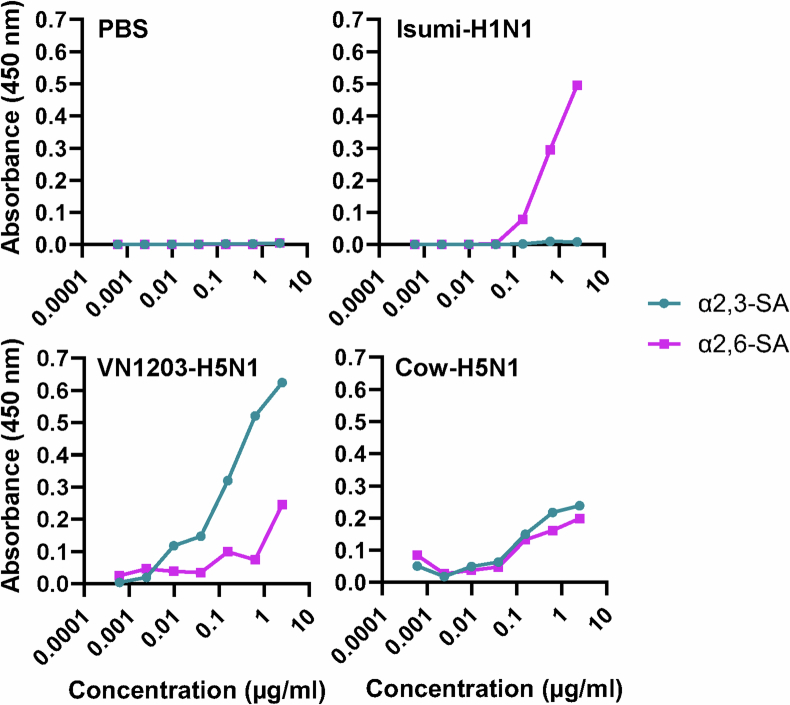
Highly pathogenic H5N1 avian influenza (HPAI H5N1) viruses occasionally infect, but typically do not transmit, in mammals. In the spring of 2024, an unprecedented outbreak of HPAI H5N1 in bovine herds occurred in the USA, with virus spread within and between herds, infections in poultry and cats, and spillover into humans, collectively indicating an increased public health risk1-4. Here we characterize an HPAI H5N1 virus isolated from infected cow milk in mice and ferrets. Like other HPAI H5N1 viruses, the bovine H5N1 virus spread systemically, including to the mammary glands of both species, however, this tropism was also observed for an older HPAI H5N1 virus isolate. Bovine HPAI H5N1 virus bound to sialic acids expressed in human upper airways and inefficiently transmitted to exposed ferrets (one of four exposed ferrets seroconverted without virus detection). Bovine HPAI H5N1 virus thus possesses features that may facilitate infection and transmission in mammals.


Conflict of interest statement

The authors declare no competing interests.

Figures

Fig. 1
Fig. 1. Pathogenicity in mice orally inoculated with milk from an HPAI H5N1 virus-infected cow.
Female BALB/cJ mice (8 weeks old) were lightly anaesthetized and orally inoculated with 25 μl of milk from a healthy cow (‘mock’; n = 5 biologically independent animals per inoculation volume) or different volumes (25, 10, 5 or 1 μl containing 3.25 × 103 PFU per 25 μl, 1.3 × 103 PFU per 10 μl, 6.5 × 102 PFU per 5 μl and 1.3 × 102 PFU per 1 μl; n = 10 biologically independent animals per inoculation volume) of milk from a dairy cow infected with HPAI H5N1 virus. a,b, For five mice per inoculation volume, body weights (a) and survival (b) were monitored daily for 14 days. In a, datapoints represent mean values for each inoculation volume at each timepoint and error is represented by standard deviation. c, The other five mice in each inoculation group were euthanized at 6 days postinfection and nasal turbinate (NT), lung or brain tissues were collected for virus titration in MDCK cells. In c, the floating bars show the median titre for each tissue of each inoculation group and variability is represented by the range. When virus was not detected in a tissue, an arbitrary value below the limit of detection was assigned to enable visualization of the datapoint on the graph. Non-parametric, two-tailed Mann–Whitney tests were used to compare titres of the 25 and 10 μl inoculation groups and no significant differences were found (NT, P = 0.4603; lung, P = 0.5397; brain, P = 0.3016). PFU g−1, PFU per gram of tissue. Source Data
Fig. 2
Fig. 2. Pathogenicity and tissue tropism in mice intranasally inoculated with bovine H5N1 virus.
a,b, BALB/cJ mice (7 weeks old, n = 5 biologically independent animals per dosage) were deeply anaesthetized and intranasally inoculated with tenfold serial dilutions of A/dairy cattle/New Mexico/A240920343-93/2024 (H5N1) in 50 μl of PBS. Body weight (a) and survival (b) were monitored daily for 15 days. In a, the error bars represent the standard deviation. c, BALB/cJ mice (10 weeks old, n = 10 biologically independent animals per virus) were deeply anaesthetized and intranasally inoculated with 103 PFU of A/dairy cattle/New Mexico/A240920343-93/2024 (H5N1; ‘Cow-H5N1’), A/Vietnam/1203/2004 (H5N1; ‘VN1203-H5N1’) or A/Isumi/UT-KK001-01/2018 (H1N1; ‘Isumi-H1N1’) in 50 μl of PBS. At 3 and 6 days postinfection, five mice infected with Cow-H5N1 or Isumi-H1N1 were euthanized and tissues were collected for plaque assays in MDCK cells. For VN1203-H5N1 infections, four mice were euthanized at the day 3 timepoint as one mouse succumbed at day 1 postinfection, and five mice were euthanized at the day 6 timepoint. In c, the floating bars show the median titre for each tissue of each inoculation group and variability is represented by the range. When virus was not detected in a tissue, an arbitrary value below the limit of detection was assigned to enable visualization of the datapoint on the graph. PFU ml−1, PFU per millilitre. Source Data
Fig. 3
Fig. 3. Tissue tropism in ferrets intranasally inoculated with bovine H5N1 virus.
Ferrets (4–6 months old, n = 8 biologically independent animals per virus) were deeply anaesthetized and intranasally inoculated with 106 PFU of A/dairy cattle/New Mexico/A240920343-93/2024 (H5N1; ‘Cow-H5N1’) or A/Vietnam/1203/2004 (H5N1; ‘VN1203-H5N1’) in 500 μl of PBS. At 3 and 6 days postinfection, four ferrets infected with Cow-H5N1 were euthanized and tissues were collected for plaque assays in MDCK cells. For VN1203-H5N1 infections, four ferrets were euthanized at the day 3 timepoint, one ferret succumbed to its infection on day 4, one succumbed on day 5 and two others were euthanized at the day 6 timepoint. Tissues from animals that succumbed on day 4 or day 5 postinfection are represented by triangles and squares, respectively. In the figure panels, the floating bars show the median titre for each tissue of each inoculation group and variability is represented by the range. For VN1203-H5N1-infected animals, medians and ranges are shown only for the day 3 timepoint because some animals in the day 6 timepoint group succumbed earlier. When virus was not detected in a tissue, an arbitrary value below the limit of detection was assigned to enable visualization of the datapoint on the graph. Source Data
Fig. 4
Fig. 4. Transmission of bovine H5N1 virus from lactating female mice to offspring.
Lactating female BALB/c mice (10–12 weeks old) were deeply anaesthetized, intranasally inoculated with 102 PFU of A/dairy cattle/New Mexico/A240920343-93/2024 (H5N1; ‘Cow-H5N1’) and then reunited with their suckling offspring (‘pups’). ac, At day 4 (n = 5 biologically independent animals) (a), day 7 (n = 5 biologically independent animals) (b) or day 9 (n = 6 biologically independent animals) (c) postinfection, lactating females and their pups were euthanized and tissues were collected for plaque assays in MDCK cells. Milk was collected from five of six lactating females on day 9 postinfection only, as indicated, and tested by plaque assays in MDCK cells. In the figure, each box represents one cage with a lactating female and her pups. Animals for which Cow-H5N1 virus was detected in at least one tissue are coloured blue. At the lower left corner of each box, the status of each tissue or milk sample collected from the lactating females is indicated. Grey text indicates that no virus was detected, and red text indicates that virus was detected. Tissue abbreviations are: B, brain; MG, mammary gland; NT, nasal turbinate and L, lung. For the day 9 timepoint group, some of the lactating females succumbed to their infections before the designated endpoints, but within 12 h of tissue collection (indicated by asterisks). Tissues were collected from these mice and analysed along with the others. Created with BioRender.com. Source Data
Fig. 5
Fig. 5. Bovine H5N1 virus transmits inefficiently by respiratory droplets in ferrets.
a,b, Ferrets (4–6 months old, n = 4 biologically independent animals per virus) were deeply anaesthetized and intranasally inoculated with 106 PFU of A/dairy cattle/New Mexico/A240920343-93/2024 (H5N1; ‘Cow-H5N1’) (a) or A/Isumi/UT-KK001-01/2018 (H1N1; ‘Isumi-H1N1’) (b) in 500 μl of PBS. One day later, naive ferrets (n = 1 biologically independent animal per infected animal) were placed in adjacent cages allowing for air flow but no direct contact with the infected animals. Nasal swab samples were collected at the indicated timepoints and tested by plaque assays in MDCK cells. In a and b, the dotted lines represent the limit of detection. c, Sera collected from recovered ferrets were subjected to haemagglutination inhibition (HI) assays with Cow-H5N1 or Isumi-H1N1, and HI titres are shown. The floating bars represent the mean HI titre for each group and error bars represent standard deviation. Ferrets showing no seroconversion were assigned arbitrary values below the limit of detection so they could be represented on the graph. Source Data
Fig. 6
Fig. 6. Bovine H5N1 virus binds to both α2,3 and α2,6 sialic acid residues.
Fourfold serial dilutions of α2,3 and α2,6 sialylglycopolymers adhered to microtitre plates were incubated with 32 haemagglutination (HA) units of the indicated viruses or PBS (negative control). After washing, virus binding was detected by an anti-HA human monoclonal antibody (CR9114) and an HRP-conjugated secondary antibody. The absorbance values for each condition with each virus or PBS are shown. Each dot represents a single biologically independent replicate value. Source Data
Extended Data Fig. 1
Extended Data Fig. 1. Individual body weight profiles of mice orally inoculated with milk from an infected dairy cow.
Individual body weight profiles for the mice shown in Fig. 1a are shown in the four panels at the left (n = 5 biologically independent animals per inoculation volume). Mock-infected body weights, shown in all four panels, are derived from the same mice. In the panel at the right, body weights are shown for mock-infected mice, and for mice that exhibited > 10% body weight loss after inoculation with milk from an infected dairy cow. For the mock-infected mice and mice inoculated with 10 μl of infected milk, the values are the means of 5 or 3 mice, respectively, while a single mouse body weight profile is shown for the 25 μl-infected milk inoculation group. Error bars represent one standard deviation. Source Data
Extended Data Fig. 2
Extended Data Fig. 2. Tissue tropism in mice intranasally inoculated with bovine H5N1 virus, a replicate experiment.
BALB/cJ mice (7 weeks old, n = 10 biologically independent animals per virus) were deeply anaesthetized and intranasally inoculated with 103 PFU of A/dairy cattle/New Mexico/A240920343-93/2024 (H5N1; ‘Cow-H5N1’) or A/Vietnam/1203/2004 (H5N1; ‘VN1203-H5N1’) in 50 μl of PBS. At 3 and 6 days post-infection, five mice in each group were euthanised and tissues were collected for plaque assays in MDCK cells. In the figure panels, the floating bars show the median titre for each tissue of each inoculation group and variability is represented by the range. When virus was not detected in a tissue, an arbitrary value below the limit of detection was assigned to enable visualization of the datapoint on the graph. PFU/g, plaque-forming units per gram of tissue. Source Data
Extended Data Fig. 3
Extended Data Fig. 3. Clinical data associated with ferrets used to assess tissue tropism.
For the same ferrets shown in Fig. 3 (n = 8 biologically independent animals per virus), daily body weights and body temperatures are given. For the VN1203-H5N1-infected group day 6 timepoint, two animals succumbed to their infections prior to the planned euthanasia date (ferret 7 at day 5 and ferret 8 at day 4 post-infection). The dotted lines indicate starting weights or body temperatures. F, ferret. Source Data
Extended Data Fig. 4
Extended Data Fig. 4. Tissue tropism in ferrets intranasally inoculated with bovine H5N1, a replicate experiment.
Ferrets (4—6 months old, n = 4 biologically independent animals per virus) were deeply anaesthetized and intranasally inoculated with 106 PFU of A/dairy cattle/New Mexico/A240920343-93/2024 (H5N1; ‘Cow-H5N1’), A/Vietnam/1203/2004 (H5N1; ‘VN1203-H5N1’), or A/Isumi/UT-KK001-01/2018 (H1N1; ‘Isumi-H1N1’) in 500 μl of PBS. At 6 days post-infection, ferrets were euthanised and tissues were collected for plaque assays in MDCK cells. In the figure panels, the floating bars show the median titre for each tissue of each inoculation group and variability is represented by the range. When virus was not detected in a tissue, an arbitrary value below the limit of detection was assigned to enable visualization of the datapoint on the graph. PFU/g, plaque-forming units per gram of tissue; PFU/ml, plaque forming units per millilitre. Source Data
Extended Data Fig. 5
Extended Data Fig. 5. Transmission of bovine H5N1 virus from lactating female mice to adult contacts.
Lactating female BALB/cJ mice (10—12 weeks old) were deeply anaesthetized, intranasally inoculated with 102 PFU of A/dairy cattle/New Mexico/A240920343-93/2024 (H5N1; ‘Cow-H5N1’), and then cohoused with adult female BALB/cJ mice (n = 3 biologically independent animals per lactating female). At day 4 (n = 1 biologically independent lactating female) (A), day 7 (n = 4 biologically independent lactating females) (B), or day 9 (n = 4 biologically independent lactating females) (C) post-infection, lactating females and adult contacts were euthanised and tissues were collected for plaque assays in MDCK cells. Milk was collected from 3 of 4 lactating females on day 7 post-infection and all four lactating females on day 9 post-infection and tested by plaque assays in MDCK cells. In the figure, each box represents one cage with a lactating female and the associated adult contact animals. Animals for which Cow-H5N1 was detected in at least one tissue are coloured blue. At the lower left corner of each box, the status of each tissue or milk sample collected from the lactating females is indicated. Gray text indicates that no virus was detected, whereas red text indicates that virus was detected. Tissue abbreviations are given at the lower left of the figure. Created with BioRender.com. Source Data
Extended Data Fig. 6
Extended Data Fig. 6. Clinical data associated with ferrets used to assess respiratory droplet transmission.
For the same ferrets shown in Fig. 5 (n = 4 biologically independent infected donor animals and n = 4 biologically independent aerosol contact animals), daily body weights and body temperatures are shown. The dotted lines indicate starting weights or body temperatures. D, donor (infected) ferret; C, contact ferret. Source Data
Extended Data Fig. 7
Extended Data Fig. 7. Bovine H5N1 virus binds to both α2,3 and α2,6 sialic acid residues, replicate experiment 2.
Four-fold serial dilutions of α2,3 and α2,6 sialylglycopolymers adhered to microtitre plates were incubated with 32 hemagglutination (HA) units of the indicated viruses or PBS (negative control). After washing, virus binding was detected by an anti-HA human monoclonal antibody (CR9114) and an HRP-conjugated secondary antibody. The absorbance values for each condition with each virus or PBS are shown. Each dot represents the mean of two biologically independent replicate values. Source Data
Extended Data Fig. 8
Extended Data Fig. 8. Bovine H5N1 virus binds to both α2,3 and α2,6 sialic acid residues, replicate experiment 3.
Four-fold serial dilutions of α2,3 and α2,6 sialylglycopolymers adhered to microtitre plates were incubated with 16 hemagglutination (HA) units of the indicated viruses or PBS (negative control). After washing, virus binding was detected by an anti-HA human monoclonal antibody (CR9114) and an HRP-conjugated secondary antibody. The absorbance values for each condition with each virus or PBS are shown. Each dot represents a single biologically independent replicate value. Source Data

Comment in

  • Bovine H5N1 binds poorly to human-type sialic acid receptors.
    Santos JJS, Wang S, McBride R, Adams L, Harvey R, Zhao Y, Wrobel AG, Gamblin S, Skehel J, Lewis NS, Paulson JC, Hensley SE. Santos JJS, et al. Nature. 2025 Apr;640(8059):E18-E20. doi: 10.1038/s41586-025-08821-6. Epub 2025 Apr 16. Nature. 2025. PMID: 40240859 No abstract available.
  • Receptor-binding specificity of a bovine influenza A virus.
    Chopra P, Ray SD, Page CK, Shepard JD, Kandeil A, Jeevan T, Bowman AS, Ellebedy AH, Webby RJ, de Vries RP, Tompkins SM, Boons GJ. Chopra P, et al. Nature. 2025 Apr;640(8059):E21-E27. doi: 10.1038/s41586-025-08822-5. Epub 2025 Apr 16. Nature. 2025. PMID: 40240861 No abstract available.

References

    1. USDA Animal and Plant Health Inspection Service. Highly Pathogenic Avian Influenza (HPAI) Detections in Livestock. USDAwww.aphis.usda.gov/livestock-poultry-disease/avian/avian-influenza/hpai-... (2024).
    1. Caserta, L. C. et al. Spillover of highly pathogenic avian influenza H5N1 virus to dairy cattle. Nature10.1038/s41586-024-07849-4 (2024). - PMC - PubMed
    1. CDC Confirms Second Human H5 Bird Flu Case in Michigan; Third Case Tied to Dairy Outbreak. CDCwww.cdc.gov/media/releases/2024/p0530-h5-human-case-michigan.html (2024).
    1. Uyeki, T. M. et al. Highly pathogenic avian influenza A(H5N1) virus infection in a dairy farm worker. N. Engl. J. Med.10.1056/NEJMc2405371 (2024). - PubMed
    1. Guan, L. et al. Cow’s milk containing avian influenza A(H5N1) Virus - heat inactivation and infectivity in mice. N. Engl. J. Med.10.1056/NEJMc2405495 (2024). - PubMed

MeSH terms