. 2024 Oct:88:101985.
doi: 10.1016/j.molmet.2024.101985. Epub 2024 Jul 6.

Long-term metabolic effects of non-nutritive sweeteners

Affiliations

Long-term metabolic effects of non-nutritive sweeteners

Moran Rathaus et al. Mol Metab. 2024 Oct.

Abstract

Objective: Excessive consumption of added sugars has been linked to the rise in obesity and associated metabolic abnormalities. Non-nutritive sweeteners (NNSs) offer a potential solution to reduce sugar intake, yet their metabolic safety remains debated. This study aimed to systematically assess the long-term metabolic effects of commonly used NNSs under both normal and obesogenic conditions.

Methods: To ensure consistent sweetness level and controlling for the acceptable daily intake (ADI), eight weeks old C57BL/6 male mice were administered with acesulfame K (ace K, 535.25 mg/L), aspartame (411.75 mg/L), sucralose (179.5 mg/L), saccharin (80 mg/L), or steviol glycoside (Reb M, 536.25 mg/L) in the drinking water, on the background of either regular or high-fat diets (in high fat diet 60% of calories from fat). Water or fructose-sweetened water (82.3.gr/L), were used as controls. Anthropometric and metabolic parameters, as well as microbiome composition, were analyzed following 20-weeks of exposure.

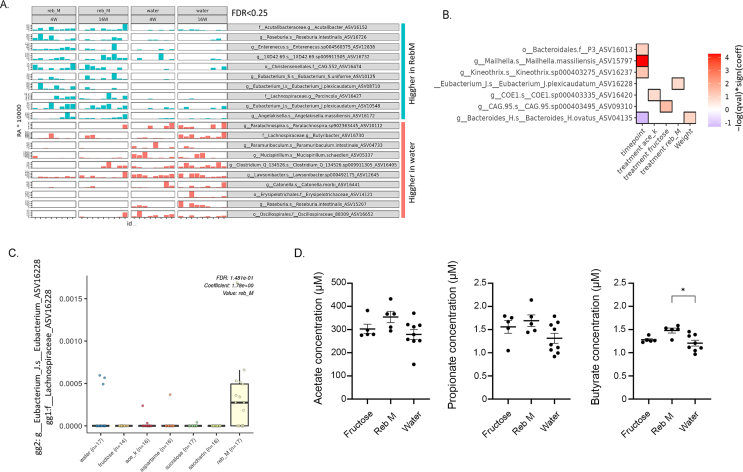
Results: Under a regular chow diet, chronic NNS consumption did not significantly affect body weight, fat mass, or glucose metabolism as compared to water consumption, with aspartame demonstrating decreased glucose tolerance. In diet-induced obesity, NNS exposure did not increase body weight or alter food intake. Exposure to sucralose and Reb M led to improved insulin sensitivity and decreased weight gain. Reb M specifically was associated with increased prevalence of colonic Lachnospiracea bacteria.

Conclusions: Long-term consumption of commonly used NNSs does not induce adverse metabolic effects, with Reb M demonstrating a mild improvement in metabolic abnormalities. These findings provide valuable insights into the metabolic impact of different NNSs, aiding in the development of strategies to combat obesity and related metabolic disorders.

Keywords: Glucose metabolism; Insulin sensitivity; Microbiome; Non-nutritive sweeteners; Obesity; Reb M.


Conflict of interest statement

Declaration of competing interest None.

Figures

Figure 1
Figure 1
Effects of Long-Term Non-Nutritive Sweetener (NNS) Consumption on Metabolic Parameters under Regular Diet Conditions. A. Weekly body weight measurements (n = 9–10 mice/group). B. Body weight at week 18 (n = 9–10 mice/group). C and D. Lean (C) and fat (D) mass percentages measured by NMR at 19 weeks of age (n = 7–10 mice/group). E. Fasting blood glucose levels at week 18 (n = 9–10 mice/group). F. Intraperitoneal glucose-tolerance test at week 17 (n = 9–10 mice/group; 1 g/kg glucose) with corresponding area under the curve (AUC) calculation (G). H. Intraperitoneal insulin-tolerance test using regular human insulin (0.75 IU/kg body weight) at week 15 (n = 3–5 mice/group) with corresponding AUC calculation (I). J-Q. Mice were housed in metabolic cages for 60 h (n = 7–8 mice/group) and the following parameters were collected: cumulative drinking (J) and feeding (L), heat production (O) and respiratory exchange ratios (P,Q). Based on this data and as described in the methods section, daily average drinking (K) and feeding (M) as well as cumulative calories (N) were calculated. Data are presented as means ± SEM. (A,F,H) Data analyzed by a two-way ANOVA, with Dunnett's multiple comparisons post-test. (B,D,E,G,K,M,N) Data analyzed by a one-way ANOVA, with a Dunnett's test for multiple comparisons. (C,I,O,Q) Data analyzed by Kruskal–Wallis test followed by Dunn's multiple comparisons test. AUC, area under curve. RER, respiratory exchange rate. ∗p < 0.05. In graph F, ∗ refers to the comparison between water and aspartame. (J,L,P) White and black rectangles on the x-axis represent light and dark phases, respectively. Grey bars denote dark phase. ∗p < 0.05, ∗∗p < 0.01.
Figure 2
Figure 2
Effects of Long-Term Non-Nutritive Sweetener (NNS) Consumption in Diet-Induced Obesity. A. Weekly body weight measurements (n = 9–10 mice/group). B and C. Fat (B) and lean (C) mass percentages measured by NMR at 19 weeks of age (n = 8–10 mice/group). D-K. Mice were housed in metabolic cages for 60 h (n = 6–8 mice/group) and the following parameters were collected: cumulative drinking (D) and feeding (F), heat production (H), activity (I) and respiratory exchange ratios (J,K). Based on this data and as described in the methods section, daily average drinking (E) and cumulative calories (G) were calculated. Data are presented as means ± SEM. (A) Data analyzed by a two-way ANOVA, with Dunnett's multiple comparisons post-test. (B,C,E,H,I,K) Data analyzed by a one-way ANOVA, with a Dunnett's test for multiple comparisons. (G) Data analyzed by Kruskal–Wallis test followed by Dunn's multiple comparisons test. RER, respiratory exchange rate. (D,F,J) White and black rectangles on the x-axis represent light and dark phases, respectively. Grey bars denote dark phase. In graph A, ∗ refers to the comparison between sucralose and fructose/water (black/blue, respectively). # Refers to the comparison between Reb M and fructose/water (black/blue, respectively). ∗p < 0.05, ∗∗p < 0.01, ∗∗∗p < 0.005; #p < 0.05, ##p < 0.01.
Figure 3
Figure 3
Glucose Metabolism and Hepatic Evaluation in Response to Long-Term NNS Consumption under obesity. A. Fasting blood glucose levels at week 18 (n = 9–10 mice/group). B. Intraperitoneal insulin-tolerance test using regular human insulin (1.5 IU/kg body weight) at week 17 (n = 8–10 mice/group) with corresponding AUC calculation (C). D. Intraperitoneal glucose-tolerance test at week 19 (n = 9–10 mice/group; 1 g/kg glucose) with corresponding AUC calculation (E). Lipid profiles (n = 5–7 mice/group), including total cholesterol (F), triglycerides (G), HDL-Cholesterol (H), and LDL-Cholesterol (I), were measured at the end of the experiment. Pathologic evaluation, including steatosis (J) and inflammation (K) scores, was performed on liver tissues (n = 9–10 mice/group). (L) Triglyceride concentrations in liver samples (n = 9–10 mice/group). Serum ALT (M) and AST (N) levels were also measured at the end of the experiment (n = 5–7 mice/group). Data are presented as means ± SEM. (A,C,F–I,L,M,N) Data analyzed by a one-way ANOVA, with a Dunnett's test for multiple comparisons. (B,D) Data analyzed by a two-way ANOVA, with Dunnett's multiple comparisons post-test. (E) Data analyzed by a one-way ANOVA, with a Kruskal–Wallis test for multiple comparisons. (J,K) Data analyzed by Kruskal–Wallis with Dunn's test for multiple comparisons. In graph B, ∗ refers to the comparison between sucralose and fructose/water (black/blue, respectively). # Refers to the comparison between Reb M and fructose/water (black/blue, respectively). ∗p < 0.05 ∗∗p < 0.01, ∗∗∗p < 0.005, #p < 0.05, ##p < 0.01. AUC, area under curve.TG, Triglyceride.
Figure 4
Figure 4
Levels of glycemic markers and adipokines following long term consumption of NNSs under HFD. The levels of the following parameters were evaluated at the end of experiment in plasma samples: A. Insulin (n = 7–10 mice/group). B. C-peptide (n = 8–10 mice/group). C. Adiponectin (n = 9–10 mice/group). D. Leptin (n = 3–4 mice/group). Data are presented as means ± SEM. (A–C) Data analyzed by a one-way ANOVA, with Dunnett's multiple comparisons post-test. (D) Data analyzed by Kruskal–Wallis with Dunn’s test for multiple comparisons. ∗p < 0.05.
Figure 5
Figure 5
Microbial composition in mice with NNSs under HFD. Unweighted UniFrac PCoA plot representing diet-induced obesity mice before (baseline) and after 4 and 16 weeks of HFD colored by timepoints (A) or weight (B) with indicated PC1 and PC2 explaining 28% and 6.5% of the overall variation. C. Taxa bar plot at the class level per NNS and timepoint as indicated. The full taxonomy and ASVs can be found in Supplementary dataset 1. D. Shannon and Simpson diversity at the class- and ASV-levels are shown for baseline (before) and after 4 and 16 weeks of HFD.
Figure 6
Figure 6
Reb M exposure association with specific fecal microbial composition and with blood short-chain fatty acid metabolite. A. Bar plot showing the top 10 increasing and top 10 decreasing ASVs (with genegene2 annotation) between water and RebM. Samples are stratified by group and ordered by time point (full list in Supplementary Dataset 2). Relative abundance (RA) values were multiplied by 10,000 to improve visualization. B. Multivariate Association with Linear Models (Maaslin) was applied to associate between microbial abundance and NNS exposure after controlling for cage, animal, and timepoint. Taxonomic classification of the numbered ASV is indicated. The heat-map indicates associations with q < 0.15 and p < 0.001. The red color indicates positive, and blue indicates negative association with continuous values, and increased or decreased (respectively) from the reference value (ref) in the case of dichotomous conditions. C. Specific association of significant Lachnospiraceae/Eubacterium [greengene 1 (gg1) or gg2 respectively, ASV16228, from panel B] is shown (see also supplementary dataset 1 for ASV sequence and annotations). D. Levels of Acetate (left panel), propionate (middle) and butyrate (right) as measured using gas chromatography–mass spectrometry (GC-MS) in plasma of mice drinking fructose (n = 5), Reb M (n = 5) or water (n = 8–9). Data analyzed by Kruskal–Wallis with Dunn's test for multiple comparisons. ∗p < 0.05.

References

    1. Guideline: sugars intake for adults and children. World Health Organization; Geneva: 2015. - PubMed
    1. Huang Y., Chen Z., Chen B., Li J., Yuan X., Li J., et al. Dietary sugar consumption and health: umbrella review. BMJ. 2023;381 doi: 10.1136/bmj-2022-071609. - DOI - PMC - PubMed
    1. Khan T.A., Lee J.J., Ayoub-Charette S., Noronha J.C., McGlynn N., Chiavaroli L., et al. WHO guideline on the use of non-sugar sweeteners: a need for reconsideration. Eur J Clin Nutr. 2023;77:1009–1013. doi: 10.1038/s41430-023-01314-7. - DOI - PMC - PubMed
    1. Espinosa A., Mendoza K., Laviada-Molina H., Rangel-Méndez J.A., Molina-Segui F., Sun Q., et al. Effects of non-nutritive sweeteners on the BMI of children and adolescents: a systematic review and meta-analysis of randomised controlled trials and prospective cohort studies. Lancet Global Health. 2023;11(Suppl 1):S8. doi: 10.1016/S2214-109X(23)00093-1. - DOI - PubMed
    1. Rogers P.J., Appleton K.M. The effects of low-calorie sweeteners on energy intake and body weight: a systematic review and meta-analyses of sustained intervention studies. Int J Obes. 2021;45:464–478. doi: 10.1038/s41366-020-00704-2. - DOI - PubMed

LinkOut - more resources