

Evolution of serious and life-threatening COVID-19 pneumonia as the SARS-CoV-2 pandemic progressed: an observational study of mortality to 60 days after admission to a 15-hospital US health system
- PMID: 38977360
- PMCID: PMC11256047
- DOI: 10.1136/bmjopen-2023-075028
Evolution of serious and life-threatening COVID-19 pneumonia as the SARS-CoV-2 pandemic progressed: an observational study of mortality to 60 days after admission to a 15-hospital US health system
Abstract
Objective: In order to predict at hospital admission the prognosis of patients with serious and life-threatening COVID-19 pneumonia, we sought to understand the clinical characteristics of hospitalised patients at admission as the SARS-CoV-2 pandemic progressed, document their changing response to the virus and its variants over time, and identify factors most importantly associated with mortality after hospital admission.
Design: Observational study using a prospective hospital systemwide COVID-19 database.
Setting: 15-hospital US health system.
Participants: 26 872 patients admitted with COVID-19 to our Northeast Ohio and Florida hospitals from 1 March 2020 to 1 June 2022.
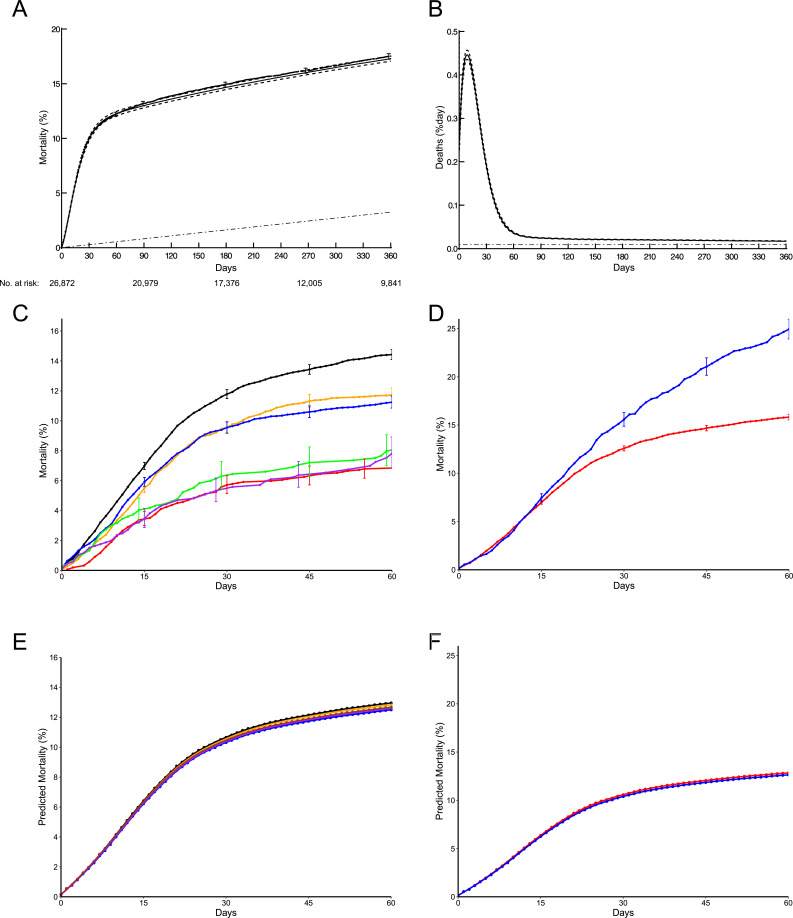
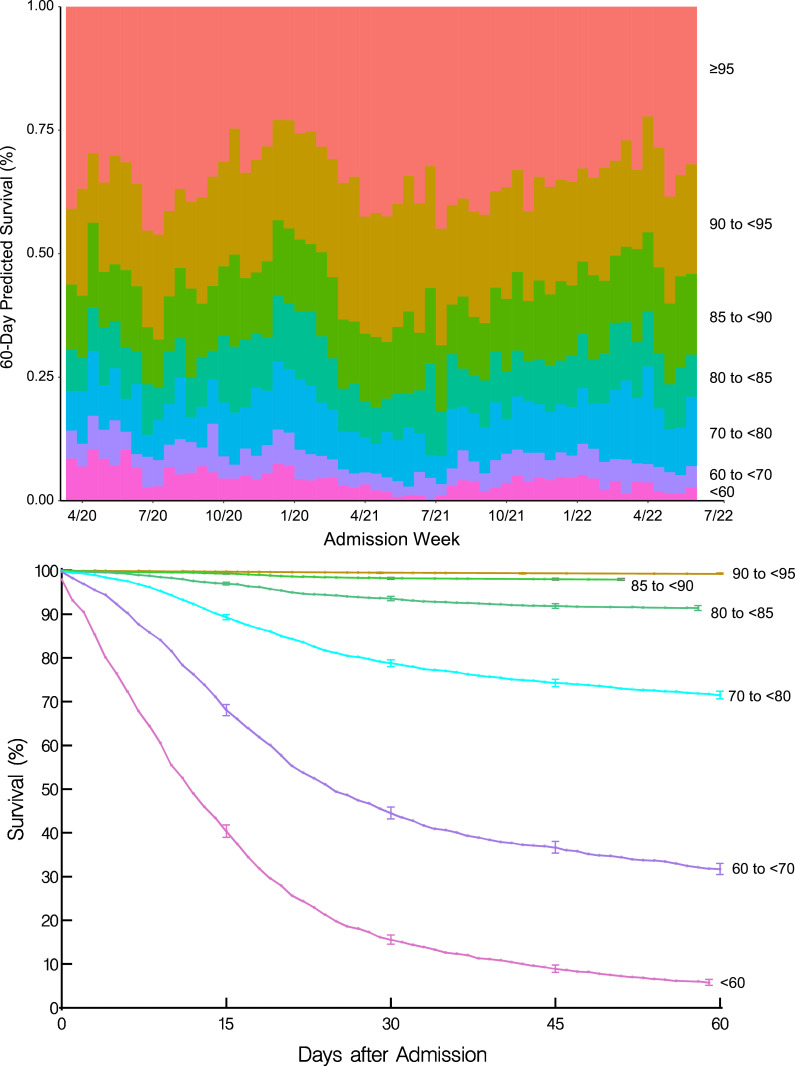
Main outcome measures: 60-day mortality (highest risk period) after hospital admission analysed by random survival forests machine learning using demographics, medical history, and COVID-19 vaccination status, and viral variant, symptoms, and routine laboratory test results obtained at hospital admission.
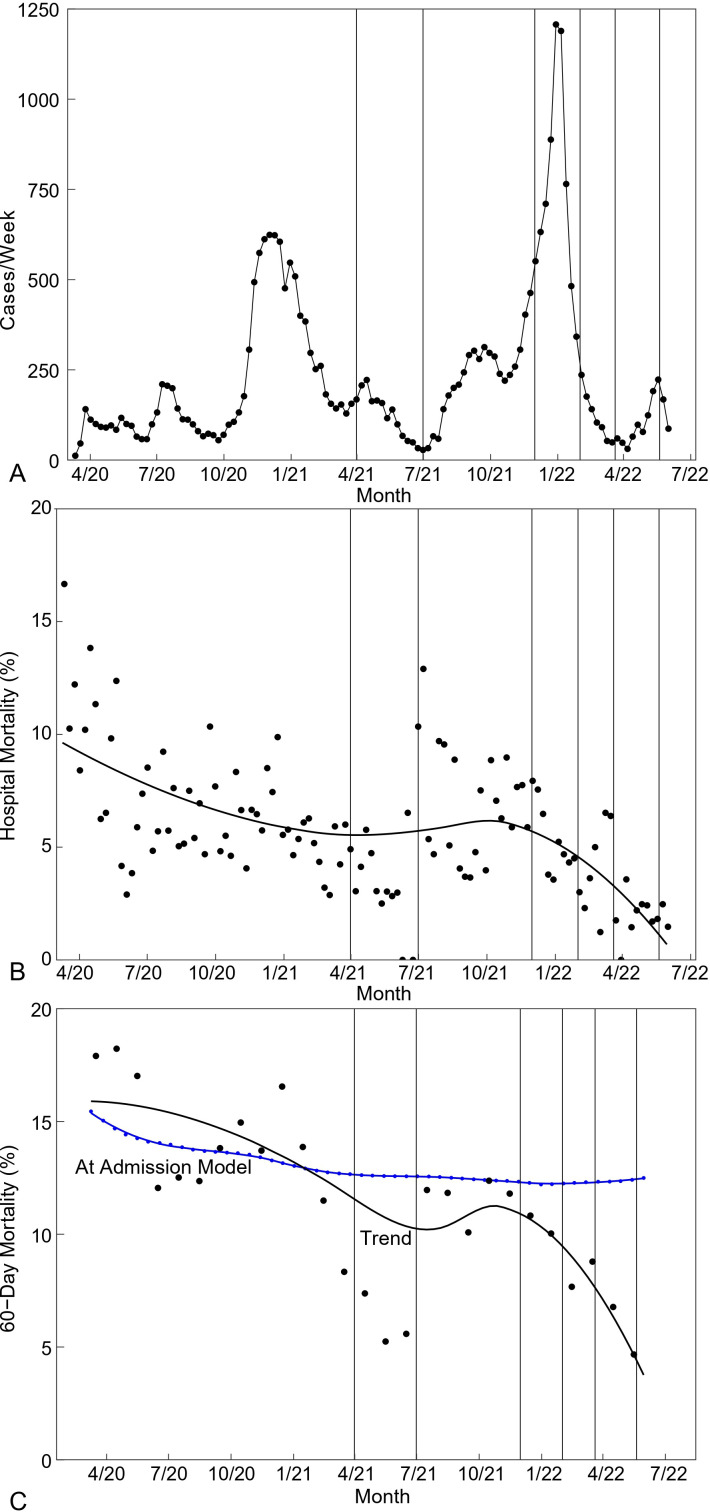
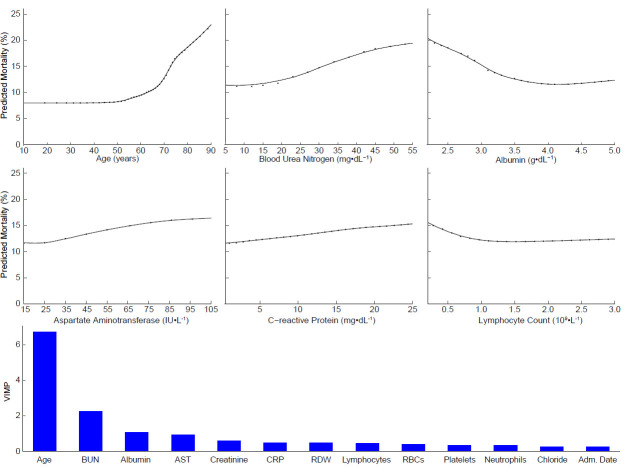
Results: Hospital mortality fell from 11% in March 2020 to 3.7% in March 2022, a 66% decrease (p<0.0001); 60-day mortality fell from 17% in May 2020 to 4.7% in May 2022, a 72% decrease (p<0.0001). Advanced age was the strongest predictor of 60-day mortality, followed by admission laboratory test results. Risk-adjusted 60-day mortality had all patients been admitted in March 2020 was 15% (CI 3.0% to 28%), and had they all been admitted in May 2022, 12% (CI 2.2% to 23%), a 20% decrease (p<0.0001). Dissociation between observed and predicted decrease in mortality was related to temporal change in admission patient profile, particularly in laboratory test results, but not vaccination status or viral variant.
Conclusions: Hospital mortality from COVID-19 decreased substantially as the pandemic evolved but persisted after hospital discharge, eclipsing hospital mortality by 50% or more. However, after accounting for the many, even subtle, changes across the pandemic in patients' demographics, medical history and particularly admission laboratory results, a patient admitted early in the pandemic and predicted to be at high risk would remain at high risk of mortality if admitted tomorrow.
Keywords: Adult intensive & critical care; COVID-19; Public health.
© Author(s) (or their employer(s)) 2024. Re-use permitted under CC BY-NC. No commercial re-use. See rights and permissions. Published by BMJ.
Conflict of interest statement
Competing interests: None declared.
Figures
Similar articles
-
Trends in Patient Characteristics and COVID-19 In-Hospital Mortality in the United States During the COVID-19 Pandemic.JAMA Netw Open. 2021 May 3;4(5):e218828. doi: 10.1001/jamanetworkopen.2021.8828. JAMA Netw Open. 2021. PMID: 33938933 Free PMC article.
-
Risk factors for severe outcomes for COVID-19 patients hospitalised in Switzerland during the first pandemic wave, February to August 2020: prospective observational cohort study.Swiss Med Wkly. 2021 Jul 28;151:w20547. doi: 10.4414/smw.2021.20547. eCollection 2021 Jul 19. Swiss Med Wkly. 2021. PMID: 34324698
-
Hospitalizations and Mortality From Non-SARS-CoV-2 Causes Among Medicare Beneficiaries at US Hospitals During the SARS-CoV-2 Pandemic.JAMA Netw Open. 2022 Mar 1;5(3):e221754. doi: 10.1001/jamanetworkopen.2022.1754. JAMA Netw Open. 2022. PMID: 35262712 Free PMC article.
-
Mortality Among US Patients Hospitalized With SARS-CoV-2 Infection in 2020.JAMA Netw Open. 2021 Apr 1;4(4):e216556. doi: 10.1001/jamanetworkopen.2021.6556. JAMA Netw Open. 2021. PMID: 33830226 Free PMC article.
-
The Need for a Multidimensional Approach to Mortality Prediction in COVID-19: A Critical Review of Recent Findings.J Coll Physicians Surg Pak. 2025 Mar;35(3):394-395. doi: 10.29271/jcpsp.2025.03.394. J Coll Physicians Surg Pak. 2025. PMID: 40055181 Review.
Cited by
-
Prognostic factors in hospitalized patients with COVID-19 pneumonia and effectiveness of prophylactic anticoagulant therapy: a single-center retrospective study.BMC Infect Dis. 2025 Mar 3;25(1):303. doi: 10.1186/s12879-025-10666-3. BMC Infect Dis. 2025. PMID: 40033231 Free PMC article.
References
-
- World Health Organization . Naming the coronavirus disease (COVID-19) and the virus that causes it, Available: https://www.who.int/emergencies/diseases/novel-coronavirus-2019/technica...
-
- Wuhan Municipal Health Commission . Report of clustering pneumonia of unknown etiology in Wuhan City, 31 December 2019. Available: https://www.who.int/emergencies/disease-outbreak-news/item/2020-DON229 [Accessed 31 Jan 2020].
-
- Novel 2019 coronavirus genome . Wuhan-Hu-1, Genbank accession no. Mn908947. Available: http://viro-logical.org/t/novel-2019-coronavirus-genome/319
Publication types
MeSH terms
LinkOut - more resources
Full Text Sources
Medical
Miscellaneous